SQL Database Design For Developers at php[tek] 2024
Policy Challenges of Nuclear Reactor Construction: Cost Escalation and Crowding Out Alternatives
1. POLICY CHALLENGES OF NUCLEAR REACTOR CONSTRUCTION,
COST ESCALATION AND CROWDING OUT ALTERNATIVES
LESSONS FROM THE U.S. AND FRANCE FOR THE EFFORT TO REVIVE THE U.S.
INDUSTRY WITH LOAN GUARANTEES AND TAX SUBSIDIES
MARK COOPER
SENIOR FELLOW FOR ECONOMIC ANALYSIS
INSTITUTE FOR ENERGY AND THE ENVIRONMENT
VERMONT LAW SCHOOL
SEPTEMBER 2010
2. CONTENTS
EXECUTIVE SUMMARY iii
I. DRAWING INSIGHTS FROM THE HISTORICAL AND CROSS-NATIONAL
EXPERIENCE OF THE NUCLEAR INDUSTRY 1
RESEARCH ISSUES ARISING FROM THE DEBATE OVER NUCLEAR
REACTOR CONSTRUCTION
ANALYTIC APPROACH
FINDINGS AND IMPLICATIONS
OUTLINE
II. NUCLEAR REACTOR COST ESCALATION 5
COST TRENDS
COST PROJECTION
Historical Experience
The Contemporary Experience
THE PERSISTENT PATTERN OF DESIGN FLAWS, DELAY, COST ESCALATION
AND FINANCIAL DIFFICULTIES
CONCLUSION
III. A COMPARISON OF COST ESCALATION IN THE U.S. AND FRANCE 18
INCREASING LENGTH OF CONSTRUCTION PERIOD
LACK OF LEARNING CURVE
INCREASING UNIT CAPACITY
MULTI-UNIT SITES
A MULTIVARIATE MODEL FOR THE U.S. PRODUCTION FUNCTION
Variables
Results
Conclusion
IV. IMPACT OF NUCLEAR REACTORS AND CENTRAL STATION
FACILITIES ON ALTERNATIVES 31
FRANCE
Qualitative Analysis
Quantitative Evidence
THE UNITED STATES
Qualitative Analysis
Quantitative Evidence
TECHNOLOGY CHOICES AND ALTERNATIVE RESOURCES
CONCLUSION
IV. CONCLUSION: THE PAST AS PROLOGUE 46
THE PERSISTENT TREND AND UNDERESTIMATION OF COSTS
THE CONTEMPORARY PROBLEMS IN COST PROJECTION
AND PROJECT START-UP
ANALYTIC CONCLUSIONS
POLICY IMPLICATIONS
BIBLIOGRAPHY 58
i
3. LIST OF EXHIBITS
EXHIBIT ES-1: OVERNIGHT COSTS OF PRESSURIZED WATER REACTORS (2008$) iv
EXHIBIT ES-2: INITIAL U.S. COST PROJECTIONS VASTLY UNDERESTIMATE
ACTUAL COSTS v
EXHIBIT ES-3: TESTING THE CROWDING OUT HYPOTHESIS IN THE U.S. v
EXHIBIT ES-4: ANNUAL ELECTRICITY CONSUMPTION IN WESTERN EUROPE AND THE U.S. vi
EXHIBIT II-1: OVERNIGHT COSTS OF FRENCH AND U.S. NUCLEAR REACTORS 6
EXHIBIT II-2: PRESSURIZED WATER REACTOR (2008$) 7
EXHIBIT II-3: FRENCH COST PROJECTIONS 8
EXHIBIT II-4: U.S. UNDER ESTIMATION OF COST 10
EXHIBIT II-5: RECENT COST ESCALATION IN THE U.S. EXCEEDS EUROPE 12
EXHIBIT II-6: PRESSURIZED WATER REACTORS IN THE U.S.: ACTUAL COST COMPARED
TO PROJECTED COSTS OF FUTURE REACTORS 13
EXHIBIT III-1: CONSTRUCTION PERIODS: PRESSURIZED WATER REACTORS 19
EXHIBIT III-2: FRENCH AND U.S. LEARNING CURVES: PRESSURIZED WATER REACTORS 21
EXHIBIT III-3: U. S. COMPANY LEARNING CURVES 22
EXHIBIT III-4: FRENCH AND U.S. REACTOR CAPACITY: PRESSURIZED WATER REACTORS 23
EXHIBIT III-5: COST IMPACT OF MULTI-UNIT CONSTRUCTION 24
EXHIBIT III-6: FACTORS THAT AFFECT REACTOR OVERNIGHT COSTS 25
EXHIBIT III-7: VARIABLES IN THE U.S. DATA SET 26
EXHIBIT III-8: REGRESSION RESULTS 28
EXHIBIT III-9: PERCENTAGE CHANGE IN OVERNIGHT COSTS ASSOCIATED WITH
A ONE-UNIT CHANGE IN THE INDEPENDENT VARIABLE 29
EXHIBIT IV-1: ELECTRICITY CONSUMPTION IN SELECTED WESTERN EUROPEAN NATIONS
AND THE U.S. 33
EXHIBIT IV-2: CENTRAL STATION V. RENEWABLE GENERATION, CROSS NATIONAL, 2007 34
EXHIBIT IV-3: NUCLEAR V. RENEWABLE GENERATION, CROSS NATIONAL, 2007 35
EXHIBIT IV-4: HISTORIC EXAMPLES OF CROWDING OUT IN THE U.S. 37
EXHIBIT IV-5: TESTING THE CROWDING OUT HYPOTHESIS IN THE U.S. 40
EXHIBIT IV-6: REFERENCE COSTS FOR ELECTRICITY GENERATION 41
EXHIBIT IV-7: POTENTIAL ELECTRICITY FROM RENEWABLE RESOURCES:
NORTH AMERICA COMPARED TO EUROPE 42
EXHIBIT IV-8: RENEWABLE AND ENERGY EFFICIENCY POLICIES AFFECT OUTCOMES 43
EXHIBIT IV-9: NUCLEAR COST ESCALATION AND THE SUPERIOR ECONOMICS OF
ALTERNATIVE LOW CARBON RESOURCE 45
EXHIBIT V-1: THE PERSISTENT ESCALATION OF U.S. NUCLEAR REACTOR
CONSTRUCTION COSTS 47
EXHIBIT V-2: INITIAL COST PROJECTIONS VASTLY UNDERESTIMATE ACTUAL COSTS 48
EXHIBIT V-3: THE TROUBLED HISTORY OF THE U.S. NUCLEAR RENAISSANCE
AS SEEN THROUGH THE COST OF THE AP-1000
EXHIBIT V-4: COST ESCALATION, DESIGN PROBLEMS, DELAYS, CANCELLATIONS AND
NEGATIVE FINANCIAL INDICATORS IN THE NUCLEAR RENAISSANCE 51
EXHIBIT V-5: CONTEMPORARY FRENCH NUCLEAR EXECUTION PROBLEMS 54
ii
4. POLICY CHALLENGES OF NUCLEAR REACTOR CONSTRUCTION:
COST ESCALATION AND CROWDING OUT ALTERNATIVES
EXECUTIVE SUMMARY
RESEARCH ISSUES AND APPROACH
Debate over the cost of building new nuclear reactors in the U.S. and abroad has returned
to center stage in U.S. energy policy, as the effort to expand loans guarantees heats up in the
wake of the failure to move climate change legislation forward. The French nuclear program is
frequently given the spotlight because of its presumed success and because the state-owned
French nuclear champion EDF has bought a large stake in a major U.S. utility and is seeking to
build a new U.S. reactor with federal loan guarantees.
Missing from the current scene is information about the history and recent experience of
French nuclear costs, detailed analyses of past U.S. costs or current cost projections, and a
careful examination of the impact of the decision to promote nuclear reactor and central station
construction on the development of alternatives.
This paper fills those gaps by analyzing these two major challenges of nuclear reactor
construction -- cost escalation and crowding out alternatives -- with new data in multiple analytic
approaches.
Type of Analysis Data:
Cost Escalation Crowding Out Alternatives
Cross national comparisons U.S. and France Western European nations (& U.S.)
Qualitative Examination U.S. & French history Individual U.S. utility examples
Statistical analysis Econometric production Correlation analysis of 10 variables
function
FINDINGS: COST ESCALATION
The report finds that the claim that standardization, learning, or large increases in the
number of reactors under construction will lower costs is not supported in the data.
The increasing complexity of nuclear reactors and the site-specific nature of deployment
make standardization difficult, so cost reductions have not been achieved and are not likely
in the future. More recent, more complex technologies are more costly to construct.
Building larger reactors to achieve economies of scale causes construction times to increase,
offsetting the cost savings of larger reactors.
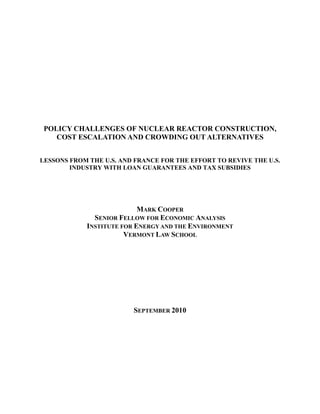
Comparing Pressurized Water Reactors, which are the main technologies used in both
nations, we find that both the U.S. and French nuclear industries experienced severe cost
escalation (see Exhibit ES-1).
Measured in 2008 dollars, U.S. and French overnight costs were similar in the early 1970s,
iii
5. about $1,000 per kW. In the U.S. they escalated to the range of $3,000 to $4,000 by the mid-
1980s. The final reactors were generally in the $5,000 to $6,000 range.
French costs increased to the range of $2,000-$3,000 in the mid-1980s and $3,000 to $5,000 in
the 1990s.
EXHIBIT ES-1: OVERNIGHT COSTS OF PRESSURIZED WATER REACTORS (2008$)
10000
9000
8000
7000
6000
2008$/kw
5000
4000
U. S.
3000 France
2000
1000
0
1970 1973 1976 1979 1982 1985 1988 1991 1994
In Service year
Source: Cooper, 2009a, database, updated; Grubler, 209.
Cost projections in both nations have proven to be unreliable, particularly so in the U.S.,
where vendors compete to convince utilities to buy their designs. In France, the state-owned
construction company builds reactors for the state-owned utility. In the U.S., as shown in Exhibit
ES-2, cost projections by vendors have been lower than those of utilities, which have been lower
than projections from independent analysts. In the past, the analysts‘ projections have been closer
to the actual costs.
FINDINGS: CROWDING OUT ALTERNATIVES
The commitment to nuclear reactors in France and the U.S appears to have crowded out
alternatives. The French track record on efficiency and renewables is extremely poor compared
to similar European nations, as is that of the U.S.
States where utilities have not expressed an interest in getting licenses for new nuclear
reactors have a better track record on efficiency and renewable and more aggressive plans for
future development of efficiency and renewables, as shown in Exhibit ES-3. These states:
had three times as much renewable energy and ten times as much non-hydro renewable
energy in their 1990 generation mix and
iv
6. EXHIBIT ES-2: INITIAL COST PROJECTIONS VASTLY UNDERESTIMATE ACTUAL COSTS
Source: Cooper, 2009, database.
EXHIBIT ES-3: TESTING THE CROWDING OUT HYPOTHESIS IN THE U.S.
Renewable Non-hydro RPS Goal Efficiency Energy ACEEE Utility
% of 1990 Renewables (%) 2010 Spend as Saved % Efficiency
Generation as % of 1990 % of 2006 of total Program
Category Means Generation Revenue’ Energy Score 92 – ’06
Central Station
Plans 2009
None 19.23 0.61 16.22 0.95 2.78 9.08
Nuke or Coal 7.48 0.02 11.26 0.46 1.13 5.21
Nuke & Coal 4.04 0.0 7.36 0.29 0.60 1.79
Nuke License: State
None 15.09 0.40 14.33 0.82 2.29 7.72
Pending 6.66 0.03 9.58 0.25 0.58 3.38
Nuke License Utility
None 0.47 2.42
Pending 0.06 0.94
Correlation (Significance)
Central station -.50 -..06 -.10 -.28 -.37 -.27
as % of Total (.002) (.696) (.477) (.012) (.0070 (.052)
1990 Generation
Central Station -.29 -.19 -.29 -.34 -.39 -.42
Plans (.039) (.178) (.037) (.016) (.051) (.002)
Nuclear License -.18 -.10 -.20 -.30 -.33 -.34
Pending State Utility (.039) (.491) (.166) (.033) (.017) (.009)
-.20 -.13
(.046) (.186)
Source: see Chapter V v
7. set RPS goals for the next decade that are 50 percent higher;
spent three times as much on efficiency in 2006;
saved over three times as much energy in the 1992-2006 period, and
have much stronger utility efficiency programs in place.
The cost and availability of alternatives play equally important roles. In both nations,
nuclear reactors are substantially more costly than the alternatives. The U.S. appears to have a
much greater opportunity to develop alternatives not only because the cost disadvantage of
nuclear in the U.S. is greater, but also because the portfolio of potential resources is much greater
in the U.S. The U.S. consumes about 50 percent more electricity per dollar of gross domestic
product per capita than France, which have the highest electricity consumption among
comparable Western European nations (see Exhibit ES-4).
EXHIBIT ES-4: ANNUAL ELECTRICITY CONSUMPTION IN WESTERN EUROPE AND THE U.S.
LU
US
BE
FR AT SZ
NL
ES DE DK
GR IT
PT
Sources and notes: World Bank per capita electricity consumption and Gross National Income.
http://data.worldbank.org/indicator/EG.USE.ELEC.KH.PC
http://data.worldbank.org/indicator/NY.GNP.PCAP.CD
The U.S. has renewable opportunities that are four times as great as Europe.
Design problems and deteriorating economic prospects have resulted in a series of setbacks
for nuclear construction plans and several utilities with large nuclear generation assets who
had contemplated building new reactors have shelved those plans because of the deteriorating
economics of nuclear power relative to the alternatives.
vi
8. POLICY IMPLICATIONS
The two challenges of nuclear reactor construction studied in this paper are linked in a
number of ways. Nuclear reactors are extremely large projects that tie up managerial and
financial resources and are affected by cost escalation, which demands even greater attention.
The reaction to cost escalation has been to pursue larger runs of larger plants in the hope that
learning and economies of scale would lower costs. In this environment, alternatives are not only
neglected, they become a threat because they may reduce the need for the larger central station
units.
The policy implications of the paper are both narrow and broad.
Narrowly, the paper shows that following the French model would be a mistake since the
French nuclear reactor program is far less of a success than is assumed, takes an organizational
approach that is alien to the U.S., and reflects a very different endowment of resources.
Broadly the paper shows that it is highly unlikely that the problems of the nuclear
industry will be solved by an infusion of federal loans guarantees and other subsidies to get the
first plants in a new building cycle completed. If the industry is relaunched with massive
subsidies, this analysis shows the greatest danger is not that the U.S. will import French
technology, but that it will replicate the French model of nuclear socialism, since it is very likely
that nuclear power will remain a ward of the state, as has been true throughout its history in
France, a great burden on ratepayers, as has been the case throughout its history in the U.S., and
it will retard the development of lower cost alternatives, as it has done in both the U.S. and
France.
vii
9. I. DRAWING INSIGHTS FROM THE HISTORICAL AND CROSS-NATIONAL
EXPERIENCE OF THE NUCLEAR INDUSTRY
RESEARCH ISSUES ARISING FROM THE DEBATE OVER NUCLEAR REACTOR CONSTRUCTION
The history of the dramatic escalation of the construction cost of nuclear reactors in the
U.S. has been well documented and the causes hotly debated. On average, the reactors
completed in the U.S. cost about twice as much as their initial projections and the final reactors
built during the ―Great Bandwagon Market‖1of the 1970s cost seven times as much as the initial
reactors.2 Proponents of nuclear power blame a large part of the cost escalation on public
opposition to reactor construction and claim that the next generation of reactors will not suffer
the cost overruns experienced by the last,3 in part because public opposition has declined. They
frequently point to the success of the French as proof that cost escalation can be controlled.4 The
fact that the French nuclear giant EDF has purchased a large stake in a major U.S. electric utility
– Constellation Energy – and is seeking a license to build a new reactor at Calvert Cliffs
Maryland has heightened interest in the French approach. Ironically, this interest comes a time
when the severe difficulties that the French nuclear industry is having in building its new
generation of nuclear reactors in France and Finland and in securing competitively bid contracts
elsewhere is receiving a great deal of attention in the U.S. media.5
Given the current economics of nuclear reactor construction in both the U.S. and France,
advocating for an expansion of nuclear power involves government involvement and subsidies.6
Two questions arise. First, will large subsidies be a permanent part of a commitment to build
large numbers of nuclear reactors? Second, how will a major commitment to nuclear reactor
construction impact the prospects for development of alternatives? While concerns about climate
change lead some to argue we must do everything to address the problem, the most aggressive
advocates of nuclear reactor construction see the commitment to nuclear construction as
competing with alternatives.7
Missing from the current scene is information about the history and recent experience of
French nuclear costs, detailed analyses of past U.S. costs or current cost projections and a careful
examination of the impact of the decision to promote nuclear reactor construction on the
development of alternatives.
A clear understanding of what works and does not work in the U.S. and France and how
major commitments to one technology affect others can shed important light on the prospects for
construction of new nuclear reactors and alternatives.
1
Bupp and Derian, 1978.
2
EIA, 1986.
3
An early and thorough explanation of the underlying problems can be found in Bupp and Derian, 1978. Recent example of the extremely
optimistic view can be found in MIT, 2003; University of Chicago 2004.
4
Alexander, 2009
5
In a two week period spanning the end of July and the beginning of August, a number of issues were reported on in major U.S. print media
outlets including: Safety (New York Times; Brett, 2010), French industry structure (Time, Levin, 2010, Wall Street Journal, 2010);
company (EDF) financial status (New York Times, Saltmarsh, 2010; Bloomberg, Patel), project viability (Baltimore Sun, Cho, 2010,
Dow Jones, Peters, 2010);. Roussely, 2010, presents a critique of the French export efforts.
6
Recent analyses by objective third parties make this clear. On France see Roussely, 2010. On the U.S. see Standard and Poor‘s, 2010.
7
Alexander, 2010.
1
10. ANALYTIC APPROACH
This paper combines a new analysis of a detailed data set on the U.S. cost experience
with recently published cost data on the French experience8 and compares that history to current
cost projections.9 The historical accounts suggest that crowding out existed in the past, so
contemporary and statistical data is marshaled to examine the crowding out issue more fully.10
Thus, this paper fills the knowledge gaps affecting two major challenges of nuclear reactor
construction -- cost escalation and the crowding out alternatives – by examining new data in
multiple analytic approaches.
To put the issues in traditional research terms, the public policy claims in the
contemporary debate can be transformed into research hypothesis as follows:
Hr1= Nuclear construction costs decline over time as a result of learning,
standardization, and increasing economies of scale
Hr2= Nuclear reactor construction does not crowds out alternatives.
These hypotheses are examined at several levels.
Type of Analysis Cost Escalation Crowding Out Alternatives
Cross national comparisons U.S. and France Western European nations (& U.S.)
Qualitative Examination U.S. & French history Individual U.S. utility examples
Statistical analysis Econometric production Correlation analysis of 10 variables
Function
FINDINGS AND IMPLICATIONS
The paper shows that the intensity of the debate over nuclear reactor construction is well
justified. It finds that the cost escalation problem is endemic to nuclear technology. The inherent
problems in nuclear reactor design and construction mean that the reduction in cost that nuclear
advocates hope would result from ―learning-by-doing‖ or increasing scale has not materialized in
the past and is not likely to happen in the future. The historical and quantitative evidence
supports the conclusion that commitments to nuclear reactors and central station facilities crowd
out the alternatives.
Moreover, the paper shows that the two challenges of nuclear reactor construction studied
in this paper are linked in a number of ways. Nuclear reactors are extremely large projects that
tie up managerial and financial resources and cost escalation demands even greater attention.
The reaction to cost escalation has been to pursue larger runs of larger plants in the hope that
learning and economies of scale would lower costs. In this environment, alternatives are not only
8
Grubler, 2009, presents the quantitative cost analysis. Schneider, 2008, has discussed the industry from a qualitative perspective.
9
Cooper, 2009a, presents a compilation of recent cost projections. The U.S. database is derived from Koomey and Hultman, 2007. The database
used in this analysis has been updated to include half a dozen recent projections. Because long-term comparisons are being made, this
analysis uses the producer price index for capital goods as a deflator, instead of the consumer price index.
10
Qualitative cross national comparisons have been made of European nations (e.g. Froggatt and Schneider, 2010) and univariate analyses of
performance on alternative technologies have been offered for both Europe (see Geller, et al., 2006; Olz, 2007; Suding, 2007. Olz,
2007; Ragwitz and Held, 2007) and the U.S. (see Chicetti, 2009 and ACEEE, 2009). This paper quantifies the measures and offers
bivariate analysis that relates reliance on central station generation to the development of alternatives.
2
11. neglected, they become a threat because they may reduce the need for the larger central station
units.
These finding have major implications for the ongoing debate over building new nuclear
reactors in the U.S. At present, the cost of constructing new reactors is projected to result in a
cost of electricity that is substantially higher than the alternatives, so high in fact that utilities
cannot raise capital on Wall Street to fund these projects at a normal cost of capital.11 To fill the
gap, the nuclear industry is seeking subsidies from federal taxpayers, in the form of loan
guarantees and tax credits, and from ratepayers, in the form of construction work in progress and
guaranteed recovery of costs, while they hold out the hope/promise that costs will come down.12
The empirical evidence reviewed in this paper suggests that the hope/promise is unlikely to be
fulfilled. Nuclear construction costs will remain high and a large-scale building program will
require continuous subsidies from taxpayers and ratepayers. Moreover, because the costs and
demands for subsidies are so high, the crowding out effect is likely to be strong, as scarce
financial resources are devoted to the high cost projects.
OUTLINE
The paper is organized as follows:
Section II discusses the cost trends in the U.S. and France, as well as the record of cost
projection in the two nations. The cost experience was a major topic of public discussion in the
1980s in the U.S., as cost overruns created rate shock for consumers, which was a major
contributor to the abandonment of about half of U.S. reactors that had been ordered to be
abandoned or cancelled.13 The cost experience in France was shrouded in the secrecy of a state-
owned monopoly company, but has recently been examined in a study by Grubler. The
problems that the French industry is having building the current generation of reactors has
become front page news. Comparing the historical experiences of the two nations with detailed
data and reviewing the current pattern of escalating cost projections provides important insights
into the pattern of cost escalation in the industry. Section II concludes with an explanation for the
trends in terms of general economic processes.
Section III examines the characteristics of nuclear reactors that account for the overall
trend of cost escalation using a series of bivariate analyses for both France and the U.S. The
French data is extracted from published graphs and tables, but access to the underlying data was
not provided, so the comparison between the two nations is limited to this bivariate approach.
However, section III concludes with a detailed, multivariate econometric model to assess which
factors are the most important in the U.S. The multivariate regression model for the U.S. enables
us to analyze the causes of cost escalation with greater precision and it confirms the findings of
the bivariate analysis.
11
Cooper, 2009b reviews the current financial challenges facing nuclear reactor construction and identifies key Wall Street analyzes that
elaborate on this issue including Moody‘s, 2008, 2009, Kee (NERA), 2009, Maloney (Towers Perrin), 2008, 2009, and Atherton
(CITI), 2009.
12
For example, the original MIT (2003) study started with a low overnight cost ($2,000/kW) and considered only lower costs. The update (MIT,
2009) used costs of $4,000/kW, which are still well below the costs projected by most other analysts.
13
Cook, 1986; Komanoff, 1992.
3
12. Section IV presents qualitative and quantitative evidence on the tendency for nuclear
reactors and central station facilities to crowd out alternative like efficiency and renewables. It
shows that the cost of these alternatives is lower than nuclear reactor construction in both the
U.S. and France and cites evidence that there are more opportunities to pursue these alternatives
in the U.S.
Section V reviews the discrepancies in the U.S. between cost projections and cost
performance from different sources. It offers observations on the contemporary experience in
the startup of the U.S. ―nuclear renaissance‖ and closes with some conclusions for policymakers
on the implications of the cost escalation and crowding out of nuclear reactor construction.
4
13. II. NUCLEAR REACTOR COST ESCALATION
COST TRENDS
As shown in Exhibit II-1, the nuclear construction programs in both the U.S. and France
exhibited a continuous escalation of costs from the outset. The estimated overnight costs cost
numbers from the published French figures and U.S. data are shown in 2008 dollars and placed
on two separate graphs.14
The French data looks smoother than the U.S. data because the cost estimates are year-
by-year costs for all reactors put under construction in a given year.15 Even if specific reactor
costs were used, the French cost curve is likely to be smoother, because there was a single
monopoly company in France in contrast to over a dozen companies in the U.S. In France, at
present, one reactor is under construction. In the U.S., one reactor is under construction, but
there have been a flurry of cost estimates since 2001. The current French project and the U.S.
cost projections will be discussed below.
In France, from the low-cost point in the mid-1970s to the high-cost point in early 1990s,
costs for new reactors have more than tripled. The cost escalation came in three spurts, from the
mid-1970s to the end of the 1970s, from the mid-1980s to the end of the 1980s, and in the
beginning of the 1990s.16 French costs increased from a low of just under $1,000/kW to
$1,500/kW by the end of the 1970s. The costs escalated to $2,000/kW by the end of the 1980s
and $3,000/kW in the 1990s. The projected cost for the reactor currently under construction is in
the range of $4,500 to $5,000/kW.
The U.S. cost increase was similar to the French in the first decade, from about
$1,000/kW to $2,000/kW, with the average cost for the decade of about $1,250/kW. Cost
escalation was faster in the U.S in the second decade, with the French going from $2,000/kW to
$3,000/kW while the U.S. costs increased to an average of $3,600/kW, with a number of units
much higher. As we shall see below, the current projected costs of reactors in the U.S. are
literally all over the map, with the 2008-2009 cost estimates clustering in the $4,000 to
$6,000/kW range, with estimates going as high as $10,000/kW.
14
Wikipedia defines overnight costs as follows: ―Overnight cost is the cost of a construction project if no interest was incurred during
construction, as if the project was completed "overnight." An alternate definition is: the present value cost that would have to be paid
as a lump sum up front to completely pay for a construction project.‖ http://en.wikipedia.org/wiki/Overnight_cost
15
Grubler, 2009. Two papers have been published based on the data (Komanoff, 2010), is the second). One presents the original range of
estimates per year. The other presents point estimates for each year.
16
Grubler, pp. 25-26, One French reference (though discussions of cost are extremely rare in this period) put the escalation of real investment per
kW at 50% or 4.4%/year during 1974-1984 (as reported by Crowley and Kaminski, 1985). ―Yet these trends did not cause alarm, as
other countries were suffering even worse escalation—as in Germany and especially the US, with 10-15% real cost escalation per year.
Between 1974 and 1984, specific real investment costs increased from some 4,200 to 7,000 FF98/kW (gross capacity), or by some 5%
per annum. Between 1984 and 1990, costs escalated from some 7,000 to 10,000 FF98/kW, or by some 6% per annum. For the last reactors,
the ―entirely French design‖ N4 series, the inferred construction costs are about another 45 percent higher (14,500 FF98/kW ―best
guess‖ model estimate). …We conclude, therefore, that the last N4 PWR reactors built were some 3.5 times more expensive, in
constant Francs per kW, than the early 900-MW units that started the French PWR program.‖
5
14. EXHIBIT II-1: FRENCH AND U.S. NUCLEAR REACTOR OVERNIGHT COSTS (2008$)
Grubler, 2009, Figure 8; Komanoff, 2010, Figure 1.
United States - All Reactors
10000
9000
8000
7000
2008$/kW
6000
5000
4000
3000
2000
1000
0
1970 1975 1980 1985 1990 1995
Year of Operation or Estimate
Cooper, 2009a, database updated
6
15. Exhibit II-2 begins to explain some of the differences between the French and U.S.
experiences. It shows the U.S. costs for pressurized water reactors (PWR) and suggests that part
of the large difference in cost escalation between the two countries can be explained by the
homogeneity of technology in France. About two-thirds of the U.S. reactors used PWR
technology, while all the French reactors used this technology (in fact the French PWR industry
was launched with a licensed U.S. design, American Pressurized Water Reactor). The French
tried to ―Frenchify‖ this design over time and Grubler attributes the worst of the cost escalation
to this endeavor. However, it remained basically a PWR design. The PWR technology was the
dominant technology in the U.S. as well. There are 69 pressurized water reactors in the U. S.
database, compared to the 54 in the French database.
EXHIBIT II-2: OVERNIGHT COSTS OF PRESSURIZED WATER REACTORS (2008$)
10000
9000
8000
7000
6000
2008$/kw
5000
4000 France
3000 U. S.
2000
1000
0
1970 1973 1976 1979 1982 1985 1988 1991 1994
In Service year
Source: Cooper, 2009a, database, updated; Grubler, 209.
The cost escalation trends in the two countries are closer when a single technology is
examined. As noted above, by the end of the 1980s, French reactors were consistently in the
range of $2,000/kW to $3,000/kW. In the U.S., costs for PWRs increased from $1,200/kW in
the 1970s to $3,100/kW in the 1980s. Three-quarters of the U.S. PWR reactors cost less than
$3,000/kW. Most of the reactors in the U.S. were in the $4,000/kW to $6,000/kW range by the
1980s. Thus, the U.S. PWRs were closer in cost to the French PWRs than the BWR reactors.
Virtually all of the currently proposed reactors in the U.S. for which there are site-specific
projections are PWRs of one form or another. All of the generic costs estimates in recent years
have been for PWR technologies. Therefore, the remainder of the side-by-side analyses in this
section will focus on the PWR subset. We control for technology in the econometric analysis by
including a technology variable in the overall regression and performing regressions in the subset
of PWRs only.
7
16. Exhibit II-2 suggests a second factor that should be incorporated into the analysis. Cost
escalation was greater for the reactors built later. The TMI accident occurred in 1979 and caused
a probing review of safety, which increased the construction period of the reactors that had not
been completed. To account for this and ensure that the analysis of the causes of cost escalation
does not confuse the effects of TMI with other factors, we incorporate TMI into the analysis in
two ways that are similar to the manner in which we handle technology. We include it as a
control variable in the analysis of the full data set and we conduct the analysis separately in
subsets of the reactors completed.
COST PROJECTIONS
The Historical Experience
In an industry that was undergoing rapid cost escalation, we should not be surprised to
find that cost projection was a problem, particularly in the U.S. where reactors had to be
―marketed‖ to individual utilities. From the beginning of the industry in the U.S., cost
projections have crept up slowly, while the actual cost of construction skyrocketed. The timing
of the problem was different in France, but the underlying cause was the same.
Exhibit II-3 shows Grubler‘s comparison of cost projections and actual costs in France.
The solid circles in the Exhibit reflect the actual costs. The solid squares reflect the projected
costs. Beginning in the mid-1980s the actual costs began to exceed the projected costs. The
projections adjusted, but never caught up.
EXHIBIT II-3: FRENCH COST PROJECTIONS
Underestimation of costs
Grubler, Figure 11
8
17. Grubler sees a certain strategic motivation behind the underestimation of costs, even in
the French system, where the reactors were being deployed subject to a central plan, rather than
being ―marketed‖ to individual utilities.
The projections also bear witness to the economic expectations of the actors.
Declining trends indicate the cost-reducing expectations (though never realized)
of upscaling to the 1300-MW reactor series, and also, by the mid-1980s, the
unfounded hopes of cost savings from the N4 reactor design [the final design in
the building cycle that ended in the 1990s]. It is particularly noteworthy that while
cost projections in the 1970s and 1980s reflected cost escalation trends well from
actual experience (albeit with a delay), they no longer did so in the 1990s, when
the substantial cost overruns and difficulties of the N4 reactor design must have
been apparent to all insiders, yet were not visible in the cost projections.
Apparently, the projections no longer served their original purpose—to
communicate the benefits of the nuclear program within France‘s technocratic
elite—but were rather instrumentalized—so as not to add insult to injury—to
communicate an economic success story whilst distracting from the difficulties
encountered with the problem N4 reactors. Ever since, the cost projections have
further lost their credibility and usefulness in public discourse and decision-
making.17
This characterization of cost projections suggests a mix of motivations, genuine
uncertainty, and also manipulation of cost data for political reasons. Other analysts have come to
a similar conclusion in the U.S. (that cost estimates were politicized) for both the nuclear
construction boom of the 1970s and the recent round of cost projections offered by nuclear
advocates.18
At the beginning of 1970, none of the plants ordered during the Great Bandwagon
Market was yet operating in the United States.
This meant that virtually all of the economic information about the status of light
water reactors in the early 1970s was based upon expectation rather than actual
experience. The distinction between cost records and cost estimation may seem
obvious, but apparently it eluded many in government and industry for years…
In the first half of this crucial 10-year period, the buyers of nuclear power plants
had to accept, more or less on faith, the seller‘s claims about the economic
performance of their product. Meanwhile, each additional buyer was cited by the
reactor manufacturers as proof of the soundness of their product…The rush to
nuclear power had become a self-sustaining process...
There were few, if any, credible challenges to this natural conclusion. Indeed,
quite the contrary. Government officials regularly cited the nuclear industry‘s
analyses of light water plants as proof of the success of their own research and
development policies. The industry, in turn, cited those same government
statements as official confirmation. The result was a circular flow of mutually
17
Grubler, p. 30.
18
Cooper, 2009a, Chapter IV.
9
18. reinforcing assertion that apparently intoxicated both parties and inhibited normal
commercial skepticism about advertisements which purported to be analyses. As
intoxication with promises about light water reactors grew during the late 1960s
and cross-national and even ideological boundaries, the distinction between
promotional prospectus and critical evaluation become progressively more
obscure.
From the available cost records about changing light water reactor capital costs, it
is possible to show that on average, plants that entered operation in 1975 were
about three times more costly in constant dollars than the early commercial plants
competed five years earlier.19
As shown in Exhibit II-4, U.S. cost projection was farther off the mark sooner than the
French. This reflected both that vendors were trying to convince utilities to buy their products
(creating a tendency to low-ball cost projections) and that costs were escalating more rapidly in
the U.S. Thus, the gap between hype and reality was larger and grew faster.
EXHIBIT II-4: U.S. UNDERESTIMATION OF COST
Cooper, 2009, based on EIA, 1986.
The Contemporary Experience
The construction of nuclear reactors in the U.S. ended in the mid-1990s. Over 90 percent
19
Bupp and Derian, 1978, pp.71… 72…74…75…76…78…79.
10
19. of the reactors in France were also completed by that time. Construction of one new reactor
commenced in France in 2007. Interestingly, one of the most prominent indices of the cost of
construction of central station generation facilities – the IHS-CERA index – tells a story about
cost escalation in recent years that is remarkably similar to the historical experience, as shown in
ExhibitII-5.
Since 2000, the IHS-CERA Power Capital Cost Index, which is used to indicate changes
in the cost of power plant construction that includes nuclear reactors, has escalated much more
rapidly than the index without nuclear in both the U.S. and Europe. However, the disparity is
much greater in the U.S., where nuclear cost estimates have increased by 113 percent, compared
to 77 percent in Europe. Grubler gives an estimate for France and described it as follows:
Using the N4 [the final design in the building cycle that ended in the 1990s] costs as
a precursor model of the subsequent EPR design, one might speculate on updating
its costs to current conditions. Converting the N4 14,700 FF98/kW into 2007 money
and considering a cost escalation factor of 1.5 based on the Handy-Whitman
(Whitman, Requard & Assocs, 2008) construction cost index (which has reflected
French cost escalation well over the period 1975-1990) yields a conservative
estimate of at least 3,000 Euro (2007) or 4,500 US$2007 per kW under current
conditions for a N4/EPR design reactor under favorable (French) construction
conditions. This lower-bound estimate is still higher than the recent MIT update
(Deutch et al., 2009) of nuclear construction costs of some 4,000 US$/kW,
suggesting that the MIT estimates are once again optimistic… In the meantime,
climate policy analysts may well be advised to consider nuclear construction costs
to the tune of 5,000 US$/kW (i.e. a number close to solar PVs) in scenarios and
sensitivity analyses. Even this may prove conservative, since some utility and
financial-analyst estimates of nuclear construction cost published in the US in
2008 approach 8000$/kW (US$ 2007 including interest during construction).20
Grubler‘s estimate of $5,000/kW (US$2007) for the current French EPR projects is close
to the estimates U.S. utilities are using for non-French technologies. As shown in Exhibit II-6,
this is still considerably below the estimates of the costs in the U.S. for the French EPR
technology, which are in the range of $6,000/kW21 to $7,500/kW.22 Given the cost projection
track record of the industry and its actual construction record in both countries, even these
estimates are likely to be far too low.
20
Grubler, p. 26.
21
The current estimate for the proposed 1,600 MW EPR reactor at the Calvert Cliffs site in Maryland is at $7 to $10 billion, which does not
include financing costs, Buurma, 2010.
22
The current estimate for the proposed 1,600 MW EPR reactor at the Bell Bend site in Pennsylvania is at $13-15 billion, which includes
financing costs, PPL, 2009.
11
21. EXHIBIT II-6: PRESSURIZED WATER REACTORS IN U.S.: ACTUAL OVERNIGHT COST
COMPARED TO RECENT PROJECTION OF FUTURE OVERNIGHT COSTS
11000
10000
Overnight Costs (2008$/KW)
9000
8000
7000
6000
5000
4000
3000
2000
1000
0
Year of Operation/Projection
Operating Plants New Reactor Cost Estimates Linear (Operating Plants)
Sources: Koomey and Hultman, 2007, Data Appendix; University of Chicago 2004, p. S-2, p. S-8; University
of Chicago estimate, MIT,2003, p. 42; Tennessee Valley Authority, 2005, p. I-7; Klein, p. 14; Keystone Center,
2007, p.42; Kaplan, 2008 Appendix B for utility estimates, p. 39; Harding, 2007, p. 71; Lovins and Sheikh,
2008b, p. 2; Congressional Budget Office, 2008, p. 13; Lazard, 2008, p. 2; Lazard, 2009, p. 2; Moody’s, 2008,
p. 15; Standard &Poor’s, 2008, p. 11; Severance, 2009, pp. 35-36; Schlissel and Biewald, 2008, p. 2; Energy
Information Administration, 2009, p. 89; Harding, 2009; PPL, 2009; Deutch, et al., 2009, p. 6. See
Bibliography for full citations.
THE PERSISTENT PATTERN OF DESIGN FLAWS, DELAY, COST ESCALATION, AND FINANCIAL
DIFFICULTIES
A decade and half after the start of the commercial deployment of nuclear reactors in the
U.S. and France, and well before the accident at Three Mile Island in the U.S., two individuals
who had been close observers of nuclear technology in both countries offered an insightful
explanation of the economic forces underlying the cost escalation problem. These authors,
Bupp and Derian, locate the problem as early as the late 1960s, when it had already become
apparent that the cost reduction the industry hoped would flow from learning processes had not
come to pass.
13
22. By the end of the 1960s, there was considerable evidence that the 1964-1965 cost
estimates for light water plants had been very optimistic. The manufacturers
themselves were prepared to admit this. But at the same time they contended that
the causes of the first cost overruns were fully understood and were being dealt
with. They were entirely confident that the combination of ―learning effects‖ and
engineering improvements in key reactor performance parameters (e.g. fuel life)
could be relied upon to compensate for the unexpectedly high costs they were
encountering. Economies of scale were also seen as a powerful tool for lowering
the cost of electricity from nuclear power plants…
Costs normally stabilize and often begin to decline fairly soon after a product‘s
introduction… the reactor manufacturers repeatedly assured their customers that
this kind of cost stabilization was bound to occur with nuclear power plants. But
cost stabilization did not occur with light water reactors… The learning that
usually lowers initial costs has not generally occurred in the nuclear power
business. Contrary to the industry‘s own oft-repeated claim that reactor costs were
―soon going to stabilize‖ and that ―learning by doing‖ would produce cost
decreases, just the opposite happened. Even more important, cost estimates did
not become more accurate with time.23
Writing over three decades later, Grubler concludes that this analysis applies equally to
the French situation, but takes it one step further. Faced with the failure of cost control and the
prospect of cost escalation, the industry attempted to solve the problem by shifting designs and
increasing scale. The result is a ―negative learning‖ process. Things not only do not get better,
they get worse. A negative learning process occurs when the enterprise encounters problems
with one technology at one scale, but ignores the obvious lessons and assumes that shifting to
another technology and larger scale will solve the problem. This short circuits potential gains
from standardization and reintroduces learning and first-of-a kind costs.24 The cycle of cost
escalation is repeated.
The French nuclear case has also demonstrated the limits of the learning
paradigm: the assumption that costs invariably decrease with accumulated
technology deployment. The French example serves as a useful reminder of the
limits of the generalizability of simplistic learning/experience curve models. Not
only do nuclear reactors across all countries with significant programs invariably
exhibit negative learning, i.e., cost increase rather than decline, but the pattern is
also quite variable, defying approximations by simple learning-curve models…
In symmetry to the often evoked "learning-by-doing" phenomenon, there appears
not only to be ―forgetting by not doing‖ (Rosegger, 1991) but also “forgetting by
doing,” suggesting that technology learning possibilities are not only structured
23
Bupp and Derian, 1978, pp. 72…79.
24
As Grubler, p. 27, put it in the French case: ―This cost escalation is far above what would be expected just from longer construction times." The
reasons for this cost escalation await further detailed research, but have been already alluded to above: loss of the cost-dampening
effects from standardization, partly due to upscaling to 1300 MW, but especially in the ―frenchifying‖ of the tested Westinghouse
design (as evidenced in the differences between the P4 and the N4 reactor series); a certain ―stretching‖ in the construction schedules
after 1981 to maintain human and industrial knowledge capital during the significant scale-back of the expansion program as a result
of built overcapacity; and above all, the unsuccessful attempt to introduce a radically new, entirely French design towards the end of
the program that did not allow any learning spillovers in design or construction.‖
14
23. by the actors and institutional settings involved, but are also fundamental
characteristics of technologies themselves.
In the case of nuclear, a theoretical framework explaining this negative learning
was discussed by Lovins (1986:17-21) who referred to the underlying model as
Bupp-Derian-Komanoff-Taylor hypothesis. In essence, the model suggests that
with increasing application ("doing"), the complexity of the technology inevitably
increases leading to inherent cost escalation trends that limit or reverse "learning"
(cost reduction) possibilities. In other words, technology scale-up can lead to an
inevitable increase in systems complexity (in the case of nuclear, full fuel cycle
management, load-following operation mode, and increasing safety standards as
operation experience [and unanticipated problems] are accumulating) that
translates into real-cost escalation, or "negative learning" in the terminology of
learning/experience curve models.25
An analysis of the historical experience identifies specific characteristics of nuclear
reactor construction that cause these endemic problems. Nuclear reactors are mega-projects that
suffer inherent cost escalation.26 In extremely large, complex projects that are dependent on
sequential and complementary activities, delays tend to cascade into long-term interruptions.
There are also specific characteristics of the technology and the construction process that pose
endemic problems for nuclear reactor development and construction and make them prone to
these problems: reactor design is complex and site-specific, which makes them difficult to
standardize. The complexity makes it difficult to scale up from smaller-scale demonstrations.
The U.S. experience was described as follows in 1978:
After more than a decade of experience with large light water nuclear power
plants, important engineering and design changes were still being made. This is
contrary to experience with other complex industrial products…
For 15 years many of those most closely identified with reactor
commercialization have stubbornly refused to face up to the sheer technical
complexity of the job that remained after the first prototype nuclear plants had
been built in the mid-late 1950s. Both industry and government refused to
recognize that construction and successful operation of these prototypes – though
it represented a very considerable technical achievement – was the beginning and
not the near completion of a demanding undertaking… It became painfully
evident that the problems associated with building and operating 1,000 to 1,200
MW nuclear plants bore disappointingly slight resemblance to those associated
with 100 to 200 MW plants.27
The French had the same experience, as suggested by Grubler:
First, while the nuclear industry is often quick to point at public opposition and
regulatory uncertainty as reasons for real cost escalation, it may be more productive
to start asking whether these trends are not intrinsic to the very nature of the
25
Grubler, p. 34.
26
Flybierg, Bruzelius and Rothengatter, 2003; Merrow, Phillips and Myers, 1981.
27
Bupp and Derian, pp. 154…155…156.
15
24. technology itself: large-scale, indivisible (lumpy), and requiring a formidable
ability to manage complexity in both construction and operation. These intrinsic
characteristics of the technology limit essentially all classical mechanisms of cost
improvements—standardization, large series, and a large number of quasi-
identical experiences that can lead to technological learning and ultimate cost
reductions—except one: increases in unit size, i.e., economies of scale. In the history
of steam electricity generation, these indeed led initially to substantial cost
reductions, but after the late 1960s that option has failed invariably due to the
corresponding increases in technological complexity.28
Another aspect of the negative learning process entails excess capacity. The hope that
learning and scale economies will bring costs down requires the industry to commit to large runs
of large reactor construction, but the size of the projects and their cost leads to problems and
threats of excess capacity. The solution to the rising cost of units creates a new systemic problem
of excess capacity.
With the previous nuclear expansions completed, construction of the last
remaining… reactors was ―stretched out,‖ and doubts started to creep in. First was
the disappointing experience on the construction sites of the four N4 reactors—
especially the two Chooz units that took 12 years between construction start and
first criticality, plus another 3-4 years until commercial operation (IAEA, PRIS,
2009). Design flaws also took sudden center-stage in the media (e.g.,
MacLachlan, 1991). A design flaw co-located hot and cold pipes in the primary
circuit, leading to enormous thermal stresses and a spectacular leak in 1998 and
thus requiring redesign. Digitizing the control system also turned out to be a veritable
N4 nightmare, among other problems.
The French nuclear industry needed to consolidate whilst maintaining its ambition
for technological innovation, in particular to develop a successor to the N4
reactor—the European Pressurized Water Reactor, EPR.29
The endemic problems that afflict nuclear reactors take on particular importance in an
industry in which the supply chain is stretched thin.30 These one-of-a-kind, specialized products
have few suppliers. In some cases, there is only one potential supplier for critical parts. Any
interruption or delay in delivery cannot be easily accommodated and ripples through the supply
chain and the implementation of the project. Any increase in demand or disruption in supply
sends prices skyrocketing.
CONCLUSION
Understanding the institutional context is particularly important when using cross-
national comparisons to inform decision-making. Blindly applying conclusions about the French
industry to the U.S. industry, either positively or negatively, can be misleading. While both
nations have capitalist economies, the French nuclear program is a majority state-owned
28
Grubler, p. 32.
29
Grubler, p. 13.
30
Harding, 2007, Keystone2007.
16
25. monopoly, while the U.S. program is made up of privately owned companies, some regulated,
some not regulated. It is only by rigorous, side-by-side analysis of the nuclear programs in both
countries that one can have confidence in drawing conclusions about similarities and differences
between the two or take lessons about the performance of the industry in either nation.
In pointing to the French as a role model for the U.S., it is important to note key
difficulties that the unique French model encountered. The ‗success‘ of the French industry was
based on an imported design and though they wanted to develop a homegrown design, they were
not successful economically.31The shift to larger scale and ―frenchified‖ technology proved
problematic. The more ―frenchified‖ the design became, the more technical difficulties and the
higher the cost that were encountered.32 The EPR, which is the reactor that the French industry
is struggling with in Finland and Flamanville, as well as the one several utilities in the U.S. have
considered deploying, lies in this line of development.33
In summary, the French success, such as it was, lasted less than a decade and a half, never
achieved the hoped-for dynamic economies, encountered mounting problems as it tried to scale up
and become independent, resulted in large excess capacity, distorted energy policy, and has failed to
achieve success in either captive or non-captive markets with the contemporary large, homegrown
technology.
31
―As it turned out later, the decision to develop and build the N4 reactor was the most problematic of the entire French PWR program: the new
reactor faced numerous technical difficulties, substantial delays, and by French standards prohibitive costs overruns. Not a single N4
reactor was exported. All in all, France exported 9 reactors to 4 countries— all of the original 900-MW first-generation Westinghouse
license type‖ (Grubler, 2009, p. 11). A small number of EPR reactors have been sold abroad.
32
―Conversely, the gradual erosion of ÉDF's determination to standardize (caving in to proposals of numerous design changes in the wake of the
"frenchifying" of the Westinghouse design, and above all to the new N4 reactor design pushed by the CEA), as well as the abrupt
slowdown of the expansion program after 1981, paved the way towards a gradual demise of the French success model, as borne out in
lengthened construction times and ever higher cost escalation towards the end of the program‖ (Grubler, 2009, p. 17).
33
―When the first EPR, the AREVA/Siemens Olkiluoto-3 project, went at least three years behind schedule and 50% over budget, AREVA could
and did blame this on its foreign partners, but no such explanation was plausible for the identical Flamanville-3 EPR built by and for
French institutions in France. When after a year‘s construction the project was a year late and 20% over budget, doubts arose about
whether AREVA‘s last order before Olkiluoto-3, in 1992, was so long ago that critical design and construction skills may have
atrophied.‖ (Grubler, 2009, p. 14)
17
26. III. A COMPARISON OF COST ESCALATION IN THE U.S. AND FRANCE
This section examines the cost escalation of U.S. nuclear reactor construction using a
database on 100 reactors, which includes almost all the reactors built after a small number of
initial, turnkey reactors. This section addresses both the pattern of cost escalation and the
economic processes that the industry hoped would lead to declining costs. It is based on a series
of side-by-side comparisons of bivariate relationships in France and the U.S. and then presents a
multivariate regression model for the U.S in order to provide more precise insight into the
dynamics of cost escalation.
INCREASING LENGTH OF CONSTRUCTION PERIOD
The primary driver of costs in both the U.S and France was the increasing length of
construction period.34 Capital costs mount and compound in the early construction period as they
linger on the books before the reactor is used and useful and can be depreciated. The key to cost
reduction would have been to reduce the length of time it took to construct new reactors. The
experience in both countries was the opposite – i.e. construction periods in both countries
increased substantially over time (see Exhibit III-1). The French construction periods were
relatively stable at between five and six years in the period between 1970 and 1985 and then
doubled in the second half of the 1980s, for the reasons discussed in Chapter II, including a shift
in design, the scaling up of the reactors, and the need to stretch out projects as excess capacity
became apparent.
In the U.S., construction periods consistently increased from the 1970s to the 1990s.
Exhibit III-1 identifies reactors completed before 1980 and those completed after. The first few
reactors took about the same amount of time as the French and then there was a steady three-fold
increase. The later reactors had a higher rate of construction period increase in the U.S., but the
problem clearly existed prior to the TMI accident.35The U.S. and French data strongly indicates
that TMI was not the sole cause of the problem.
As noted above, the cost escalation problems persist for the French, who have two
reactors under construction in the West France and in Finland. Three French EPRs have been
proposed in the U.S., and their cost projections have been increasing rapidly. Grubler notes the
estimate of the construction period for the Flamanville-3 reactor now under construction in
France was extremely optimistic.36 The reactor is now experiencing substantial delays.37 The
Olkiluoto reactor, with the same design as the Flamanville reactor in Finland is also experiencing
significant delays.38
34
Bupp and Dernier, 1978, Mooz, 1979; and Komanoff, 1981.
35
Bupp and Dernier, 1978, Mooz, 1978, 1979, Komanoff, 1981, all relied on cost data that antedate TMI. Faber, 1991, showed that the negative
impact of nuclear reactor construction on utility financial situation also antedated TMI. (see also Hearth, Melicher and Gurley, 1990)
36
Grubler, 2009, p. 14.
37
Thomas, 2010, pp. 30-31.
38
Thomas, 2010, pp. 28-30.
18
27. EXHIBIT III-1: CONSTRUCTION PERIODS, PRESSURIZED WATER REACTORS
FRANCE
Grubler, 2009, Figure 3
U.S.
Cooper, 2009, database.
19
28. The projected construction periods for the new reactors proposed in the U.S. are also
optimistic. The original projections made by advocates of nuclear reactors and the utilities
proposing them are in the four to six year range, with an occasional estimate as low as 3.5 years
and as high as 7 years.39 These seem as optimistic as the French projections, relative to the
experience in each of the countries. Moody’s used a ten year construction spend model,40 with
most of the expenditures in a seven year period.
LACK OF A LEARNING CURVE
Grubler tests the hypothesis that the builder would learn and, thereby, experience
declining cost by plotting construction costs against the gross amount of reactor capacity built.
There is no downward trend, as one would expect if learning were lowering costs (see Exhibit
III-2). On the contrary, he finds a slight upward trend to 35 Gigawatts and then a sharp increase
in costs. The U.S. exhibits a similar pattern.
Since the build-up of completed reactors is correlated with the lengthening of the
construction period, this may be affecting the cost-capacity relationship. In France, all the
reactors are built by one company, so the build-up of complete reactors is both the industry and
the company experience curve. In the U.S., there are multiple companies so we should
distinguish the industry experience curve from the company curve. Exhibit III-3 does so and
finds that, for every utility and every range of experience, there was a cost escalation with
experience, rather than a reduction. However, there is a distinction between the companies.
Bechtel built a large number and had lower costs, but even for Bechtel, there was a steady,
moderate increase in costs. Two other constructors had low and moderately rising costs that
paralleled Bechtel (Duke and UE&C) 41– although they built far fewer reactors. The other
builders had much higher costs that rose faster.
INCREASING UNIT CAPACITY
Another characteristic that is playing a role in the current U.S. proposals and was also in
play in France involves the size of the reactors. The experience of rising construction costs
drove the French to seek large reactors;42 hoping unit economies of scale would offset the
upward trend. ―But as it turned out later, the expectations of significant economies of scale
proved unfounded: any cost reductions from larger components were more than offset by more
complex construction sites, longer construction times, and the need to fix the inevitable technical
problems arising from significant design changes.‖43
There has been a long-term trend to larger units and the current proposals in the U.S. and
39
Cooper, 2009a, p. xx.
40
Moody‘s, 2008.
41
Grubler suggests that utilities building reactors may overcome some principal agent problems by unifying the interest of the utility and the
builder and thereby achieve lower cost.
42
Grubler, p. 16, ―The reason for this increase in reactor unit scale was primarily economic: significant economies of scale were sought and
expected to encounter increasing tendencies for cost escalation. With the completion of the first reactors, the earlier optimistic
assumptions about construction duration and investment costs faced a harsh reality check. The first reactor completed, at Fessenheim, took
two years longer to build than originally projected, accruing additional interest during construction that further added to other cost
escalation factors. As more experience was accumulated, the cost projections of the PEON Commission, as well as the internal ones of
ÉDF, started to rise as well, adding urgency to the economic rationale for the move to the 1.3 GW PWR design.‖
43
Grubler, p. 11.
20
29. EXHIBIT III-2: FRENCH AND U.S. LEARNING CURVES: PRESSURIZED WATER REACTORS
France
Grubler, 2009, Figure 9
United States
Cooper, 2009, database
21
30. EXHIBIT III-3: U. S. COMPANY LEARNING CURVES
8000
7000
6000
5000
2008$/kw
4000
3000
2000
1000
0
0.00 5.00 10.00 15.00 20.00 25.00
Cumulative GW gross
Bechtel CWE DANI
Duke EBSO TVA
UE&C Non-Bechtel Linear (Bechtel)
Linear (Non-Bechtel)
Cooper, database, 2009
ongoing French projects are much larger than the early reactors. Since we do not have the
underlying French data, Exhibit III-4 shows this at the technology level, with the average size
plotted against the median year in which the units were under construction. For the U.S. data,
we plot the size against the construction start date. Capacity increased dramatically across time
in both cases. Since costs were rising as well, there is a correlation between size and cost, which
may be a function of the co-linearity between start date, capacity, and cost.
The economies of scale that might drive prices down are not sufficient to offset other
factors. The inherent technology characteristics of nuclear power (large-scale, complex, and
with lumpy investments) introduce a significant economic risk of cost overruns in the build-up
process. Anticipated economic gains from standardization and ever larger unit scales not only have
failed to materialize, but the corresponding increasing complexity in design and in construction
operations have reversed the anticipated learning effects to their contrary: cost escalation.44
MULTI-UNIT SITES
In the U.S., the nuclear industry is claiming that building two reactors at a given site
dramatically lowers the cost (by about 25 percent), as long as the two units are constructed
44
Grubler, p. iii.
22
31. EXHIBIT III-4: FRENCH AND U.S. REACTOR CAPACITY: PRESSURIZED WATER REACTORS
Grubler, 2009. Table
Cooper, 2009, database.
23
32. within a year or two.45 Historical data shows a clear relationship between multi-unit sites and
costs in the U.S., with second and third units costing substantially less (see Exhibit III-5).
However, this has the impact of making the reactor projects very large and raises concerns about
excess capacity, especially given the economic slowdown and dramatic change in household
wealth resulting from the financial meltdown.46
EXHIBIT III-5: COST IMPACT OF MULTI-UNIT CONSTRUCTION
Cooper, 2009, database
For these pressurized water reactors, there was little difference in the cost of single and
initial reactors, with an average cost of approximately $2,350/kW. The multi-unit reactors were
substantially less costly, at an average of $2,000/kW. Including the boiling water reactors in the
analysis shows a larger difference. The average cost of stand-alone units (i.e. units constructed
at a site in which a second unit was not commenced within two years) was just under $3,000/kW.
The initial unit of a multi-unit site cost just under $2,200/kW. The subsequent units of a multi-
unit site cost just under $2,000/kW.47 Note, however, that there was cost escalation for all three
categories: single unit, initial unit and multi-unit.
We do not have data to make a direct comparison between the French and U.S. industries
in this regard. We do note that the French have a much higher concentration of reactors at each
site, averaging almost three per site, whereas in the U.S. over the course of the history of the
industry, the average number was 1.5 reactors per site.
45
Cooper, 2009d.
46
Cooper, 2009d.
47
In the French data, Komanoff finds that the number of reactors under construction in a given year lowers the cost. Without access to the data,
we cannot examine this finding, but it may be that, given the pattern of French construction, the clustering of multiple site units may
be causing this effect.
24
33. A M ULTIVARIATE MODEL FOR THE U.S. PRODUCTION FUNCTION
Variables
The above discussion suggests three sets of characteristics that affect nuclear reactor
building cost – the reactors, the industry, and the builder, as summarized in Exhibit III-6. The
construction period is a key intervening variable.
EXHIBIT III-6: FACTORS THAT AFFECT REACTOR CONSTRUCTION COSTS
To combine these variables into a multivariate approach, a data set was built with the
variables as defined in Exhibit III-7. The variables have been operationalized along the lines
used in the bivariate analysis. The analysis of the reactor economics focuses on the following
factors:
The primary dependent variable on which the analysis focuses is the overnight cost –
the cost per kW for construction, without finance or owner costs stated in 2008$.
The Construction Period is included as an intervening variable because it is such a
strong predictor of construction costs. It is included as a direct cause of construction
cost. The indirect effect of other variables on construction cost is also examined
through their effect on the construction period.
Technology is included in two ways: as a variable in the overall econometric model to
assess its impact on the other factors in the model and as a subset of observation
within which the model is estimated. The effect of TMI is handled in a similar
fashion.
Reactor Capacity is included, as well as whether the reactor was a second or third unit
at a multi-unit site started in a time frame that was expected to yield cost savings.
25
34. EXHIBIT III-7: VARIABLES IN THE U.S. DATA SET
For the industry, two variables are included:
Industry Activity: the number of reactors under construction in the industry in the
year in which a given reactor was put under construction.
Industry Experience: in the year a given reactor is put into construction, the number
of units completed or put under construction prior to that year since the beginning of
the building cycle.
For the builder, two variables are included that parallel the industry variables:
Builder Activity: the number of reactors under construction by the builder in the year
in which a given reactor was put under construction.
Builder Experience: in the year a given reactor is put into construction, the number of
units completed or put under construction prior to that year by the builder since the
beginning of the building cycle.
The dependent variable is the log of the overnight cost (log linear models), which can be
interpreted as the percentage change in cost per unit of change in the independent variable.
RESULTS
The analytic strategy is to isolate the impact of industry, builder and project
characteristics by including different sets of variables, as well as conducting the analysis in
separate subsets of reactors. Exhibit III-8 presents the results in the form of bivariate and
26
35. multivariate regression coefficients. The results shown in Exhibit III-8 are for a log linear
model, where the causal factors (independent variables) are the characteristics of the reactors, the
industry and the builder.48 The log linear approach is intuitive,49 particularly with a number of
categorical variables.50 Because the earlier discussion also focused on Pressurized Water
Reactor as a separate technology, the results for this subset of the reactors are presented
separately.51 Given the important role that the construction period plays in the determination of
cost, the indirect effects of each of the factors on the final cost are also considered through their
indirect effect on construction period.
The Beta coefficients are shown for both bivariate and multivariate models in Exhibit III-
8. Betas are standardized coefficients that measure a one-unit change in each of the variables, so
they help to assess the relative importance of each of the variables.
Exhibit III-9 shows the effects of each independent variable on overnight costs expressed
as the percentage change in overnight costs associated with a one-unit change in the independent
variable. The results show that there is little support for the learning and scaling up hypothesis at
the industry level. The evidence is mixed at the builder and reactor levels.
The variables included in the model explain almost nine-tenths of the cost of the reactors
and about two-thirds of the construction period. This is true for all reactors, as well as the subset
of pressurized water reactors. The amount of variance in cost explained by the variables in the
split sample before and after TMI is similarly high, but the amount of variance explained in the
construction period before and after TMI is lower because TMI accounts for a large part of the
variance as a covariate in this approach.
Pressurized water reactors had almost 13 percent lower costs than boiling water reactors
with larger effects after TMI.
Larger units had lower costs, with each additional unit of capacity lowering the cost by
0.07 percent; however, note that larger capacity units took longer to build. Therefore,
approximately three-quarters of the cost savings due to the size of the unit were offset by
increases in the construction period. This is consistent with the findings discussed in Chapter II
about why increasing the size of the units did not have the anticipated cost-reducing benefits.
The length of the construction period had a major impact on cost, with each year of
construction increasing cost by 11 percent.
Second units at multi-unit sites had substantially lower costs, by 25 percent.
48
The results are based on robust standard errors, since a test for heteroskedasticity produced a significant test statistic. Although a test for
collinearity did not exceed traditional levels, the TMI variable exhibited substantial the collinearity. For statistical and substantive
reasons, we have specified the model based on subsets of the data before and after TMI. We also considered a version of the model
split before and after the regulatory ―stalemate.‖ The results are similar. A statistical Appendix is available from the author.
49
We have run the analyses on a linear and double log linear basis (i.e. all continuous variables are converted to logs) and the results are quite
similar.
50
Komanoff, 2010, shows the results of a much simpler model for France using a double log linear specification.
51
We tested for a difference between Westinghouse and other PWR designs, but did not find it statistically significant.
27
36. EXHIBIT III-8: REGRESSION RESULTS
Notes: Significance levels based on robust standard errors: * = p <.1, ** = p < .05, *** = p<.01, **** = p< .0001. All Variable Inflation Factors (VIF)
are less than 10.Beta coefficients shown with p <.1; but the Betas are calculated with all variables in the model. Dependent is log of cost. All other
variables are absolute values.
28
37. EXHIBIT III-9: PERCENTAGE CHANGE IN OVERNIGHT COSTS ASSOCIATED WITH A ONE-UNIT
CHANGE IN THE INDEPENDENT VARIABLE
Industry activity and industry experience are not associated with lower costs. None of the
coefficients indicate a statistically significant relationship in which increasing experience or
activity is associated with lower costs. Every coefficient that is larger than its standard error
indicates that industry experience and activity increases cost. Half of the relationships are
statistically significant and indicate increasing cost with increasing experience and activity. The
industry experience variable is statistically significant in the full set of reactors and in the
pressurized water subset; industry activity is statistically significant in the latter. The industry
experience variable has the largest effect on cost.
The builder characteristics have a mixed pattern.52 Builder activity is associated with
lower costs, about 4 percent per plant under construction, but builder experience is associated
with higher costs, about 1 percent per plant completed. However, the indirect effects through the
construction period tend to run in the opposite direction. In the case of builder experience, where
all effects are statistically significant, the indirect effect offsets the direct effect. Again, the
results are consistent with the failure of learning effects.
CONCLUSION
The hope/claim that costs of nuclear reactors will go down as more are built is not
supported by the cross-national, bivariate analysis or the econometric analysis. The hypothesis
fails to receive support in three-quarters of the statistical tests and the significant findings are
more likely to support the opposite conclusion: costs of nuclear reactors increase as more are
built.
The findings of the comparative France-U.S. analysis and the detailed econometric
analysis of the U.S. data are consistent with what Grubler calls the ―Bupp-Derian-Komanoff-
52
Komanoff, 1981, found a significant effect for a specific builder. We tested a ―low cost builder‖ variable but found that controlling for the other
factors in the model, it was significant at the 10 percent level in only one specification of the model and did not explain much
variance.
29
38. Taylor hypothesis.‖53The Bupp-Derian 1978 analysis was cited at length here because that early
analysis antedates the regulatory and popular battles that attracted so much attention in the U.S.
The findings in this analysis also replicate Komanoff‘s 1981 econometric analysis, 54which was
based on about half the reactors ultimately built in the U.S. Both the Komanoff analysis and this
analysis found that:
The project scale characteristics that appear to lower cost also lengthen the
construction period, which leads to a frustrating and mixed outcome.
Industry experience is associated with high costs.
Builder experience is associated with lower costs. This analysis finds a
more mixed result by distinguishing between cumulative experiences from
the level of activity and including the much longer time frame.
The earlier finding that nuclear reactor construction suffers from cost escalation is
broadly affirmed. Nuclear reactor cost projection suffers from severe problems, when
confronted with the reality of underlying cost escalation.
53
Lovins, 1986 used this expression.
54
Komanoff, 1981, found two effects that we have not. He found a ―Northeast‖ effect. Our data show that this effect was limited to the early,
pre-TMI period. He also found a specific effect associated with a single builder (Babcock and Wilcox). We tested a low cost builder
variable and found it was not generally significant once the other variables are included in the analysis.
30
39. IV. THE IMPACT OF NUCLEAR REACTORS AND CENTRAL STATION
FACILITIES ON ALTERNATIVES
The analysis, estimation and projection of nuclear reactor construction costs are not
typically academic exercises. They are policy-oriented activities intended to convince someone
to spend the resources to construct a new nuclear reactor. The context of the decision and the
alternatives available must also be taken into account in order to understand why a specific
choice was made or to recommend a sound policy or choice for the future. A brief consideration
of the context and alternatives adds important perspective to the historical analysis above and
helps to frame the choices confronting policymakers today.
A costly technology suffering from severe cost escalation puts pressure on those involved
in developing and deploying it. With large commitments of financial and institutional resources
to the construction of reactors, there is a tendency to press projects ahead in spite of adverse
economics. We have already seen an indication of this in the failure of price projection to reflect
reality. The dysfunction of the system had other substantial impacts, especially on the choice of
alternatives.
FRANCE
The French program suffered from demand reduction brought on by the oil price shocks
of the 1970s. Much like the industry in the U.S., it did not adjust rapidly or well, instead
building up excess capacity. Grubler notes the tension between the stimulus for more capacity to
reduce dependence on oil and the demand reduction induced by the oil price shock, not unlike
the tensions between climate change policy and the current recession-induced demand reduction.
This period is overshadowed by the unfolding of the consequences of the two "oil
shocks" that reinforced the political legitimacy of the ambitious nuclear investment
program. The oil shocks also paved the way for the subsequent nuclear
overcapacity, as slackening demand growth remained unreflected in the bullish
demand and capacity expansion projections and orders.
Thus the French PWR program remained at full throttle regardless of external
circumstances. Orders of 5-6 reactors per year, supplemented by grid-connections
of the first reactors commissioned in the previous period, and first operating
experiences from initial reactors became available in the late 1970s.55
The PEON Commission report in 1973 projected France‘s electricity demand as
400 TWh in 1985 and 750 TWh in 2000, compared to actual numbers of 300 and
430 TWh respectively (G-M-T, 2000:373). These over-projections of demand
growth led subsequently to substantial (and costly) overcapacity in orders and
construction, requiring not un-painful adjustments.56
The highly centralized French state monopoly was able to force projects through to
55
Grubler, 2009, p. 10
56
Grubler, 2009, p. 9.
31
40. completion.57The ability of the centralized system to force reactors online also had the effect of
justifying policies to promote wasteful use of electricity to absorb the surplus. These difficulties
cascade and distort policy choices. The result was excess capacity that placed a burden on taxpayers
and consumers. Schneider argues that as many as one-fifth to one-quarter of the reactors was not
needed. The push to absorb the large excess of baseload capacity caused the abandonment of
efficiency and conservation and created a peak load problem.
In the 1980s significant overcapacities were built up in the power sectors as well
as in refineries and nuclear fuel industries and most of the energy intelligence
initiatives based on efficiency and conservation were abandoned. …
Rather than downsizing its nuclear extension program, EDF develop a very
aggressive two-front policy: long-term baseload power export contracts and
dumping of electricity into competitive markets like space heating and hot water
generation…
France increasingly lacks peak load power whose consumption skyrocketed in the
1980s and 1990s in particular as a consequence of massive introduction of electric
space heating…
Today, per capita electricity consumption in France is almost a quarter higher
than in Italy (that phased out nuclear energy after the Chernobyl accident in 1986)
and 15% higher than the EU27 average.58
The dysfunctionalities of the system in France may be somewhat less apparent than in the
U.S. (discussed below), but they are just as real.
The system is entirely exempt from influential corrective elements. Once a
decision is taken, there is no way back or out. Examples include the large
overbuilding of nuclear capacity… By the middle of the 1980s, it was perfectly
clear that the nuclear program was vastly oversized by some 12 to 16 units. But
while 138 reactor orders were cancelled in the U.S. at various stages of
implementation, absolutely no changes were made to the planning, even when
electricity consumption did not even nearly follow forecasts. The reaction was to
develop power export for dumping prices and to stimulate electricity consumption
by any possible means (in particular thermal uses like heating, hot water
production and cooking).59
The drive for policies that would increase consumption to absorb excess capacity had a
side effect. There was little inclination to pursue alternative sources of generation.
Consequently, ―the energy efficiency + renewables efforts in France have remained severely
57
Grubler, 2009, p. 15. ―The institutional key to success in France was the extremely limited number of institutional actors: "mortals" never
played any decisive role either in the technocratic decision-making process or in hindering rapid expansion. The senior actors were
extraordinarily well coordinated through the "invisible hand" of a small technocratic elite—, the nationalized utility ÉDF and the state
nuclear R&D organization CEA acted in a well-coordinated way, overcoming inevitable rivalries and differences of opinion. They ended
up with a clearly formulated vision, mobilized the necessary resources, and proved quite apt in executing this extremely large-scale
and complex technology program.‖ The recent breakdown of this unanimity under the stress of failure has attracted considerable
attention.
58
Schneider, 2008, p. 7.
59
Schneider, 2009, note 28.
32
41. underdeveloped…. In 2008 Spain added more wind power capacity (4,600 MW) than France had
installed in total by 2007 (4,060 MW).60
The critique of the French policy assumes that the outcome could have been different.
This is true in an absolute sense – the choice of residential heating – and a relative sense – others
pursued different paths. Cross-national comparisons require caution because there are many
differences between nations that could explain the observed difference in policy choices and
outcomes. Systematic studies of OECD nations support the qualitative observations.61
Exhibit IV-1 presents the consumption of electricity per capita plotted against income per
capita for a subset of nations that is referred to as OECD – Europe. It excludes the former Soviet
bloc nations, which have a very different energy background.62 It also excludes Northern Europe
(Nordic countries, which have different climates) and UK and Ireland (Islands that require
different alternative energy resource endowments). By examining electricity consumption per
capita per dollar of income in this set of nations that is matched on climate and also reasonably
matched on renewable potential, the comparison is ―fair.‖ The United States is included for
discussion below.
France has a relatively high level of consumption compared to the other nine nations and
EXHIBIT IV-1: ANNUAL ELECTRICITY CONSUMPTION IN WESTERN EUROPE AND THE U.S.
LU
US
BE
FR AT SZ
NL
ES DE DK
GR IT
PT
Sources and notes: World Bank per capita electricity consumption and Gross National Income.
http://data.worldbank.org/indicator/EG.USE.ELEC.KH.PC
http://data.worldbank.org/indicator/NY.GNP.PCAP.CD
60
Froggat and Schneider, 2010, p. 19.
61
Ibid, Geller, et al., 2006; Olz, 2007; Suding, 2007. Ragwitz and Held, 2007.
62
The European nations included are Austria, Belgium, Denmark, France Germany, Greece, Italy, Luxemburg, Netherlands, Portugal, Spain and
Switzerland.
33