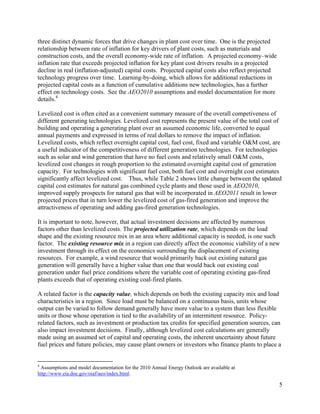
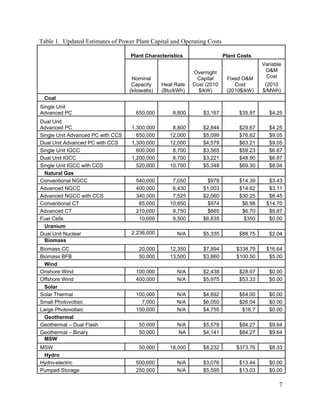
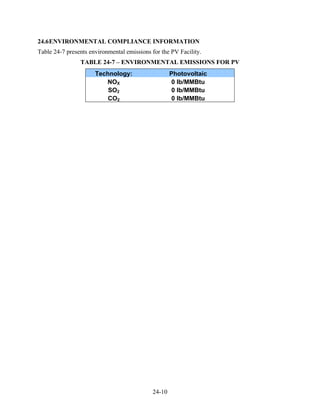
Updated Capital Cost Estimates for Electricity
                      Generation Plants


                                             November 2010
                                   U. S. Energy Information Administration
                                           Office of Energy Analysis

                                            U.S. Department of Energy
                                             Washington, DC 20585


This report was prepared by the U.S. Energy Information Administration (EIA), the statistical and analytical agency
within the U.S. Department of Energy. By law, EIA’s data, analyses, and forecasts are independent of approval by
any other officer or employee of the United States Government. The views in this report therefore should not be
construed as representing those of the Department of Energy or other Federal agencies.
The current and future projected cost of new electricity generation capacity is a critical input into
the development of energy projections and analyses. The cost of new generating plants plays an
important role in determining the mix of capacity additions that will serve growing loads in the
future. New plant costs also help to determine how new capacity competes against existing
capacity, and the response of the electricity generators to the imposition of environmental
controls on conventional pollutants or any limitations on greenhouse gas emissions.

The current and projected future costs of energy-related capital projects, including but not
limited to new electric generating plants, have been subject to considerable change in recent
years. EIA updates its cost and performance assumptions annually, as part of the development
cycle for the Annual Energy Outlook (AEO). For the AEO2011 cycle, EIA commissioned an
external consultant to develop current cost estimates for utility-scale electric generating plants.1
This paper briefly summarizes the design of the project and provides a summary of its main
findings, including a comparison of the new estimates to those used in AEO2010. The final
section discusses how EIA uses information on cost and other factors in modeling technology
choice in the electric power sector.

Developing Updated Estimates: Key Design Considerations

In order to maximize its value to EIA and external energy analysts, the project focused on
gathering current information regarding the “overnight”2 cost for a wide range of generation
technologies, while taking care to use a common boundary in the costing exercise across those
technologies. The cost estimates for each technology were developed for a generic facility of a
specific size and configuration, and assuming a location without unusual constraints or
infrastructure needs.

Current information is particularly important during a period when actual and estimated costs
have been evolving rapidly, since the use of up-to-date cost estimates for some technologies in
conjunction with estimates that are two, three, or even five years old for others can significantly
skew the results of modeling and analysis. Where possible, costs estimates were based on
information regarding actual or planned projects available to the consultant. When this
information was not available, project costs were estimated by using costing models that account
for current labor and material rates that would be necessary to complete the construction of a
generic facility.

The use of a common boundary for costing is also very important. From experience in reviewing
many costing studies for individual technologies, EIA is well aware that differences in practices
regarding the inclusion or exclusion of various components of costs can have a large impact on
overall cost estimates. This includes the categories of civil and structural costs (e.g., allowance

1
  EIA’s electricity modeling includes both combined heat and power (CHP) technologies as well as a variety of
distributed generation technologies, but those technologies were not addressed in the study, which focused on
technologies within the electric power sector.
2
  “Overnight cost” is an estimate of the cost at which a plant could be constructed assuming that the entire process
from planning through completion could be accomplished in a single day. This concept is useful to avoid any
impact of financing issues and assumptions on estimated costs. Starting from overnight cost estimates, EIA’s
electricity modeling explicitly takes account of the time required to bring each generation technology online and the
costs of financing construction in the period before a plant becomes operational.

                                                                                                                    2
for site preparation, drainage, underground utilities, and buildings), project indirect costs (e.g., a
construction contingency), and owners costs (e.g., development costs, preliminary feasibility and
engineering studies, environmental studies and permitting, legal fees, insurance costs, property
taxes during construction, and the electrical interconnection costs, including a plant switchyard
and tie-in to nearby transmission).

Summary of updated overnight capital costs estimates and comparison to information used in
AEO2010

Table 1 summarizes the updated cost estimates for the generic utility-scale generation plants
represented in EIA’s model, including 7 powered by coal, 6 by natural gas, 3 by solar energy, 2
each by wind, hydro, biomass, and geothermal power, and 1 each by uranium and municipal
solid waste. For some plant types there are several options shown to better represent the range of
plants that might be built and their costs. For example, both single unit and dual unit advanced
pulverized coal plants are shown, because many plants include multiple units and the costs
associated with the dual unit configuration might better reflect the costs of most plants built.
Similarly, solar photovoltaic technologies include a relatively small 7 MW system and a much
larger 150 MW system, because there is such variance in the sizes of the facilities being
considered. The nominal capacity of the generic plants ranges from a 7 megawatt (MW) solar
plant to a 2,236 MW advanced dual-unit nuclear plant, reflecting the significant variation in the
scale of utility applications. Each technology is characterized by its overnight capital costs, heat
rate (where applicable), non-fuel operations and maintenance costs, and, though not shown in
Table 1, its environmental characteristics.

Table 2 compares the updated overnight cost estimates to those used as inputs to the AEO2010.
To facilitate comparisons, both are shown in real year 2010 dollars. Notable changes between
the updated estimates and the AEO2010 values include:

      Coal & Nuclear: The updated overnight capital cost estimates for coal and nuclear
       power plants are 25 to 37 percent above those in AEO2010. The higher cost estimates
       reflect many factors including the overall trend of rising costs of capital intensive
       technology in the power sector, higher global commodity prices, and the fact that there
       are relatively few construction firms with the ability to complete complex engineering
       projects such as a new nuclear or advanced coal power plant. The study assumes cost-
       sharing agreements between the project owner and the project construction contractors
       are reflective of those recently observed in the marketplace. As shown in Table 1, dual
       unit coal and nuclear plants generally have lower overnight costs per kilowatt than single-
       unit plants, reflecting their ability to take advantage of redundancies and scale economies
       in onsite infrastructure such as wastewater management and environmental controls to
       reduce the estimated total per-kilowatt cost of the project.
      Natural Gas: The updated cost estimates for natural gas combined cycle and combustion
       turbines generally remained similar to those of AEO2010.
      Solar: The overnight capital costs for solar thermal and photovoltaic technologies
       dropped by 10 percent and 25 percent, respectively. The decrease in the cost of
       photovoltaics was due to the assumption of larger plant capacity and falling component
       costs.

                                                                                                     3
   Onshore Wind: Overnight costs for onshore wind increased by about 21 percent relative
        to AEO 2010 assumptions. This is based on a specification for a new, stand-alone wind
        plant including all owners’ costs and may differ from other reported costs in the literature,
        which are not fully characterized and may include sites that are built along side existing
        plants (and are thus able to avoid some amount of infrastructure costs).
       Offshore Wind: While offshore wind plants have been built in Europe, there have only
        been proposals in the United States, with final permitting only recently issued on the first
        of these proposals. The updated costs, some 50 percent higher than AEO 2010 estimates,
        are consistent with substantial first-of-a-kind costs that would likely be encountered when
        building projects in the United States, which largely lacks the unique infrastructure,
        needed to support this type of construction.
       Geothermal: Geothermal costs are highly site-specific, and are represented as such in the
        AEO estimates. The updated cost estimate is over 50 percent higher than the same site in
        AEO 2010.
       Biomass: Biomass capital costs are largely unchanged from AEO2010. However, the
        technology represented by the costs has changed significantly. Prior estimates were for a
        highly efficient plant employing gasification and a combined cycle generator; the new
        estimate is for a significantly less efficient direct combustion boiler. The lower operating
        efficiency (and therefore higher operating cost) for the biomass plant considered in the
        updated cost estimate implies a reduced attractiveness of investment in new biomass
        generation at an overnight cost similar to that for the more efficient biomass plant
        characterized in AEO2010.

While estimates of the current cost of generic electric generation capacity of various types are
one key input to EIA’s analysis of electricity markets, the evolution of the electricity mix in each
of the 22 regions to be modeled in AEO20113 is also sensitive to many other factors, including
the projected evolution of capital costs over the modeling horizon, projected fuel costs, whether
wholesale power markets are regulated or competitive, the existing generation mix, additional
costs associated with environmental control requirements, load growth, and the load shape.
Almost all of these factors can vary by region, as do capacity factors for renewable generation,
operations and maintenance costs associated with individual plants, and cost multipliers applied
to the generic estimates of overnight capital costs outlined in Tables 1 and 2. The next section
provides a brief overview of some of the relevant issues, which are described in more detail in
the description of the Electric Market Module included in the 2010 edition of the documentation
for EIA’s National Energy Modeling System.

EIA’s Analysis of Technology Choice in the Electric Power Sector

Estimates of the overnight capital cost of generic generating technologies are only the starting
point for consideration of the cost of new generating capacity in EIA modeling analyses. EIA
also considers regional variation in construction costs, the structure of wholesale power markets
that affect financing costs, the length of time required to bring each type of plant into service,
and the capacity availability factors for solar and wind generation plants. EIA also accounts for

3
  In AEO2010 and prior editions, the continental U.S., excluding Alaska, was divided in 13 regions for purposes of
electricity modeling. The 22 region model that will be used starting with AEO2011 will allow for better
representation of policy boundaries and market structure at the State level.

                                                                                                                     4
three distinct dynamic forces that drive changes in plant cost over time. One is the projected
relationship between rate of inflation for key drivers of plant costs, such as materials and
construction costs, and the overall economy-wide rate of inflation. A projected economy–wide
inflation rate that exceeds projected inflation for key plant cost drivers results in a projected
decline in real (inflation-adjusted) capital costs. Projected capital costs also reflect projected
technology progress over time. Learning-by-doing, which allows for additional reductions in
projected capital costs as a function of cumulative additions new technologies, has a further
effect on technology costs. See the AEO2010 assumptions and model documentation for more
details.4

Levelized cost is often cited as a convenient summary measure of the overall competiveness of
different generating technologies. Levelized cost represents the present value of the total cost of
building and operating a generating plant over an assumed economic life, converted to equal
annual payments and expressed in terms of real dollars to remove the impact of inflation.
Levelized costs, which reflect overnight capital cost, fuel cost, fixed and variable O&M cost, are
a useful indicator of the competitiveness of different generation technologies. For technologies
such as solar and wind generation that have no fuel costs and relatively small O&M costs,
levelized cost changes in rough proportion to the estimated overnight capital cost of generation
capacity. For technologies with significant fuel cost, both fuel cost and overnight cost estimates
significantly affect levelized cost. Thus, while Table 2 shows little change between the updated
capital cost estimates for natural gas combined cycle plants and those used in AEO2010,
improved supply prospects for natural gas that will be incorporated in AEO2011 result in lower
projected prices that in turn lower the levelized cost of gas-fired generation and improve the
attractiveness of operating and adding gas-fired generation technologies.

It is important to note, however, that actual investment decisions are affected by numerous
factors other than levelized costs. The projected utilization rate, which depends on the load
shape and the existing resource mix in an area where additional capacity is needed, is one such
factor. The existing resource mix in a region can directly affect the economic viability of a new
investment through its effect on the economics surrounding the displacement of existing
resources. For example, a wind resource that would primarily back out existing natural gas
generation will generally have a higher value than one that would back out existing coal
generation under fuel price conditions where the variable cost of operating existing gas-fired
plants exceeds that of operating existing coal-fired plants.

A related factor is the capacity value, which depends on both the existing capacity mix and load
characteristics in a region. Since load must be balanced on a continuous basis, units whose
output can be varied to follow demand generally have more value to a system than less flexible
units or those whose operation is tied to the availability of an intermittent resource. Policy-
related factors, such as investment or production tax credits for specified generation sources, can
also impact investment decisions. Finally, although levelized cost calculations are generally
made using an assumed set of capital and operating costs, the inherent uncertainty about future
fuel prices and future policies, may cause plant owners or investors who finance plants to place a


4
 Assumptions and model documentation for the 2010 Annual Energy Outlook are available at
http://www.eia.doe.gov/oiaf/aeo/index.html.

                                                                                                     5
value on portfolio diversification. EIA considers all of these factors in its analyses of
technology choice in the electricity sector.

In sum, while overnight cost estimates are important inputs for EIA modelers and other analysts,
they are not the sole driver of the choice among electric generation technologies. Users
interested in additional details regarding these updated cost estimates should review the
consultant study prepared by R.W. Beck for EIA in Appendix A.


                                                                                               6
Table 1. Updated Estimates of Power Plant Capital and Operating Costs

                                   Plant Characteristics                  Plant Costs
                                                                                         Variable
                                                             Overnight                    O&M
                                    Nominal                   Capital      Fixed O&M      Cost
                                    Capacity     Heat Rate   Cost (2010       Cost        (2010
                                   (kilowatts)   (Btu/kWh)     $/kW)       (2010$/kW)    $/MWh)
 Coal
Single Unit
Advanced PC                           650,000        8,800       $3,167         $35.97      $4.25
Dual Unit
Advanced PC                        1,300,000         8,800       $2,844         $29.67     $4.25
Single Unit Advanced PC with CCS     650,000        12,000       $5,099         $76.62     $9.05
Dual Unit Advanced PC with CCS     1,300,000        12,000       $4,579         $63.21     $9.05
Single Unit IGCC                     600,000         8,700       $3,565         $59.23     $6.87
Dual Unit IGCC                     1,200,000         8,700       $3,221         $48.90     $6.87
Single Unit IGCC with CCS            520,000        10,700       $5,348         $69.30     $8.04
  Natural Gas
Conventional NGCC                     540,000        7,050         $978         $14.39     $3.43
Advanced NGCC                         400,000        6,430       $1,003         $14.62     $3.11
Advanced NGCC with CCS                340,000        7,525       $2,060         $30.25     $6.45
Conventional CT                        85,000       10,850         $974          $6.98    $14.70
Advanced CT                           210,000        9,750        $665           $6.70     $9.87
Fuel Cells                             10,000        9,500       $6,835          $350      $0.00
  Uranium
Dual Unit Nuclear                  2,236,000           N/A       $5,335         $88.75      $2.04
  Biomass
Biomass CC                             20,000       12,350       $7,894        $338.79    $16.64
Biomass BFB                            50,000       13,500       $3,860        $100.50     $5.00
  Wind
Onshore Wind                          100,000          N/A       $2,438         $28.07     $0.00
Offshore Wind                         400,000          N/A       $5,975         $53.33     $0.00
  Solar
Solar Thermal                         100,000          N/A       $4,692         $64.00     $0.00
Small Photovoltaic                      7,000          N/A       $6,050         $26.04     $0.00
Large Photovoltaic                    150,000          N/A       $4,755          $16.7     $0.00
  Geothermal
Geothermal – Dual Flash                50,000          N/A       $5,578         $84.27     $9.64
Geothermal – Binary                    50,000          NA        $4,141         $84.27     $9.64
  MSW
MSW                                    50,000       18,000       $8,232        $373.76      $8.33
 Hydro
Hydro-electric                        500,000          N/A       $3,076         $13.44     $0.00
Pumped Storage                        250,000          N/A       $5,595         $13.03     $0.00

                                                                                                7
Table 2. Comparison of Updated Plant Costs to AEO2010 Plant Costs

                                         Table II
                               Overnight Capital Cost ($/kW)       Nominal Capacity KW's1
                               AEO         AEO            %          AEO
                                                                              AEO 2010
                               2011        2010       Change         2011
            Coal
  Advanced PC w/o CCS          $2,844     $2,271         25%      1,300,000       600,000
      IGCC w/o CCS             $3,221     $2,624         23%      1,200,000       550,000
        IGCC CCS               $5,348     $3,857         39%       600,000        380,000
       Natural Gas
   Conventional NGCC            $978      $1,005         -3%       540,000        250,000
     Advanced NGCC             $1,003      $989          1%        400,000        400,000
  Advanced NGCC with
                               $2,060     $1,973         4%        340,000        400,000
            CCS
     Conventional CT            $974       $700          39%        85,000        160,000
       Advanced CT              $665       $662          0%        210,000        230,000
         Fuel Cells            $6,835     $5,595         22%        10,000         10,000
          Nuclear
          Nuclear              $5,339     $3,902         37%      2,236,000      1,350,000
       Renewables
          Biomass              $3,860     $3,931         -2%        50,000         80,000
        Geothermal             $4,141     $1,786        132%        50,000         50,000
    MSW - Landfill Gas         $8,232     $2,655        210%        50,000         30,000
       Conventional
                               $3,078     $2,340         53%       500,000        500,000
        Hydropower
           Wind                $2,438     $2,007         21%       100,000         50,000
       Wind Offshore           $5,975     $4,021         49%       400,000        100,000
       Solar Thermal           $4,692     $5,242        -10%       100,000        100,000
        Photovoltaic           $4,755     $6,303        -25%       150,000          5,000
1
  Higher plant capacity reflects the assumption that plants would install multiple units per
site and that savings could could be gained by eliminating redundancies and combining
services.


                                                                                               8
Appendix A


             9
EOP III TASK 1606, SUBTASK 3 – REVIEW OF
   POWER PLANT COST AND PERFORMANCE
            ASSUMPTIONS FOR NEMS
       Technology Documentation Report
                   R. W. Beck, Inc.
Science Applications International Corporation (SAIC)

                       Prepared by:
               Vincent Hahn, R. W. Beck
                  John Fix, R. W. Beck
               John Schmalz, R. W. Beck
              Michael Wennen, R. W. Beck
             Evis Couppis, Ph.D., R. W. Beck

               Prepared in Coordination with:
                Jay Ratafia-Brown, SAIC

                       Prepared For:
           Energy Information Administration
       Office of Integrated Analysis and Forecasting
                      Alan Beamon
                      Michael Leff


                     October 2010
Disclaimer

Certain statements included in this report constitute forward-looking statements. The achievement of certain results
or other expectations contained in such forward-looking statements involve known and unknown risks, uncertainties
and other factors which may cause actual results, performance or achievements described in the report to be
materially different from any future results, performance or achievements expressed or implied by such
forward-looking statements. We do not plan to issue any updates or revisions to the forward-looking statements if
or when our expectations or events, conditions, or circumstances on which such statements are based occur.
TABLE OF CONTENTS
1.             Introduction ................................................................................................................. 1-1 
      1.1            Technologies Assessed .......................................................................................... 1-1 

2.             General Basis for Technology Evaluation Basis ...................................................... 2-1 
      2.1            R. W. Beck Background ........................................................................................ 2-1 
      2.2            Base Fuel Characteristics ...................................................................................... 2-1 
      2.3            Environmental Compliance Basis ......................................................................... 2-4 
      2.4            Local Capacity Adjustments ................................................................................. 2-4 
      2.5            Technology Specifications .................................................................................... 2-6 
      2.6            Cost Estimation Methodology ............................................................................... 2-6 
        2.6.1        Capital Cost ............................................................................................................ 2-6 
             2.6.1.1       Costing Scope .................................................................................................. 2-6 
        2.6.2        Operation and Maintenance (O&M) Expenses ...................................................... 2-7 
             2.6.2.1       Fixed O&M (FOM).......................................................................................... 2-8 
             2.6.2.2       Variable O&M (VOM) .................................................................................... 2-8 
             2.6.2.3       Major Maintenance .......................................................................................... 2-8 

3.             Advanced Pulverized Coal (APC) ............................................................................. 3-1 
      3.1            Mechanical Equipment and Systems ..................................................................... 3-1 
      3.2            Electrical and Control Systems ............................................................................. 3-2 
      3.3            Off-Site Requirements ........................................................................................... 3-2 
      3.4            Capital Cost Estimate ............................................................................................ 3-3 
      3.5            O&M Estimate ...................................................................................................... 3-8 
      3.6            Environmental Compliance Information ............................................................... 3-8 

4.             Advanced Pulverized Coal With CCS (APC/CCS).................................................. 4-1 
      4.1            Mechanical Equipment and Systems ..................................................................... 4-1 
      4.2            Electrical and Control Systems ............................................................................. 4-2 
      4.3            Off-Site Requirements ........................................................................................... 4-2 
      4.4            Capital Cost Estimate ............................................................................................ 4-2 
      4.5            O&M Estimate ...................................................................................................... 4-7 
      4.6            Environmental Compliance Information ............................................................... 4-8 


                                                                        i
5.           Conventional Natural Gas Combined Cycle (NGCC) ............................................. 5-1 
      5.1          Mechanical Equipment and Systems ..................................................................... 5-1 
      5.2          Electrical and Control Systems ............................................................................. 5-2 
      5.3          Off-Site Requirements ........................................................................................... 5-2 
      5.4          Capital Cost Estimate ............................................................................................ 5-3 
      5.5          O&M Estimate ...................................................................................................... 5-6 
      5.6          Environmental Compliance Information ............................................................... 5-7 

6.           Advanced Generation Natural Gas Combined Cycle (AG-NGCC) ....................... 6-1 
      6.1          Mechanical Equipment and Systems ..................................................................... 6-1 
      6.2          Electrical and Control Systems ............................................................................. 6-1 
      6.3          Off-Site Requirements ........................................................................................... 6-1 
      6.4          Capital Cost Estimate ............................................................................................ 6-1 
      6.5          O&M Estimate ...................................................................................................... 6-4 
      6.6          Environmental Compliance Information ............................................................... 6-4 

7.           Advanced Generation Natural Gas Combined Cycle With CCS
             (AG-NGCC/CCS)........................................................................................................ 7-1 
      7.1          Mechanical Equipment and Systems ..................................................................... 7-1 
      7.2          Electrical and Control Systems ............................................................................. 7-1 
      7.3          Off-Site Requirements ........................................................................................... 7-1 
      7.4          Capital Cost Estimate ............................................................................................ 7-1 
      7.5          O&M Estimate ...................................................................................................... 7-4 
      7.6          Environmental Compliance Information ............................................................... 7-4 

8.           Conventional Combustion Turbine (CT).................................................................. 8-1 
      8.1          Mechanical Equipment and Systems ..................................................................... 8-1 
      8.2          Electrical and Control Systems ............................................................................. 8-1 
      8.3          Off-Site Requirements ........................................................................................... 8-1 
      8.4          Capital Cost Estimate ............................................................................................ 8-2 
      8.5          O&M Estimate ...................................................................................................... 8-5 
      8.6          Environmental Compliance Information ............................................................... 8-6 

9.           Advanced Combustion Turbine (ACT) .................................................................... 9-1 
      9.1          Mechanical Equipment and Systems ..................................................................... 9-1 
      9.2          Electrical and Control Systems ............................................................................. 9-1 

                                                                   ii
9.3           Off-Site Requirements ........................................................................................... 9-1 
  9.4           Capital Cost Estimate ............................................................................................ 9-1 
  9.5           O&M Estimate ...................................................................................................... 9-4 
  9.6           Environmental Compliance Information ............................................................... 9-4 

10.       Integrated Gasification Combined Cycle (IGCC) ................................................. 10-1 
  10.1          Mechanical Equipment and Systems ................................................................... 10-1 
  10.2          Electrical and Control Systems ........................................................................... 10-3 
  10.3          Off-Site Requirements ......................................................................................... 10-3 
  10.4          Capital Cost Estimate .......................................................................................... 10-4 
  10.5          O&M Estimate .................................................................................................. 10-10 
  10.6          Environmental Compliance Information ........................................................... 10-11 

11.       Integrated Gasification Combined Cycle With CCS (IGCC/CCS) ...................... 11-1 
  11.1          Mechanical Equipment and Systems ................................................................... 11-1 
  11.2          Electrical and Control Systems ........................................................................... 11-1 
  11.3          Off-Site Requirements ......................................................................................... 11-1 
  11.4          Capital Cost Estimate .......................................................................................... 11-1 
  11.5          O&M Estimate .................................................................................................... 11-4 
  11.6          Environmental Compliance Information ............................................................. 11-4 

12.       Advanced Nuclear (AN) ........................................................................................... 12-1 
  12.1          Mechanical Equipment and Systems ................................................................... 12-1 
  12.2          Electrical and Control Systems ........................................................................... 12-2 
  12.3          Off-Site Requirements ......................................................................................... 12-3 
  12.4          Capital Cost Estimate .......................................................................................... 12-3 
  12.5          O&M Estimate .................................................................................................... 12-7 
  12.6          Environmental Compliance Information ............................................................. 12-7 

13.       Biomass Combined Cycle (BCC) ............................................................................. 13-1 
  13.1          Mechanical Equipment and Systems ................................................................... 13-1 
  13.2          Electrical and Control Systems ........................................................................... 13-2 
  13.3          Off-Site Requirements ......................................................................................... 13-3 


                                                                iii
13.4          Capital Cost Estimate .......................................................................................... 13-3 
  13.5          O&M Estimate .................................................................................................... 13-7 
  13.6          Environmental Compliance Information ............................................................. 13-8 

14.       Biomass Bubbling Fluized Bed (BBFB) .................................................................. 14-1 
  14.1          Mechanical Equipment and Systems ................................................................... 14-1 
  14.2          Electrical and Control Systems ........................................................................... 14-2 
  14.3          Off-Site Requirements ......................................................................................... 14-2 
  14.4          Capital Cost Estimate .......................................................................................... 14-2 
  14.5          O&M Estimate .................................................................................................... 14-6 
  14.6          Environmental Compliance Information ............................................................. 14-7 

15.       Fuel Cell (FC) Mechanical Equipment and Systems ............................................. 15-1 
  15.1          Electrical and Control Systems ........................................................................... 15-1 
  15.2          Off-Site Requirements ......................................................................................... 15-1 
  15.3          Capital Cost Estimate .......................................................................................... 15-2 
  15.4          O&M Estimate .................................................................................................... 15-5 
  15.5          Environmental Compliance Information ............................................................. 15-6 

16.       Geothermal Dual Flash (GT) ................................................................................... 16-1 
  16.1          Mechanical Equipment and Systems ................................................................... 16-1 
  16.2          Electrical and Control Systems ........................................................................... 16-2 
  16.3          Off-Site Requirements ......................................................................................... 16-2 
  16.4          Capital Cost Estimate .......................................................................................... 16-3 
  16.5          O&M Estimate .................................................................................................... 16-6 
  16.6          Environmental Compliance Information ............................................................. 16-6 

17.       Geothermal Binary (Binary) .................................................................................... 17-1 
  17.1          Mechanical Equipment and Systems ................................................................... 17-1 
  17.2          Electrical and Control Systems ........................................................................... 17-1 
  17.3          Off-Site Requirements ......................................................................................... 17-2 
  17.4          Capital Cost Estimate .......................................................................................... 17-2 
  17.5          O&M Estimate .................................................................................................... 17-5 
  17.6          Environmental Compliance Information ............................................................. 17-6 


                                                               iv
18.       Municipal Solid Waste (MSW) ................................................................................ 18-1 
  18.1          Mechanical Equipment and Systems ................................................................... 18-1 
  18.2          Electrical and Control Systems ........................................................................... 18-2 
  18.3          Off-Site Requirements ......................................................................................... 18-2 
  18.4          Capital Cost Estimate .......................................................................................... 18-2 
  18.5          O&M Estimate .................................................................................................... 18-5 
  18.6          Environmental Compliance Information ............................................................. 18-6 

19.       Hydroelectric (HY) ................................................................................................... 19-1 
  19.1          Mechanical Equipment and Systems ................................................................... 19-1 
  19.2          Electrical and Control Systems ........................................................................... 19-1 
  19.3          Off-Site Requirements ......................................................................................... 19-1 
  19.4          Capital Cost Estimate .......................................................................................... 19-2 
  19.5          O&M Estimate .................................................................................................... 19-5 
  19.6          Environmental Compliance Information ............................................................. 19-5 

20.       Pumped Storage (PS) ................................................................................................ 20-1 
  20.1          Mechanical Equipment and Systems ................................................................... 20-1 
  20.2          Electrical and Control Systems ........................................................................... 20-1 
  20.3          Off-Site Requirements ......................................................................................... 20-1 
  20.4          Capital Cost Estimate .......................................................................................... 20-2 
  20.5          O&M Estimate .................................................................................................... 20-5 
  20.6          Environmental Compliance Information ............................................................. 20-5 

21.       Onshore Wind (WN) ................................................................................................. 21-1 
  21.1          Mechanical Equipment and Systems ................................................................... 21-1 
  21.2          Electrical and Control Systems ........................................................................... 21-2 
  21.3          Off-Site Requirements ......................................................................................... 21-2 
  21.4          Capital Cost Estimate .......................................................................................... 21-2 
  21.5          O&M Estimate .................................................................................................... 21-5 
  21.6          Environmental Compliance Information ............................................................. 21-6 

22.       Offshore Wind (WF) ................................................................................................. 22-1 
  22.1          Mechanical Equipment and Systems ................................................................... 22-1 
  22.2          Electrical and Control Systems ........................................................................... 22-2 


                                                                v
22.3         Off-Site Requirements ......................................................................................... 22-2 
  22.4         Capital Cost Estimate .......................................................................................... 22-3 
  22.5         O&M Estimate .................................................................................................... 22-6 
  22.6         Environmental Compliance Information ............................................................. 22-6 

23.       Solar Thermal - Central Station (SO) ..................................................................... 23-1 
  23.1         Mechanical Equipment and Systems ................................................................... 23-1 
  23.2         Electrical and Control Systems ........................................................................... 23-2 
  23.3         Off-Site Requirements ......................................................................................... 23-3 
  23.4         Capital Cost Estimate .......................................................................................... 23-3 
  23.5         O&M Estimate .................................................................................................... 23-7 
  23.6         Environmental Compliance Information ............................................................. 23-7 

24.       Photovoltaic (Central Station) Facility (PV) .......................................................... 24-1 
  24.1         Mechanical Equipment and Systems ................................................................... 24-1 
  24.2         Electrical and Control Systems ........................................................................... 24-1 
  24.3         Off-Site Requirements ......................................................................................... 24-2 
  24.4         Capital Cost Estimate .......................................................................................... 24-2 
  24.5         O&M Estimate .................................................................................................... 24-9 
  24.6         Environmental Compliance Information ........................................................... 24-10 


                                                              vi
LIST OF FIGURES

Figure 3-1 – Advanced Pulverized Coal Design Configuration .................................................. 3-2 
Figure 4-1 – APC Facility Diagram ............................................................................................. 4-1 
Figure 5-1 – Conventional NGCC Design Configuration ........................................................... 5-2 
Figure 6-1 – AG-NGCC Design Configuration ........................................................................... 6-1 
Figure 7-1 – AG-NGCC With CCS Design Configuration ......................................................... 7-1 
Figure 8-1 – Conventional CT Design Configuration ................................................................. 8-1 
Figure 9-1 – Advanced CT Design Configuration ....................................................................... 9-1 
Figure 10-1 – IGCC Design Configuration ............................................................................... 10-3 
Figure 11-1 – IGCC/CCS Design Configuration ....................................................................... 11-1 
Figure 12-1 – AN Design Configuration ................................................................................... 12-2 
Figure 13-1 – BCC Design Configuration ................................................................................. 13-2 
Figure 14-1 – BCC Design Configuration ................................................................................. 14-1 
Figure 15-1 – FC Design Configuration .................................................................................... 15-1 
Figure 16-1 – GT Design Configuration .................................................................................... 16-2 
Figure 17-1 – GT Design Configuration .................................................................................... 17-1 
Figure 19-1 – HY Design Configuration ................................................................................... 19-1 
Figure 20-1 – PS Design Configuration..................................................................................... 20-1 
Figure 21-1 – WN Design Configuration .................................................................................. 21-1 
Figure 22-1 – WF Design Configuration ................................................................................... 22-2 
Figure 23-1 – SO Design Configuration .................................................................................... 23-2 
Figure 24-1 – PV Design Configuration .................................................................................... 24-1 


                                                               vii
LIST OF TABLES

Table 1-1 – List of Technologies For Review ............................................................................. 1-2 
Table 2-1 – Reference Coal Specification ................................................................................... 2-2 
Table 2-2 – Natural Gas Specification ......................................................................................... 2-3 
Table 2-3 – Wood-Biomass Specification ................................................................................... 2-3 
Table 2-4 – CT Capacity Adjustments......................................................................................... 2-5 
Table 2-5 – Technology Performance Specifications ................................................................ 2-10 
Table 3-1 – Base Plant Site Capital Cost Estimate for APC........................................................ 3-3 
Table 3-2 – Base Plant Site Capital Cost Estimate for APC........................................................ 3-4 
Table 3-3 – Location-Based Costs for APC (650,000 kW) ......................................................... 3-5 
Table 3-4 – Location-Based Costs for APC (1,300,000 kW) ...................................................... 3-7 
Table 3-5 – O&M Expenses for APC (650,000 kW)................................................................... 3-8 
Table 3-6 – O&M Expenses for APC (1,300,000 kW)................................................................ 3-8 
Table 3-7 – Environmental Emissions for APC .......................................................................... 3-9 
Table 4-1 – Base Plant Site Capital Cost Estimate for APC/CCS ............................................... 4-3 
Table 4-2 – Base Plant Site Capital Cost Estimate for APC/CCS ............................................... 4-3 
Table 4-3– Location-Based Costs for APC/CCS Facility (650,000 kW) .................................... 4-4 
Table 4-4 – Location-Based Costs for APC/CCS Facility (1,300,000 kW) ................................ 4-6 
Table 4-5 – O&M Expenses for APC/CCS (650,000 kW) .......................................................... 4-7 
Table 4-6 – O&M Expenses for APC/CCS (1,300,000 kW) ....................................................... 4-8 
Table 4-7 – Environmental Emissions for APC/CCS .................................................................. 4-8 
Table 5-1 – Base Plant Site Capital Cost Estimate for Conventional NGCC .............................. 5-3 
Table 5-2 – Location-Based Costs for Conventional NGCC....................................................... 5-5 
Table 5-3 – O&M Expenses for Conventional NGCC ................................................................ 5-7 
Table 5-4 – Environmental Emissions for Conventional NGCC................................................. 5-7 
Table 6-1 – Base Plant Site Capital Cost Estimate for AG-NGCC ............................................. 6-2 
Table 6-2 – Location-Based Costs for AG-NGCC ...................................................................... 6-3 
Table 6-3 – O&M Expenses for AG-NGCC................................................................................ 6-4 
Table 6-4 – Environmental Emissions for AG-NGCC ................................................................ 6-5 
Table 7-1 – Base Plant Site Capital Cost Estimate for AG-NGCC/CCS Cost ............................ 7-2 
Table 7-2 – Location-Based Costs for AG-NGCC/CCS ............................................................. 7-3 


                                                               viii
Table 7-3 – O&M Expenses for AG-NGCC With CCS .............................................................. 7-4 
Table 7-4 – Environmental Emissions for AG-NGCC/CCS ....................................................... 7-5 
Table 8-1 – Base Plant Site Capital Cost Estimate for Conventional CT.................................... 8-2 
Table 8-2 – Location-Based Costs for Conventional CT............................................................. 8-4 
Table 8-3 – O&M Expenses for Conventional CT ...................................................................... 8-6 
Table 8-4 – Environmental Emissions for Conventional CT....................................................... 8-6 
Table 9-1 – Base Plant Site Capital Cost Estimate for Advanced CT ......................................... 9-2 
Table 9-2 – Location-Based Costs for Advanced CT .................................................................. 9-3 
Table 9-3 – O&M Expenses for Advanced CT ........................................................................... 9-4 
Table 9-4 – Environmental Emissions for Advanced CT ............................................................ 9-5 
Table 10-1 – Base Plant Site Capital Cost Estimate for IGCC .................................................. 10-4 
Table 10-2 – Base Plant Site Capital Cost Estimate for IGCC .................................................. 10-5 
Table 10-3 – Location-Based Costs for IGCC (600,000 kW) ................................................... 10-7 
Table 10-4 – Location-Based Costs for IGCC (1,200,000 kW) ................................................ 10-9 
Table 10-5 – O&M Expenses for IGCC (600,000 kW) ........................................................... 10-10 
Table 10-6 – O&M Expenses for IGCC (1,200,000 kW) ........................................................ 10-11 
Table 10-7 – Environmental Emissions for IGCC ................................................................... 10-11 
Table 11-1 – Base Plant Site Capital Cost Estimate for IGCC/CCS ......................................... 11-2 
Table 11-2 – Location-Based Costs for IGCC/CCS .................................................................. 11-3 
Table 11-3 – O&M Expenses for IGCC/CCS............................................................................ 11-4 
Table 11-4 – Environmental Emissions for IGCC/CCS ............................................................ 11-5 
Table 12-1 – Base Plant Site Capital Cost Estimate for AN...................................................... 12-4 
Table 12-2 – Location-Based Costs for AN .............................................................................. 12-5 
Table 12-3 – O&M Expenses for AN ........................................................................................ 12-7 
Table 12-4 – Environmental Emissions for AN ........................................................................ 12-7 
Table 13-1 – Base Plant Site Capital Cost Estimate for BCC ................................................... 13-4 
Table 13-2 – Location-Based Costs for BCC ............................................................................ 13-6 
Table 13-3 – O&M Expenses for BCC ...................................................................................... 13-7 
Table 13-4 – Environmental Emissions for BCC ...................................................................... 13-8 
Table 14-1 – Base Plant Site Capital Cost Estimate for BBFB ................................................. 14-3 
Table 14-2– Location-Based Costs for BBFB ........................................................................... 14-5 
Table 14-3 – O&M Expenses for BCC ...................................................................................... 14-6 
Table 14-4 – Environmental Emissions for BBFB .................................................................... 14-7 

                                                             ix
Table 15-1 – Base Plant Site Capital Cost Estimate for FC ...................................................... 15-2 
Table 15-2 – Location-Based Costs for FC ............................................................................... 15-4 
Table 15-3 – O&M Expenses for FC ......................................................................................... 15-5 
Table 15-4 – Environmental Emissions for FC ......................................................................... 15-6 
Table 16-1 – Base Plant Site Capital Cost Estimate for GT ...................................................... 16-3 
Table 16-2 – Location-Based Costs for GT ............................................................................... 16-5 
Table 16-3 – O&M Expenses for GT ........................................................................................ 16-6 
Table 16-4 – Environmental Emissions for GT ......................................................................... 16-7 
Table 17-1 – Base Plant Site Capital Cost Estimate for GT ...................................................... 17-2 
Table 17-2 – Location-Based Costs for GT ............................................................................... 17-4 
Table 17-3 – O&M Expenses for Binary ................................................................................... 17-5 
Table 17-4 – Environmental Emissions for Binary ................................................................... 17-6 
Table 18-1 – Base Plant Site Capital Cost Estimate for MSW .................................................. 18-3 
Table 18-2 – Location-Based Costs for MSW ........................................................................... 18-4 
Table 18-3 – O&M Expenses for MSW .................................................................................... 18-6 
Table 18-4 – Environmental Emissions for MSW ..................................................................... 18-6 
Table 19-1 – Base Plant Site Capital Cost Estimate for HY...................................................... 19-2 
Table 19-2 – Location-Based Costs for HY .............................................................................. 19-4 
Table 19-3 – O&M Expenses for HY ........................................................................................ 19-5 
Table 19-4 – Environmental Emissions for HY ........................................................................ 19-6 
Table 20-1 – Base Plant Site Capital Cost Estimate for PS ....................................................... 20-2 
Table 20-2 – Location-Based Costs for PS ................................................................................ 20-4 
Table 20-3 – O&M Expenses for PS ......................................................................................... 20-5 
Table 20-4 – Environmental Emissions for PS .......................................................................... 20-6 
Table 21-1 – Location-Based Costs for WN.............................................................................. 21-3 
Table 21-2 – Location-Based Costs for WN.............................................................................. 21-4 
Table 21-3 – O&M Expenses for WN ....................................................................................... 21-6 
Table 21-4 – Environmental Emissions for WN........................................................................ 21-6 
Table 22-1 – Base Plant Site Capital Cost Estimate for WF ..................................................... 22-3 
Table 22-2 – Location-Based Costs for WF .............................................................................. 22-5 
Table 23-1 – Base Plant Site Capital Cost Estimate for SO ...................................................... 23-4 
Table 23-2 – Location-Based Costs for SO ............................................................................... 23-6 
Table 23-3 – O&M Expenses for SO ......................................................................................... 23-7 

                                                              x
Table 23-4 – Environmental Emissions for SO ......................................................................... 23-8 
Table 24-1 – Base Plant Site Capital Cost Estimate for PV ...................................................... 24-3 
Table 24-2 – Base Plant Site Capital Cost Estimate for PV ...................................................... 24-4 
Table 24-3 – Location-Based Costs for PV (7 MW) ................................................................. 24-6 
Table 24-4 – Location-Based Costs for PV (150 MW) ............................................................. 24-8 
Table 24-5 – O&M Expenses for PV Facility (7 MW) ............................................................. 24-9 
Table 24-6 – O&M Expenses for PV Facility (150 MW) ......................................................... 24-9 
Table 24-7 – Environmental Emissions for PV ....................................................................... 24-10 


                                                            xi
LIST OF ACRONYMS AND ABBREVIATIONS

AC            Alternating Current
AG            Advanced Generation
AG-NGCC       Advanced Generation Natural Gas Combined Cycle
AG-NGCC/CCS   Advanced Generation Natural Gas Combined Cycle with CCS
AGR           Acid Gas Removal
AN            Advanced Nuclear
APC           Advanced Pulverized Coal Facility
APC/CCS       Advanced Pulverized Coal with CCS
ASU           Air Separation Unit
BACT          Best Available Control Technology
BCC           Biomass Combined Cycle
BBFB          Biomass Bubbling Fluidized Bed
BFB           Bubbling Fluidized Bed
BOP           Balance-of-Plant
BPF           Brine Processing Facility
Btu           British Thermal Unit
C             Carbon
CCS           Carbon Capture and Sequestration
CFB           Circulating Fluidized Bed
C2H6          Ethane
C3H8          Propane
C4H10         n-Butane
CH4           Methane
CO            Carbon Monoxide
CO2           Carbon Dioxide
COS           Carbonyl Sulfide
CT            Combustion Turbine
DC            Direct Current
DCS           Distributed Control System
DLN           Dry Low-NOX Combustion
EIA           Energy Information Administration
EMM           Electricity Market Module of NEMS
EPC           Engineering, Procurement and Construction
F            Degrees Fahrenheit
FC            Fuel Cell
FGD           Flue Gas Desulfurization
FOM           Fixed O&M
Geothermal    GT
GHG           Greenhouse Gas
GSU           Generator Step-up Transformer
GT            Geothermal
H2S           Hydrogen Sulfide


                                       xii
HHV        High(er) Heating Value
HP         High Pressure
HRSG       Heat Recovery Steam Generator
HY         Hydroelectric
Hz         Hertz
I&C        Instrumentation and Controls
IGCC       Integrated Gasification Combined Cycle
IGCC/CCS   Integrated Gasification Combined Cycle Carbon Capture and Sequestration
IP         Intermediate Pressure
kg         Kilograms
KJ         Kilojoules
kW         Kilowatt
kWh        Kilowatt-hour
kV         Kilovolt
kVA        kilovolt-amperes
lb         Pound
LHV        Low(er) Heating Value
CLP        Low Pressure
MEA        Monoethanolamine
MJ         Mega joules
MMBtu      Million Btu
MSW        Municipal Solid Waste
MW         Megawatt
MWe        Megawatts Electric
MWh        Megawatt-hour
MVA        Mega-volt-amperes
N2         Nitrogen
NEMS       National Energy Modeling System
NGCC       Natural Gas Combined Cycle
NH3        Ammonia
NOX        Oxides of Nitrogen
O2         Oxygen
O&M        Operating and Maintenance
NOx        Nitrogen Oxides
ppmvd      Parts per Million Volume Dry
PS         Pumped Storage
psia       Pounds per Square Inch Absolute
PV         Photovoltaic
PWR        Pressurized Water Reactor
RCS        Reactor Coolant System
S          Sulfur
SCADA      Supervisory Control and Data Acquisition
scf        Standard Cubic Feet
scm        Standard Cubic Meters
SCR        Selective Catalytic Reduction
SNCR       Selective Non-catalytic Reduction


                                     xiii
SO     Solar Thermal
SO2    Sulfur Dioxide
SRU    Sulfur Recovery Unit
ST     Steam Turbine
TGF    Turbine Generating Facility
U.S.   United States
V      Volt
VOM    Variable Operating and Maintenance
WF     Offshore Wind
WFGD   Wet Flue Gas Desulfurization
WN     Onshore Wind
WTG    Wind Turbine Generator
ZLD    Zero Liquid Discharge


                                 xiv
1.   INTRODUCTION
This report presents R. W. Beck, Inc.’s (“R. W. Beck”) performance and cost assessment of
power generation technologies utilized by the Energy Information Administration (“EIA”) in the
Electricity Market Module (“EMM”) of the National Energy Modeling System (“NEMS”). The
assessment for each of the technologies considered includes the following:
        Overnight construction costs, construction lead times, first year of commercial
         application, typical unit size, contingencies, fixed and variable operating costs, and
         efficiency (heat rate). The analysis was conducted to ensure that the overnight cost
         estimates developed for use in the EMM for electric generating technologies are
         consistent in scope, accounting for all costs in the planning and development of a power
         plant including the basic interconnection to the grid at the plant site, but excluding
         financing costs.
        For emission control technologies, the removal rates for pollutants and other assumptions
         were examined.
        Review of the regional multipliers that are used to represent local conditions, such as
         labor rates that are included in EMM.
        Review of assumptions regarding how construction costs decline over time due to
         technological advancement and “learning by doing.”
        Review of the appropriateness of technology-specific project and process contingency
         assumptions (capturing differences between engineering estimates and realized costs for
         new technologies).
        Where possible, compare the values used by EIA with those for recently built facilities in
         the United States (“U.S.”) or abroad. Where such actual cost estimates do not exist, an
         assessment was made between values used by EIA and other analyst estimates, as well as
         vendor estimates.
        The key factors expected to drive each technology’s costs.
        Document the source and basis for final recommendations for altering or retaining the
         various assumptions.

1.1 TECHNOLOGIES ASSESSED
The following table lists all technologies to be assessed in this project.


                                                 1-1
TABLE 1-1 – LIST OF TECHNOLOGIES FOR REVIEW
       TECHNOLOGY                          DESCRIPTION                            COMMENTS
Advanced Pulverized Coal          650 megawatt-electrical (“MWe”)     Greenfield Installation
                                  and 1,300 MWe; supercritical; all
                                  advanced pollution control
                                  technologies
Advanced Pulverized Coal with     650 MWe and 1,300 MWe;              Greenfield Installation
Carbon Capture and                supercritical; all advanced
Sequestration (“CCS”)             pollution control technologies,
                                  including CCS technologies
Conventional Natural Gas          540 MWe; F-Class system
Combined Cycle (“NGCC”)
Advanced NGCC                     400 MWe; H-Class system
Advanced NGCC with CCS            340 MWe; H-Class system
Conventional Combustion           85 MWe; E-Class turbine
Turbine (“CT”)
Advanced CT                       210 MWe; F-Class turbine
Integrated Gasification           600 MWe and 1,200 MWe; F-
Combined Cycle (“IGCC”)           Class-syngas system


IGCC with CCS                     520 MWe; F-Class-syngas system
Advanced Nuclear                  2,236 megawatt (“MW”); AP1000       Brownfield Installation
                                  PWR Basis
Biomass Combined Cycle            20 MWe                              Wood Fuel
Biomass Bubbling Fluidized        50 MWe                              Wood Fuel
Bed (“BFB”)
Fuel Cells                        10 MWe
Geothermal                        50 MWe Dual Flash and Binary
Municipal Solid Waste             50 MWe
(“MSW”)
Hydroelectric                     500 MWe
Pumped Storage                    250 MWe
Wind Farm – Onshore               100 MWe
Wind Farm – Offshore              400 MWe
Solar Thermal – Central Station   100 MWe
Photovoltaic – Central Station    7 MWe and 150 MWe


                                                    1-2
2.   GENERAL BASIS FOR TECHNOLOGY EVALUATION BASIS
This section specifies the general evaluation basis used for all technologies reviewed herein.

2.1 R. W. BECK BACKGROUND
R. W. Beck is an infrastructure consulting firm that has been providing technical and business
consulting in the energy industry since 1942. Particularly, R. W. Beck has supported the
purchase, sale, financing and Owner’s advisory consulting for tens-of-billions of dollars of
power plants across the world in all commercial power generating technologies as well as many
emerging technologies. This background has supported R. W. Beck’s acumen with respect to
construction costs, operating costs, technology development and evolution, as well as trends in
environmental regulation and compliance.

2.2 BASE FUEL CHARACTERISTICS
This section provides a general fuel basis for each of the fuel types utilized by the technologies
considered in this report and listed in Table 1-1. Each of the technologies that combust a fuel
has the ability to operate over a range of fuels; thus Table 2-1, Table 2-2 and Table 2-3 show a
typical fuel specification for coal, natural gas, and wood-biomass, respectively. MSW has such a
wide range of constituents; a typical analysis is not included here.


                                               2-1
TABLE 2-1 – REFERENCE COAL SPECIFICATION
   Rank                                Bituminous
   Seam                          Illinois No. 6 (Herrin)
   Source                             Old Ben Mine
               Proximate Analysis (weight %) (Note A)
                           As Received                 Dry
   Moisture                   11.12                   0.00
   Ash                         9.70                  10.91
   Volatile Matter            34.99                   39.37
   Fixed Carbon               44.19                  49.72
   Total                     100.00                  100.00
   Sulfur                      2.51                   2.82
   HHV (1), KJ/kg (2)        27,113                  30,506
   HHV, Btu/lb (3)           11,666                  13,126
         (4)
   LHV , KJ/kg               26,151                  29,544
   LHV, Btu/lb               11,252                  12,712
                  Ultimate Analysis (weight %)
                           As Received                Dry
   Moisture                   11.12                   0.00
   Carbon                     63.75                  71.72
   Hydrogen                    4.50                   5.06
   Nitrogen                    1.25                   1.41
   Chlorine                    0.29                   0.33
   Sulfur                      2.51                   2.82
   Ash                         9.70                  10.91
   Oxygen                      6.88                   7.75
   Total                     100.00                  100.00
 (1)   High(er) heating value (“HHV”).
 (2)   Kilojoules per kilogram (“KJ/kg”).
 (3)   British thermal units per pound (“Btu/lb”).
 (4)   Low(er) heating value (“LHV”).


                                       2-2
TABLE 2-2 – NATURAL GAS SPECIFICATION
                 Component                      Volume Percentage
   Methane                        CH4                     93.9
   Ethane                         C2H6                     3.2
   Propane                        C3H8                     0.7
   n-Butane                       C4H10                    0.4
   Carbon Dioxide                 CO2                      1.0
   Nitrogen                        N2                      0.8
     Total                                                100.0
                                                  LHV         HHV
   kJ/kg                                         47.764       52,970
   MJ/scm (1)                                      35           39
   Btu/lb                                        20,552       22,792
   Btu/scf (2)                                    939         1,040
 (1)   Mega joules per standard cubic meter (“MJ/scm”).
 (2)   Standard cubic feet (“scf”).


TABLE 2-3 – WOOD-BIOMASS SPECIFICATION (1)
                 Component                      Volume Percentage
   Moisture                                               17.27
   Carbon                           C                     41.55
   Hydrogen                         H2                     4.77
   Nitrogen                         N2                     0.37
   Sulfur                           S                     <0.01
   Ash                                                     2.35
   Oxygen (2)                       O2                    33.75
     Total                                                100.0
                                                                  HHV
   Btu/lb                                                         6,853
 (1)   As received.
 (2)   Oxygen by Difference.


                                     2-3
2.3 ENVIRONMENTAL COMPLIANCE BASIS
The technology assessments considered the emissions rates after implementation of best
available control technology (“BACT”), including sulfur dioxide (“SO2”), oxides of nitrogen
(“NOX”), particulate matter, mercury, and carbon dioxide (“CO2”). With respect to CCS
technologies, which are not currently considered “proven” or BACT by regulating bodies,
R. W. Beck assumed capture and sequestration technologies that are currently in development
for large-scale deployment, as discussed herein, and at industry expected rates of CO2 removal
(i.e., 90 percent).

2.4 LOCAL CAPACITY ADJUSTMENTS
For power plants that use CT technologies, adjustments were made for regional ambient
conditions. The adjustments took into consideration that CTs are machines that produce power
proportional to mass flow. Since air density is inversely proportional to temperature, ambient
temperature has a strong influence on the capacity of a given technology utilizing a CT
(e.g., peaking power plant, combined-cycle power plant, and some gasification power plants).
Additionally, relative humidity impacts the available capacity of a CT and consequently a
CT-based power plant, primarily driven by the base assumption that the CT-based technologies
incorporate inlet evaporative cooling. By circulating water across a porous media in the CT
compressor inlet (across which the air flows), the inlet evaporative cooling reduces the difference
between the ambient dry-bulb temperature (the temperature that is typically reported to the
public as a measure of “local temperature”) and the wet-bulb temperature (a measure of relative
humidity). Since inlet evaporative cooling is limited by the wet-bulb temperature, the
effectiveness of these devices increases in areas of high dry-bulb temperature and low relative
humidity. The final adjustment for ambient conditions made for the CT-based plants is ambient
pressure, which on average (notwithstanding high or low pressure weather fronts that pass
through a region) takes into consideration elevation (average number of feet above sea level).
Air density is proportional to ambient pressure.
Table 2-4 provides the aggregate capacity adjustment for each location, which provides regional
differences related to capital costs against the ISO net capacity for the CT-based power plant
technologies.


                                               2-4
TABLE 2-4 – CT CAPACITY ADJUSTMENTS
                                                Conventional CT               Advanced CT               Conventional NGCC             Advanced ‐ NGCC          Advanced ‐ NGCC With CCS                 IGCC                      IGCC With CCS
                                          ISO     Capacity Adjusted    ISO     Capacity Adjusted    ISO     Capacity Adjusted    ISO     Capacity Adjusted    ISO     Capacity  Adjusted     ISO       Capacity Adjusted    ISO     Capacity Adjusted
                                        Capacity Adjustment Capacity Capacity Adjustment Capacity Capacity Adjustment Capacity Capacity Adjustment Capacity Capacity Adjustment Capacity   Capacity   Adjustment Capacity Capacity Adjustment Capacity
State                  City              (MW)       (MW)        (MW)  (MW)      (MW)      (MW)     (MW)       (MW)      (MW)    (MW)       (MW)      (MW)    (MW)       (MW)      (MW)      (MW)         (MW)     (MW)     (MW)      (MW)       (MW)
Alaska                 Anchorage           85        7.58       92.58  210       18.73     229      540       32.27      572     400       35.67      436     340       30.32      370       600         35.85     636      520       46.38      566
Alaska                 Fairbanks           85        9.97       94.97  210       24.63     235      540       42.43      582     400       46.91      447     340       39.87      380       600         47.14     647      520       60.98      581
Alabama                Huntsville          85        ‐2.12      82.88  210       ‐5.23     205      540        ‐9.01     531     400        ‐9.96     390     340       ‐8.46      332       600        ‐10.01     590      520      ‐12.94      507
Arizona                Phoenix             85        ‐8.33      76.67  210      ‐20.59     189      540      ‐35.47      505     400      ‐39.22      361     340      ‐33.34      307       600        ‐39.41     561      520      ‐50.98      469
Arkansas               Little Rock         85        ‐1.77      83.23  210       ‐4.37     206      540        ‐7.53     532     400        ‐8.32     392     340       ‐7.07      333       600          ‐8.36    592      520      ‐10.82      509
California             Los Angeles         85        ‐1.77      83.23  210       ‐4.37     206      540        ‐7.52     532     400        ‐8.32     392     340       ‐7.07      333       600          ‐8.36    592      520      ‐10.81      509
California             Redding             85        ‐2.52      82.48  210       ‐6.21     204      540      ‐10.71      529     400      ‐11.84      388     340      ‐10.06      330       600        ‐11.90     588      520      ‐15.39      505
California             Bakersfield         85        ‐3.77      81.23  210       ‐9.30     201      540      ‐16.03      524     400      ‐17.72      382     340      ‐15.06      325       600        ‐17.81     582      520      ‐23.03      497
California             Sacramento          85        ‐0.69      84.31  210       ‐1.71     208      540        ‐2.95     537     400        ‐3.26     397     340       ‐2.78      337       600          ‐3.28    597      520       ‐4.24      516
California             San Francisco       85        0.83       85.83  210       2.06      212      540        3.54      544     400        3.92      404     340        3.33      343       600          3.94     604      520       5.09       525
Colorado               Denver              85      ‐12.30       72.70  210      ‐30.40     180      540      ‐52.37      488     400      ‐57.90      342     340      ‐49.22      291       600        ‐58.19     542      520      ‐75.27      445
Connecticut            Hartford            85        2.97       87.97  210       7.33      217      540       12.63      553     400       13.96      414     340       11.87      352       600         14.03     614      520       18.15      538
Delaware               Dover               85        1.22       86.22  210       3.00      213      540        5.17      545     400        5.72      406     340        4.86      345       600          5.75     606      520       7.43       527
District of Columbia   Washington          85        2.01       87.01  210       4.96      215      540        8.55      549     400        9.46      409     340        8.04      348       600          9.50     610      520       12.29      532
Florida                Tallahassee         85        ‐3.00      82.00  210       ‐7.42     203      540      ‐12.79      527     400      ‐14.14      386     340      ‐12.01      328       600        ‐14.21     586      520      ‐18.38      502
Florida                Tampa               85        ‐4.78      80.22  210      ‐11.80     198      540      ‐20.34      520     400      ‐22.49      378     340      ‐19.11      321       600        ‐22.60     577      520      ‐29.23      491
Georgia                Atlanta             85        ‐3.66      81.34  210       ‐9.05     201      540      ‐15.59      524     400      ‐17.24      383     340      ‐14.65      325       600        ‐17.32     583      520      ‐22.41      498
Hawaii                 Honolulu            85        ‐6.75      78.25  210      ‐16.66     193      540      ‐28.71      511     400      ‐31.74      368     340      ‐26.98      313       600        ‐31.90     568      520      ‐41.26      479
Idaho                  Boise               85        ‐5.52      79.48  210      ‐13.64     196      540      ‐23.50      517     400      ‐25.98      374     340      ‐22.08      318       600        ‐26.11     574      520      ‐33.77      486
Illinois               Chicago             85        1.76       86.76  210       4.35      214      540        7.49      547     400        8.28      408     340        7.04      347       600          8.33     608      520       10.77      531
Indiana                Indianapolis        85        0.20       85.20  210       0.50      211      540        0.87      541     400        0.96      401     340        0.81      341       600          0.96     601      520       1.24       521
Iowa                   Davenport           85        1.81       86.81  210       4.47      214      540        7.70      548     400        8.51      409     340        7.23      347       600          8.55     609      520       11.06      531
Iowa                   Waterloo            85        2.02       87.02  210       4.98      215      540        8.58      549     400        9.48      409     340        8.06      348       600          9.53     610      520       12.33      532
Kansas                 Wichita             85        ‐2.91      82.09  210       ‐7.19     203      540      ‐12.39      528     400      ‐13.70      386     340      ‐11.65      328       600        ‐13.77     586      520      ‐17.81      502
Kentucky               Louisville          85        ‐0.20      84.80  210       ‐0.50     210      540        ‐0.86     539     400        ‐0.95     399     340       ‐0.81      339       600          ‐0.96    599      520       ‐1.24      519
Louisiana              New Orleans         85        ‐3.26      81.74  210       ‐8.05     202      540      ‐13.87      526     400      ‐15.34      385     340      ‐13.03      327       600        ‐15.41     585      520      ‐19.94      500
Maine                  Portland            85        4.72       89.72  210       11.66     222      540       20.08      560     400       22.20      422     340       18.87      359       600         22.31     622      520       28.86      549
Maryland               Baltimore           85        1.21       86.21  210       2.98      213      540        5.13      545     400        5.67      406     340        4.82      345       600          5.70     606      520       7.38       527
Massachusetts          Boston              85        2.92       87.92  210       7.20      217      540       12.41      552     400       13.72      414     340       11.66      352       600         13.79     614      520       17.84      538
Michigan               Detroit             85        2.03       87.03  210       5.00      215      540        8.62      549     400        9.53      410     340        8.10      348       600          9.58     610      520       12.39      532
Michigan               Grand Rapids        85        1.97       86.97  210       4.87      215      540        8.39      548     400        9.27      409     340        7.88      348       600          9.32     609      520       12.05      532
Minnesota              Saint Paul          85        2.00       87.00  210       4.95      215      540        8.52      549     400        9.42      409     340        8.01      348       600          9.47     609      520       12.25      532
Mississippi            Jackson             85        ‐2.95      82.05  210       ‐7.30     203      540      ‐12.58      527     400      ‐13.90      386     340      ‐11.82      328       600        ‐13.97     586      520      ‐18.08      502
Missouri               St. Louis           85        ‐0.40      84.60  210       ‐0.98     209      540        ‐1.68     538     400        ‐1.86     398     340       ‐1.58      338       600          ‐1.87    598      520       ‐2.42      518
Missouri               Kansas City         85        ‐1.23      83.77  210       ‐3.04     207      540        ‐5.23     535     400        ‐5.78     394     340       ‐4.92      335       600          ‐5.81    594      520       ‐7.52      512
Montana                Great Falls         85        ‐6.00      79.00  210      ‐14.81     195      540      ‐25.52      514     400      ‐28.21      372     340      ‐23.98      316       600        ‐28.35     572      520      ‐36.68      483
Nebraska               Omaha               85        0.15       85.15  210       0.36      210      540        0.62      541     400        0.68      401     340        0.58      341       600          0.69     601      520       0.89       521
New Hampshire          Concord             85        4.18       89.18  210       10.33     220      540       17.79      558     400       19.67      420     340       16.72      357       600         19.77     620      520       25.57      546
New Jersey             Newark              85        1.69       86.69  210       4.18      214      540        7.21      547     400        7.97      408     340        6.77      347       600          8.01     608      520       10.36      530
New Mexico             Albuquerque         85      ‐13.95       71.05  210      ‐34.46     176      540      ‐59.37      481     400      ‐65.64      334     340      ‐55.79      284       600        ‐65.97     534      520      ‐85.33      435
New York               New York            85        1.69       86.69  210       4.18      214      540        7.21      547     400        7.97      408     340        6.77      347       600          8.01     608      520       10.36      530
New York               Syracuse            85        3.06       88.06  210       7.56      218      540       13.03      553     400       14.41      414     340       12.25      352       600         14.48     614      520       18.73      539
Nevada                 Las Vegas           85        ‐9.24      75.76  210      ‐22.82     187      540      ‐39.31      501     400      ‐43.46      357     340      ‐36.95      303       600        ‐43.68     556      520      ‐56.50      463
North Carolina         Charlotte           85        ‐2.41      82.59  210       ‐5.95     204      540      ‐10.26      530     400      ‐11.34      389     340       ‐9.64      330       600        ‐11.40     589      520      ‐14.74      505
North Dakota           Bismarck            85        1.02       86.02  210       2.53      213      540        4.36      544     400        4.82      405     340        4.09      344       600          4.84     605      520       6.26       526
Ohio                   Cincinnati          85        1.45       86.45  210       3.58      214      540        6.16      546     400        6.81      407     340        5.79      346       600          6.85     607      520       8.85       529
Oregon                 Portland            85        2.02       87.02  210       5.00      215      540        8.61      549     400        9.51      410     340        8.09      348       600          9.56     610      520       12.37      532
Pennsylvania           Philadelphia        85        1.88       86.88  210       4.65      215      540        8.00      548     400        8.85      409     340        7.52      348       600          8.89     609      520       11.50      532
Pennsylvania           Wilkes‐Barre        85        1.07       86.07  210       2.64      213      540        4.55      545     400        5.03      405     340        4.27      344       600          5.05     605      520       6.54       527
Rhode Island           Providence          85        3.16       88.16  210       7.82      218      540       13.47      553     400       14.89      415     340       12.66      353       600         14.96     615      520       19.36      539
South Carolina         Spartanburg         85        ‐2.32      82.68  210       ‐5.73     204      540        ‐9.88     530     400      ‐10.92      389     340       ‐9.28      331       600        ‐10.98     589      520      ‐14.20      506
South Dakota           Rapid City          85        ‐5.15      79.85  210      ‐12.72     197      540      ‐21.91      518     400      ‐24.22      376     340      ‐20.59      319       600        ‐24.34     576      520      ‐31.49      489
Tennessee              Knoxville           85        ‐2.15      82.85  210       ‐5.32     205      540        ‐9.17     531     400      ‐10.14      390     340       ‐8.62      331       600        ‐10.19     590      520      ‐13.18      507
Texas                  Houston             85        ‐3.46      81.54  210       ‐8.54     201      540      ‐14.71      525     400      ‐16.27      384     340      ‐13.83      326       600        ‐16.35     584      520      ‐21.15      499
Utah                   Salt Lake City      85        ‐9.73      75.27  210      ‐24.03     186      540      ‐41.40      499     400      ‐45.77      354     340      ‐38.90      301       600        ‐46.00     554      520      ‐59.50      461
Vermont                Burlington          85        4.40       89.40  210       10.86     221      540       18.71      559     400       20.68      421     340       17.58      358       600         20.79     621      520       26.89      547
Virginia               Alexandria          85        0.27       85.27  210       0.66      211      540        1.14      541     400        1.26      401     340        1.07      341       600          1.26     601      520       1.63       522
Virginia               Lynchburg           85        ‐1.05      83.95  210       ‐2.59     207      540        ‐4.47     536     400        ‐4.94     395     340       ‐4.20      336       600          ‐4.96    595      520       ‐6.42      514
Washington             Seattle             85        1.10       86.10  210       2.72      213      540        4.68      545     400        5.18      405     340        4.40      344       600          5.20     605      520       6.73       527
Washington             Spokane             85        ‐2.90      82.10  210       ‐7.17     203      540      ‐12.35      528     400      ‐13.66      386     340      ‐11.61      328       600        ‐13.73     586      520      ‐17.75      502
West Virginia          Charleston          85        ‐1.21      83.79  210       ‐3.00     207      540        ‐5.16     535     400        ‐5.71     394     340       ‐4.85      335       600          ‐5.74    594      520       ‐7.42      513
Wisconsin              Green Bay           85        3.51       88.51  210       8.67      219      540       14.94      555     400       16.52      417     340       14.04      354       600         16.60     617      520       21.47      541
Wyoming                Cheyenne            85      ‐13.05       71.95  210      ‐32.24     178      540      ‐55.55      484     400      ‐61.42      339     340      ‐52.21      288       600          ‐61.7    538      520      ‐79.84      440
Puerto Rico            Cayey               85        ‐6.00      79.00  210      ‐14.83     195      540      ‐25.56      514     400      ‐28.25      372     340      ‐24.02      316       600        ‐28.40     572      520      ‐36.73      483


                                                                                                                    2-5
2.5 TECHNOLOGY SPECIFICATIONS
This section provides the base performance specifications for each technology.          Table 2-5
provides the current technology specifications.

2.6 COST ESTIMATION METHODOLOGY
2.6.1   Capital Cost
A summary base capital cost estimate (“Cost Estimate”) was developed for each power plant
technology, based on a generic facility of a certain size (capacity) and configuration, and
assuming a non-specific U.S. location with no unusual location impacts (e.g., urban construction
constraints) or infrastructure needs (e.g., a project-dedicated interconnection upgrade cost).
Each Cost Estimate was developed assuming costs in fourth quarter 2010 dollars on an
“overnight” capital cost basis. In each Cost Estimate, the total project engineering, procurement
and construction (“EPC”) cost was organized into the following categories:
       Civil/structural material and installation,
       Mechanical equipment supply and installation,
       Electrical instrumentation and controls (“I&C”) supply and installation,
       Project indirect costs, fees and contingency, and
       Owner’s costs (excluding project financing costs).
It should be noted that an EPC (turnkey) or equipment supply/balance of plant, as applicable to a
given technology, contracting approach was assumed for each of the technologies, which
included a risk sharing between the project owner and project construction contractor that, based
on our experience, would be required in typical financing markets. This approach does not
always result in the lowest cost of construction; however, on average, we believe this approach
to result in an achievable cost of construction, given the other considerations discussed herein.
In addition to the base Cost Estimate provided for the given technology, specific regional cost
differences were determined. Regional costs for 64 unique locations in the U.S. were analyzed.
Eleven subcategories were used (depending on the specific technology under review) to estimate
the differences in various regions of the U.S. for the each power plant technology. The regional
analyses include but are not limited to assessing the cost differences for outdoor installation
considerations, air-cooled condensers versus cooling tower issues, seismic design differences,
zero-water discharge issues, local enhancements, remote location issues, urban high-density
population issues, labor wage and productivity differences, location adjustments, owner cost
differences, and the increase in overheads associated with these 10 locations. More detail with
respect to regional differences for each given technology is provided in the following sections.
2.6.1.1 Costing Scope
The civil and structural costs include allowance for site preparation, such as clearing, roads,
drainage, underground utilities installation, concrete for foundations, piling material, structural
steel supply and installation, and buildings.
The mechanical equipment supply and installation includes major equipment , including but not
limited to, boilers, scrubbers, cooling tower, steam turbine (“ST”) generators, solar panels, CTs,


                                                 2-6
as well as auxiliary equipment such as material handling, fly and bottom ash handling, pumps,
condensers, and balance of plant (“BOP”) equipment such as fire protection, as applicable to a
given technology.
The electrical and I&C supply and installation includes electrical transformers, switchgear,
motor control centers, switchyards, distributed control systems (“DCS”) and instrumentation,
and electrical commodities, such as wire, cable tray, and lighting.
While commodities, project equipment, and site assumptions can vary widely from project-to-
project for a given technology, the Cost Estimates are based upon a cross section of projects.
The project indirect costs include engineering, distributable labor and materials, craft labor
overtime and incentives, scaffolding costs, construction management, and start-up and
commissioning. The fees and contingency include contractor overhead costs, fees and profit, and
construction contingency. Contingency in this category is considered “contractor” contingency,
which would be held by a given contractor to mitigate its risk in the construction of a project.
The owner’s costs include development costs, preliminary feasibility and engineering studies,
environmental studies and permitting, legal fees, project management (including third-party
management), insurance costs, infrastructure interconnection costs (e.g., gas, electricity),
Owner’s Contingency, and property taxes during construction. The electrical interconnection
cost includes an allowance for the plant switchyard and a subsequent interconnection to an
“adjacent” (e.g. within a mile) of the plant, but does not include significant transmission system
upgrades.
2.6.2   Operation and Maintenance (O&M) Expenses
O&M expenses consist of non-fuel O&M costs, owner’s expenses, and fuel-related expenses. In
evaluating the non-fuel O&M expenses for use in the EMM of NEMS, we focused on non-fuel
O&M costs associated with the direct operation of the given power plant technology, referred to
here as the “Production Related Non-Fuel O&M Expenses,” to allow for comparison of O&M
costs on the same basis.
Production Related Non-Fuel O&M Expenses include the following categories:
       Fixed O&M (“FOM”)
       Variable O&M (“VOM”)
       Major Maintenance
Presented below is a brief summary below of the expense categories included within the
categories of Fixed O&M, Variable O&M, and Major Maintenance. Further, Sections 3 through
22 provide more specific information related to Production-Related Non-Fuel O&M Expenses
for each technology.
Owner’s expenses, which are not addressed in this report, include expenses paid by plant owners
that are plant specific and can vary significantly between two virtually identical plants in the
same geographic region. For example, the owner’s expenses include, but are not limited to,
property taxes, asset management fees, energy marketing fees, and insurance.


                                               2-7
2.6.2.1 Fixed O&M (FOM)
FOM expenses are those expenses incurred at a power plant that do not vary significantly with
generation and include the following categories:
      Staffing and monthly fees under pertinent operating agreements
      Typical bonuses paid to the given plant operator
      Plant support equipment which consists of equipment rentals and temporary labor
      Plant-related general and administrative expenses (postage, telephone, etc.)
      Routine preventive and predictive maintenance performed during operations
      Maintenance of structures and grounds
      Other fees required for a project to participate in the relevant National Electric Reliability
       Council region and be in good standing with the regulatory bodies.
Routine preventive and predictive maintenance expenses do not require an extended plant
shutdown and include the following categories:
      Maintenance of equipment such as water circuits, feed pumps, main steam piping, and
       demineralizer systems
      Maintenance of electric plant equipment, which includes service water, DCS, condensate
       system, air filters, and plant electrical
      Maintenance of miscellaneous plant equipment such as communication equipment,
       instrument and service air, and water supply system
      Plant support equipment which consists of tools, shop supplies and equipment rental, and
       safety supplies.
2.6.2.2 Variable O&M (VOM)
VOM expenses are production-related costs which vary with electrical generation and include
the following categories, as applicable to the given power plant technology:
      Raw water
      Waste and wastewater disposal expenses
      Purchase power (which is incurred inversely to operating hours), demand charges and
       related utilities
      Chemicals, catalysts and gases
      Ammonia (“NH3”) for selective catalytic reduction (“SCR”), as applicable
      Lubricants
      Consumable materials and supplies.
2.6.2.3 Major Maintenance
Major maintenance expenses generally require an extended outage, are typically undertaken no
more than once per year; and are assumed to vary with electrical generation or the number of


                                                2-8
plant starts based on the given technology and specific original equipment manufacturer
recommendations and requirements. These major maintenance expenses include the following
expense categories:
      Scheduled major overhaul expenses for maintaining the prime mover equipment at a
       power plant
      Major maintenance labor
      Major maintenance spares parts costs
      BOP major maintenance, which is major maintenance on the equipment at the given plant
       that cannot be accomplished as part of routine maintenance or while the unit is in
       commercial operation.


                                              2-9
TABLE 2-5 – TECHNOLOGY PERFORMANCE SPECIFICATIONS

                                                      Nominal       Nominal         Capital                       Variable
                                                      Capacity      Heat Rate         Cost      Fixed O&M          O&M         SO2 (lb/        NOX             CO2
          Technology                       Fuel       (kW) (1)    (Btu/kWh) (2)    ($/kW) (3)   ($/kW-yr) (4)   ($/MWh) (5)   MMBtu (6)    (lb/MMBtu)     (lb/MMBtu)
Advanced Pulverized Coal                   Coal        650,000       8,800           3,167         35.97           4.25         0.1 (6)        0.06           206 (7)
Advanced Pulverized Coal                   Coal       1,300,000      8,800           2,844         29.67           4.25         0.1 (6)        0.06         206 (7)
Advanced Pulverized Coal with
                                                                                                                               0.02 (8)        0.06         20.6 (9)
CCS                                        Coal        650,000       12,000          5,099         76.62           9.05
Advanced Pulverized Coal with
                                                                                                                               0.02 (8)        0.06         20.6 (9)
CCS                                        Coal       1,300,000      12,000          4,579         63.21           9.05
NGCC                                       Gas         540,000       7,050            978          14.39           3.43         0.001       0.0075 (13)     117 (14)
AG-NGCC                                    Gas         400,000       6,430           1,003         14.62           3.11         0.001       0.0075 (13)     117 (14)
Advanced NGCC with CCS                     Gas         340,000       7,525           2,060         30.25           6.45         0.001       0.0075 (13)      12 (15)
Conventional CT                            Gas         85,000        10,850           974           6.98           14.70        0.001        0.03 (12)      117 (14)
Advanced CT                                Gas         210,000       9,750            665           6.70            9.87        0.001        0.03 (13)      117 (14)
IGCC                                       Coal        600,000       8,700           3,565         59.23            6.87      0.025 (10)    0.0075 (12)     206 (14)
IGCC                                       Coal       1,200,000      8,700           3,221         48.90            6.87      0.025 (10)    0.0075 (12)     206 (14)
IGCC with CCS                              Coal        520,000       10,700          5,348          69.30           8.04      0.015 (11)    0.0075 (12)     20.6 (14)
Advanced Nuclear                          Uranium     2,236,000       N/A            5,339         88.75            2.04           0            0             0
Biomass Combined Cycle                    Biomass       20,000       12,350          7,894         338.79          16.64           0          0.054         195 (14)
Biomass BFB                               Biomass       50,000       13,500          3,860         100.50           5.00           0           0.08         195 (14)
Fuel Cells                                  Gas         10,000       9,500           6,835           350             0         0.00013        0.013          130
Geothermal – Dual Flash                  Geothermal     50,000        N/A            5,578         84.27            9.64        0.2 (16)        0           120 (17)
Geothermal – Binary                      Geothermal     50,000        N/A            4,141         84.27            9.64        0.2 (16)        0           120 (17)
MSW                                        MSW          50,000       18,000          8,232         373.76           8.33       0.07 (18)     0.27 (19)       200
Hydroelectric                              Hydro       500,000        N/A            3,076         13.44             0             0            0             0
Pumped Storage                             Hydro       250,000        N/A            5,595         13.03             0             0            0             0
Onshore Wind                               Wind        100,000        N/A            2,438          28.07            0             0            0             0
Offshore Wind                              Wind        400,000        N/A            5,975          53.33            0             0            0             0
Solar Thermal                              Solar       100,000        N/A            4,692         64.00             0             0            0             0
Photovoltaic                               Solar         7,000        N/A            6,050         26.04             0             0            0             0
Photovoltaic                               Solar       150,000        N/A            4,755         16.70             0             0            0             0

Footnotes are listed on the next page.


                                                                                  2-10
(1)    Capacity is net of auxiliary loads.
(2)    Heat Rate is on a HHV basis for British thermal units per kilowatt-hour (“Btu/kWh”).
(3)    Capital Cost excludes financing-related costs (e.g., fees, interest during construction).
(4)    FOM expenses exclude owner's costs (e.g., insurance, property taxes, and asset management fees).
(5)    VOM expenses include major maintenance.
(6)    Million Btu (“MMBtu”).
(7)    Based on high sulfur bituminous fuel. Emission rate could be lower for sub-bituminous fuel.
(8)    From greenhouse gas (“GHG”) Reporting Rule for Bituminous Coal.
(9)    SO2 emission rates are lower than in the non-capture case to avoid reagent contamination.
(10)   Assuming 90 percent capture.
(11)   Assuming 3 percent sulfur coal at 12,000 British thermal units per pound (“Btu/lb”) and a 99.5 percent sulfur removal rate.
(12)   Assuming 3 percent sulfur coal at 12,000 Btu/lb and a 99.7 percent sulfur removal rate.
(13)   Assuming 9 parts per million volume dry (“ppmvd”) corrected to 15 percent O2; simple-cycle E-Class or F-Class engine.
(14)   Assuming 2 ppmvd corrected to 15 percent O2 for F-Class engine. Assumes development of SCR for IGCC with CCS.
(15)   From GHG Reporting Rule for Pipeline Natural Gas.
(16)   Assuming 90 percent capture.
(17)   Reported as pounds per MWh and as H2S – actual will vary with resource.
(18)   Reported as pounds per MWh – actual will vary with resource.
(19)   Based on 30 ppmvd at 7 percent O2 – 5,000 Btu/lb HHV of MSW.
(20)   Based on 150 ppmvd at 7 percent O2 - 5,000 Btu/lb HHV of MSW.


                                                               2-11
3.   ADVANCED PULVERIZED COAL (APC)

3.1 MECHANICAL EQUIPMENT AND SYSTEMS
The following describes the Advanced Pulverized Coal Facility, which is a nominal 650 MW
coal-fired supercritical steam-electric generating unit built in a Greenfield location. An analysis
is also provided for a nominally 1,300 MW coal-fired supercritical steam-electric generating unit
built in a Greenfield location, which is essentially a dual-unit configuration, based on doubling
the single-unit description provided below; however, a detailed technical description (due to the
similarities/duplication with the single unit) is not provided herein. This unit employs a
supercritical Rankine power cycle in which coal is burned to produce steam in a boiler, which is
expanded through a ST to produce electric power. The steam is then condensed to water and
pumped back to the boiler to be converted to steam once again to complete the cycle.
The unit will operate at steam conditions of up to 3,700 pounds per square inch-absolute (“psia”)
and 1,050 degrees Fahrenheit (“ºF”) at the ST inlet. The superheated steam produced in the
boiler is supplied to the ST, which drives an electric generator. After leaving the high-pressure
(“HP”) ST, the steam is reheated and fed to the intermediate-pressure (“IP”) ST. In the
low-pressure (“LP”) ST, the steam admitted directly from the IP ST expands to condenser
pressure and is condensed in the condenser. Cooling tower water is used for the condensing
process. Condensate collected in the condenser hotwell is discharged by the main condensate
pumps and returned to the deaerator/feedwater storage tank via the LP feedwater heaters. The
feedwater pumps discharge feedwater from the feedwater storage tank to the boiler via the HP
feedwater heaters. In the boiler, the supercritical fluid is heated for return to the ST.
The combustion air and flue gas systems are designed for balanced draft and starts with the
ambient air drawn in by the forced draft fans. This air is heated by steam preheaters and the
regenerative air heaters. Some of the air is passed through the primary air fans for use in drying
and conveying the pulverized coal to the boiler. The air and coal combust in the boiler furnace
and the flue gas passes through the furnace and back passes of the boiler, giving up heat to the
supercritical fluid in the boiler tubes. The flue gas exiting the boiler economizer enters the SCR
equipment for NOX reduction and into the regenerative air heaters where it transfers heat to the
incoming air. From the regenerative air heaters, the flue gas is treated with an injection of
hydrated lime, enters a pulse-jet fabric filter (baghouse) for the collection of particulate material,
and then flows to the induced draft fans. From the fans, gas enters the Wet Flue Gas
Desulfurization (“WFGD”) absorber. From the absorber, the flue gas discharges into the stack.
Figure 3-1 presents the Advanced Pulverized Coal process flow diagram.


                                                 3-1
FIGURE 3-1 – ADVANCED PULVERIZED COAL DESIGN CONFIGURATION


3.2 ELECTRICAL AND CONTROL SYSTEMS
The Advanced Pulverized Coal Facility has one ST electric generator. The generator is a
60 Hertz (“Hz”) machine rated at approximately 800 mega-volt-amperes (“MVA”) with an
output voltage of 24 kilovolts (“kV”). The ST electric generator is directly connected to
generator step-up transformer (“GSU”), which in turn is connected between two circuit breakers
in the high-voltage bus in the Advanced Pulverized Coal Facility switchyard through a
disconnect switch. The GSU increases the voltage from the electric generator from 24 kV to
interconnected transmission system high voltage.
The Advanced Pulverized Coal Facility is controlled using a DCS. The DCS provides
centralized control of the plant by integrating the control systems provided with the boiler, ST
and associated electric generator and the control of BOP systems and equipment.

3.3 OFF-SITE REQUIREMENTS
Coal is delivered to the facility via rail, truck or barge. Water for all processes at the Advanced
Pulverized Coal Facility can be obtained from one of a variety of sources; however, water is
typically sourced from an adjacent river, when possible. The Advanced Pulverized Coal Facility
uses a water treatment system and a high-efficiency reverse osmosis system to reduce the
dissolved solids from the cooling water and to provide distilled water for boiler makeup.
Wastewater is sent to an adjacent river or other approved alternative. Further, the electrical
interconnection from the Advanced Pulverized Coal on-site switchyard is effectuated by a
connection to an adjacent utility substation, assumed to be no more than 1 mile from the
Advanced Pulverized Coal Facility.


                                               3-2
3.4 CAPITAL COST ESTIMATE
The base Cost Estimate for the Advanced Pulverized Coal Facility (“APC”) with a nominal
capacity of 650 MW is $3,167/kilowatt (“kW”) and with a nominal capacity of 1,300 MW is
$2,844/kW. Table 3-1 and Table 3-2 summarize the Cost Estimate categories for the APC
Facility.
       TABLE 3-1 – BASE PLANT SITE CAPITAL COST ESTIMATE FOR APC
                                       Technology: APC
                             Nominal Capacity (ISO): 650,000 kW
                            Nominal Heat Rate (ISO): 8,800 Btu/kWh-HHV

      Capital Cost Category                                                          (000s) (October 1, 2010$)

      Civil Structural Material and Installation                                                224,000

      Mechanical Equipment Supply and
      Installation                                                                              838,500

      Electrical / I&C Supply and Installation                                                  123,000

      Project Indirects (1)                                                                     350,000

      EPC Cost before Contingency and Fee                                                      1,535,500

      Fee and Contingency                                                                       180,000

      Total Project EPC                                                                        1,715,500

      Owner's Costs (excluding project finance)                                                 343,100

      Total Project Cost (excluding finance)                                                   2,058,600

      Total Project EPC                                                $ / kW                     2,639

      Owner Costs 20% (excluding project finance)                      $ / kW                      528

      Total Project Cost (excluding project finance)                   $ / kW                     3,167

      (1)   Includes engineering, distributable costs, scaffolding, construction management, and start-up.


                                                            3-3
TABLE 3-2 – BASE PLANT SITE CAPITAL COST ESTIMATE FOR APC
                                        Technology: APC
                              Nominal Capacity (ISO): 1,300,000 kW
                             Nominal Heat Rate (ISO): 8,800 Btu/kWh-HHV

       Capital Cost Category                                                          (000s) (October 1, 2010$)

       Civil Structural Material and Installation                                                397,250

       Mechanical Equipment Supply and
       Installation                                                                             1,596,100

       Electrical / I&C Supply and Installation                                                  235,000

       Project Indirects (1)                                                                     584,750

       EPC Cost before Contingency and Fee                                                      2,813,100

       Fee and Contingency                                                                       320,000

       Total Project EPC                                                                        3,133,100

       Owner Costs (excluding project finance)                                                   563,958

       Total Project Cost (excluding finance)                                                   3,697,058

       Total Project EPC                                                $ / kW                     2,410

       Owner Costs 18% (excluding project finance)                      $ / kW                      434

       Total Project Cost (excluding project finance)                   $ / kW                     2,844

       (1)   Includes engineering, distributable costs, scaffolding, construction management, and start-up.


For this type of technology and power plant configuration, our regional adjustments took into
consideration the following: outdoor installation considerations, seismic design differences,
remote location issues, labor wage and productivity differences, location adjustments, owner cost
differences, and the increase in overheads associated with these six adjustment criteria.
Outdoor installation locations are considered in geographic areas where enclosed structures for
the boilers would not be required due to the low probability of freezing. The locations that were
included in outdoor installation are Alabama, Arizona, Arkansas, Florida, Georgia, Hawaii,
Louisiana, Mississippi, New Mexico, South Carolina, and Puerto Rico.
Seismic design differences among the various locations were based on U.S. seismic map
information that detailed the various seismic zones throughout the U.S. No cost increases were
associated with seismic Zone 0 and cost step increases were considered for Zones 1, 2, 3 and 4.


                                                             3-4
Remote location issues are related to geographic areas that typically require installation of man
camps, higher craft incentives, and higher per diems are generally required with respect to
construction, due to the fact that such areas are long distances from urban areas, where labor is
generally abundant. Remote location designations were also considered in locations where
higher equipment freight costs are typically incurred, which for example are regions not near
established rail or highway access. Remote locations related to the APC Facility include
Fairbanks, Alaska; Honolulu, Hawaii; Albuquerque, New Mexico; Cheyenne, Wyoming; and
Cayey, Puerto Rico.
Labor wage and productivity differences were handled as discussed in Section 1.5.1, taking into
consideration the amount of labor we estimated for the APC Facility.
Location adjustments were made to locations where higher cost of living levels are incurred
and/or where population density generally correlates to higher construction costs for power and
other infrastructure projects. These locations include Alaska, California, Connecticut, Delaware,
District of Columbia, Hawaii, Illinois, Maine, Maryland, Massachusetts, Michigan, Minnesota,
New York, Ohio; and Wisconsin.
Owner costs were reviewed based on the need for utility upgrades and/or infrastructure costs
such as new facility transmission lines to tie to existing utility transmission substations or
existing transmission lines.
Table 3-3 and Table 3-4 show the APC capital cost variations for alternative U.S. plant locations,
including the difference between the given location and the average location specified for the
Cost Estimate.
              TABLE 3-3 – LOCATION-BASED COSTS FOR APC (650,000 KW)
                                     (OCTOBER 1, 2010 DOLLARS)
                                          Base
                                         Project    Location      Delta Cost   Total Location
                                          Cost      Percent       Difference    Project Cost
         State                City       ($/kW)     Variation       ($/kW)         ($/kW)
  Alaska                 Anchorage        3,200           33.1%     1,058           4,258
  Alaska                 Fairbanks        3,200           32.0%     1,026           4,226
  Alabama                Huntsville       3,200           -7.5%     (239)           2,961
  Arizona                Phoenix          3,200           -5.2%     (166)           3,034
  Arkansas               Little Rock      3,200           -6.2%     (200)           3,000
  California             Los Angeles      3,200           20.3%      649            3,849
  California             Redding          3,200            9.8%      314            3,514
  California             Bakersfield      3,200            9.4%      300            3,500
  California             Sacramento       3,200           14.4%      462            3,662
  California             San Francisco    3,200           42.4%     1,356           4,556
  Colorado               Denver           3,200           -6.1%     (194)           3,006
  Connecticut            Hartford         3,200           26.6%      851            4,051
  Delaware               Dover            3,200           23.0%      736            3,936
  District of Columbia   Washington       3,200           39.6%     1,267           4,467
  Florida                Tallahassee      3,200          -10.9%     (349)           2,851
  Florida                Tampa            3,200           -4.9%     (156)           3,044
  Georgia                Atlanta          3,200           -8.1%     (260)           2,940
  Hawaii                 Honolulu         3,200           69.0%     2,210           5,410
  Idaho                  Boise            3,200           -3.7%     (118)           3,082
  Illinois               Chicago          3,200           19.8%      635            3,835
  Indiana                Indianapolis     3,200            3.2%      102            3,302


                                                   3-5
Base
                                  Project    Location      Delta Cost   Total Location
                                   Cost      Percent       Difference    Project Cost
      State           City        ($/kW)     Variation       ($/kW)         ($/kW)
Iowa             Davenport         3,200           -1.6%      (50)          3,150
Iowa             Waterloo          3,200           -9.0%     (288)          2,912
Kansas           Wichita           3,200           -7.5%     (241)          2,959
Kentucky         Louisville        3,200           -5.6%     (178)          3,022
Louisiana        New Orleans       3,200          -11.2%     (359)          2,841
Maine            Portland          3,200           -1.5%      (47)          3,153
Maryland         Baltimore         3,200            4.6%      148           3,348
Massachusetts    Boston            3,200           35.3%     1,128          4,328
Michigan         Detroit           3,200            3.8%      123           3,323
Michigan         Grand Rapids      3,200           -7.9%     (251)          2,949
Minnesota        St. Paul          3,200            3.9%      125           3,325
Mississippi      Jackson           3,200           -7.4%     (238)          2,962
Missouri         St. Louis         3,200            7.2%      231           3,431
Missouri         Kansas City       3,200            3.4%      109           3,309
Montana          Great Falls       3,200           -4.3%     (137)          3,063
Nebraska         Omaha             3,200           -3.5%     (113)          3,087
New Hampshire    Concord           3,200           -1.6%      (52)          3,148
New Jersey       Newark            3,200           15.5%      495           3,695
New Mexico       Albuquerque       3,200           -3.9%     (125)          3,075
New York         New York          3,200           32.6%     1,044          4,244
New York         Syracuse          3,200           10.7%      342           3,542
Nevada           Las Vegas         3,200            9.2%      295           3,495
North Carolina   Charlotte         3,200          -11.2%     (360)          2,840
North Dakota     Bismarck          3,200           -8.0%     (255)          2,945
Ohio             Cincinnati        3,200            0.3%       11           3,211
Oregon           Portland          3,200            9.5%      305           3,505
Pennsylvania     Philadelphia      3,200           12.1%      387           3,587
Pennsylvania     Wilkes-Barre      3,200           -3.5%     (112)          3,088
Rhode Island     Providence        3,200            4.1%      132           3,332
South Carolina   Spartanburg       3,200          -11.8%     (377)          2,823
South Dakota     Rapid City        3,200          -10.7%     (342)          2,858
Tennessee        Knoxville         3,200           -8.9%     (286)          2,914
Texas            Houston           3,200           -9.5%     (304)          2,896
Utah             Salt Lake City    3,200           -3.1%      (98)          3,102
Vermont          Burlington        3,200           -5.3%     (169)          3,031
Virginia         Alexandria        3,200            9.7%      310           3,510
Virginia         Lynchburg         3,200           -2.0%      (62)          3,138
Washington       Seattle           3,200           12.8%      409           3,609
Washington       Spokane           3,200           -2.3%      (74)          3,126
West Virginia    Charleston        3,200           -1.8%      (58)          3,142
Wisconsin        Green Bay         3,200            0.5%       16           3,216
Wyoming          Cheyenne          3,200            3.9%      125           3,325
Puerto Rico      Cayey               0              0           0             0


                                            3-6
TABLE 3-4 – LOCATION-BASED COSTS FOR APC (1,300,000 KW)
                                   (OCTOBER 1, 2010 DOLLARS)
                                        Base
                                       Project    Location      Delta Cost   Total Location
                                        Cost      Percent       Difference    Project Cost
       State                City       ($/kW)     Variation       ($/kW)         ($/kW)
Alaska                 Anchorage        2,850           36.5%     1,040          3,890
Alaska                 Fairbanks        2,850           35.3%     1,006          3,856
Alabama                Huntsville       2,850           -8.2%     (233)          2,617
Arizona                Phoenix          2,850           -5.7%     (161)          2,689
Arkansas               Little Rock      2,850           -5.9%     (169)          2,681
California             Los Angeles      2,850           22.4%      638           3,488
California             Redding          2,850           10.7%      306           3,156
California             Bakersfield      2,850           10.3%      293           3,143
California             Sacramento       2,850           15.7%      447           3,297
California             San Francisco    2,850           46.7%     1,330          4,180
Colorado               Denver           2,850           -6.6%     (188)          2,662
Connecticut            Hartford         2,850           29.4%      838           3,688
Delaware               Dover            2,850           25.5%      728           3,578
District of Columbia   Washington       2,850           44.4%     1,265          4,115
Florida                Tallahassee      2,850          -11.9%     (339)          2,511
Florida                Tampa            2,850           -5.4%     (154)          2,696
Georgia                Atlanta          2,850           -8.9%     (253)          2,597
Hawaii                 Honolulu           0              0           0             0
Idaho                  Boise            2,850           -4.0%     (115)          2,735
Illinois               Chicago          2,850           21.3%      606           3,456
Indiana                Indianapolis     2,850            3.5%       99           2,949
Iowa                   Davenport        2,850           -1.8%      (53)          2,797
Iowa                   Waterloo         2,850           -9.8%     (280)          2,570
Kansas                 Wichita          2,850           -7.3%     (209)          2,641
Kentucky               Louisville       2,850           -6.1%     (173)          2,677
Louisiana              New Orleans      2,850          -12.2%     (348)          2,502
Maine                  Portland         2,850           -0.6%      (16)          2,834
Maryland               Baltimore        2,850            5.3%      150           3,000
Massachusetts          Boston           2,850           38.7%     1,103          3,953
Michigan               Detroit          2,850            4.0%      114           2,964
Michigan               Grand Rapids     2,850           -8.6%     (244)          2,606
Minnesota              St. Paul         2,850            4.1%      116           2,966
Mississippi            Jackson          2,850           -8.1%     (231)          2,619
Missouri               St. Louis        2,850            7.7%      221           3,071
Missouri               Kansas City      2,850            3.5%      101           2,951
Montana                Great Falls      2,850           -4.7%     (133)          2,717
Nebraska               Omaha            2,850           -3.9%     (111)          2,739
New Hampshire          Concord          2,850           -1.8%      (52)          2,798
New Jersey             Newark           2,850           16.4%      467           3,317
New Mexico             Albuquerque      2,850           -4.3%     (122)          2,728
New York               New York         2,850           34.8%      992           3,842
New York               Syracuse         2,850           12.0%      341           3,191
Nevada                 Las Vegas        2,850            9.9%      282           3,132
North Carolina         Charlotte        2,850          -10.4%     (296)          2,554
North Dakota           Bismarck         2,850           -8.7%     (248)          2,602
Ohio                   Cincinnati       2,850            0.5%       13           2,863
Oregon                 Portland         2,850           10.4%      297           3,147
Pennsylvania           Philadelphia     2,850           12.9%      366           3,216
Pennsylvania           Wilkes-Barre     2,850           -3.8%     (109)          2,741


                                                 3-7
Base
                                       Project    Location         Delta Cost    Total Location
                                        Cost      Percent          Difference     Project Cost
         State             City        ($/kW)     Variation          ($/kW)          ($/kW)
  Rhode Island        Providence        2,850            4.3%          123           2,973
  South Carolina      Spartanburg       2,850          -12.7%         (363)          2,487
  South Dakota        Rapid City        2,850          -11.6%         (331)          2,519
  Tennessee           Knoxville         2,850           -9.7%         (276)          2,574
  Texas               Houston           2,850          -10.3%         (295)          2,555
  Utah                Salt Lake City    2,850           -3.3%          (93)          2,757
  Vermont             Burlington        2,850           -5.8%         (164)          2,686
  Virginia            Alexandria        2,850           10.9%          310           3,160
  Virginia            Lynchburg         2,850           -2.0%          (57)          2,793
  Washington          Seattle           2,850           13.9%          397           3,247
  Washington          Spokane           2,850           -2.6%          (73)          2,777
  West Virginia       Charleston        2,850           -2.1%          (59)          2,791
  Wisconsin           Green Bay         2,850            0.6%           16           2,866
  Wyoming             Cheyenne          2,850            4.6%          131           2,981
  Puerto Rico         Cayey               0              0               0             0

3.5 O&M ESTIMATE
In addition to the general O&M items discussed in Section 2.5.2., the APC Facility includes the
major maintenance for boiler, ST, associated generator, BOP, and emissions reduction catalysts.
These major maintenance expenses are included with the VOM expense for this technology and
are given on an average basis across the megawatt-hours (“MWh”) incurred. Typically,
significant overhauls on an APC Facility occur no less frequently than six or seven years.
Table 3-5 presents the FOM and VOM expenses for the APC Facility. Table 3-5 and Table 3-6
present the O&M expenses for the APC Facility.
                   TABLE 3-5 – O&M EXPENSES FOR APC (650,000 KW)
                        Technology:                                  APC
                    Fixed O&M Expense                           $35.97/kW-year
                   Variable O&M Expense                           $4.25/MWh
                   TABLE 3-6 – O&M EXPENSES FOR APC (1,300,000 KW)
                        Technology:                                  APC
                    Fixed O&M Expense                           $29.67/kW-year
                   Variable O&M Expense                           $4.25/MWh

3.6 ENVIRONMENTAL COMPLIANCE INFORMATION
As mentioned in Section 3.1, the APC Facility is assumed to include low NOX combustion
burners in the boiler, SCR, and a flue gas desulfurization (“FGD”) to further control the
emissions of NOX and SO2, respectively. Table 3-7 presents the environmental emissions for the
APC Facility.


                                                 3-8
TABLE 3-7 – ENVIRONMENTAL EMISSIONS FOR APC
    Technology:                APC
       NOX                0.06 lb/MMBtu
        SO2               0.1 lb/MMBtu
        CO2               206 lb/MMBtu


                    3-9
4.   ADVANCED PULVERIZED COAL WITH CCS (APC/CCS)

4.1 MECHANICAL EQUIPMENT AND SYSTEMS
The plant configuration for the APC with CCS Facility (“APC/CCS”) is the same as the APC
case with two exceptions: (1) an amine scrubbing system, utilizing monoethanolamine (“MEA”)
as a solvent, to capture CO2 from the flue gas, and (2) the scaling of the boiler to a larger size, as
described below. The captured CO2 is compressed to approximately 2,000 psia for injection into
a pipeline at the plant fence line as a supercritical fluid. The net output of the APC/CCS Facility
case is 650 MW (and 1,300 MW for the two unit configuration), and since the CCS system
requires about one-third of the given facility’s gross capacity in auxiliary load, the APC/CCS
Facility assumes that the boiler is increased by approximately one-third (i.e., it is approximately
133 percent the size of the boiler in the APC Facility), which provides the necessary steam to
facilitate the capture process and to run a steam-driven compressor for compressing the CO2 for
sequestration. Figure 4-1 presents a diagram of the APC and Figure 4-2 presents a diagram of
the APC/CCS Facility.
                          FIGURE 4-1 – APC FACILITY DIAGRAM


                                                 4-1
FIGURE 4-2 – APC/CCS FACILITY DIAGRAM


4.2 ELECTRICAL AND CONTROL SYSTEMS
The electrical and control systems for the APC/CCS Facility are materially similar to the APC
Facility.

4.3 OFF-SITE REQUIREMENTS
The off-site requirements for the APC/CCS Facility are materially similar to the APC Facility,
except that the CO2 needs sequestering in one of the following geologic formations:
(1) exhausted gas storage location, (2) unminable coal seam, (3) enhanced oil recovery, or
(4) saline aquifer. To the extent that a sequestration site is not near the given facility being
analyzed, transportation for a viable sequestration site has the potential to materially affect the
capital cost estimates discussed below.

4.4 CAPITAL COST ESTIMATE
The base Cost Estimate for the APC/CCS Facility with a nominal capacity of 650 MW is
$5,099/kW and with a nominal capacity of 1,300,000 MW is $4,579/kW. The capital cost
estimate was based on the advanced pulverized APC Facility (without CCS) and the base Cost
Estimate was increased to include the expected costs of CCS. Since there are currently no full-
scale pulverized coal facilities operating with CCS in the world, our estimate is based on industry
research. Our team tested the veracity of this research against assumptions for implementing the
additional equipment necessary to effectuate CCS on an advanced coal facility. Table 4-1 and
Table 4-2 summarize the Cost Estimate categories for the APC/CCS Facility.


                                               4-2
TABLE 4-1 – BASE PLANT SITE CAPITAL COST ESTIMATE FOR APC/CCS
                                        Technology: APC/CCS
                              Nominal Capacity (ISO): 650,000 kW
                             Nominal Heat Rate (ISO): 12,000 Btu/kWh-HHV

       Capital Cost Category                                                          (000s) (October 1, 2010$)

       Total Project EPC                                                                         2,761,958

       Owner Costs (excluding project finance)                                                    552,391

       Total Project Cost (excluding finance)                                                    3,314,350

       Total Project EPC                                                  / kW                     4,249

       Owner Costs 20% (excluding project finance)                        / kW                       850

       Total Project Cost (excluding project finance)                    / kW                      5,099

       (1)   Includes engineering, distributable costs, scaffolding, construction management, and start-up.


     TABLE 4-2 – BASE PLANT SITE CAPITAL COST ESTIMATE FOR APC/CCS
                                        Technology: APC/CCS
                              Nominal Capacity (ISO): 1,300,000 kW
                             Nominal Heat Rate (ISO): 12,000 Btu/kWh-HHV

       Capital Cost Category                                                          (000s) (October 1, 2010$)

       Total Project EPC                                                                         5,045,763

       Owner Costs (excluding project finance)                                                    908,237

       Total Project Cost (excluding finance)                                                    5,954,000

       Total Project EPC                                                  / kW                     3,881

       Owner Costs 18% (excluding project finance)                        / kW                       699

       Total Project Cost (excluding project finance)                    / kW                      4,579

       (1)   Includes engineering, distributable costs, scaffolding, construction management, and start-up.


For this type of technology and power plant configuration, our regional adjustments took into
consideration the following: outdoor installation considerations, seismic design differences,
remote location issues, labor wage and productivity differences, location adjustments, owner cost
differences, and the increase in overheads associated with these six adjustment criteria. The


                                                             4-3
methodology used for the APC/CCS Facility is the same as that discussed in Section 3.4 for the
APC Facility (without CCS).
Table 4-3 and Table 4-4 show the APC capital cost variations for alternative U.S. plant locations,
including the difference between the given location and the average location specified for the
Cost Estimate.
  TABLE 4-3– LOCATION-BASED COSTS FOR APC/CCS FACILITY (650,000 KW)
                                        (OCTOBER 1, 2010 DOLLARS)
                                             Base
                                            Project    Location     Delta Cost   Total Location
                                             Cost      Percent      Difference    Project Cost
             State               City       ($/kW)     Variation      ($/kW)         ($/kW)
  Alaska                 Anchorage           5,100          32.2%     1,643          6,743
  Alaska                 Fairbanks           5,100          31.4%     1,602          6,702
  Alabama                Huntsville          5,100          -8.0%      (409)         4,691
  Arizona                Phoenix             5,100          -5.7%      (289)         4,811
  Arkansas               Little Rock         5,100          -6.7%      (342)         4,797
  California             Los Angeles         5,100          19.6%     1,000          6,100
  California             Redding             5,100           9.4%      481           5,581
  California             Bakersfield         5,100           9.0%      458           5,558
  California             Sacramento          5,100          14.4%      734           5,834
  California             San Francisco       5,100          41.6%     2,124          7,224
  Colorado               Denver              5,100          -6.6%      (335)         4,765
  Connecticut            Hartford            5,100          25.6%     1,306          6,406
  Delaware               Dover               5,100          21.9%     1,116          6,216
  District of Columbia   Washington          5,100          37.0%     1,888          6,988
  Florida                Tallahassee         5,100      -11.6%         (591)         4,509
  Florida                Tampa               5,100       -5.1%         (262)         4,838
  Georgia                Atlanta             5,100          -8.7%      (445)         4,655
  Hawaii                 Honolulu            5,100          65.6%     3,347          8,447
  Idaho                  Boise               5,100          -4.1%      (211)         4,889
  Illinois               Chicago             5,100          20.7%     1,055          6,155
  Indiana                Indianapolis        5,100          2.8%       141           5,241
  Iowa                   Davenport           5,100          -1.7%       (85)         5,015
  Iowa                   Waterloo            5,100          -9.6%      (491)         4,609
  Kansas                 Wichita             5,100          -8.1%      (411)         4,728
  Kentucky               Louisville          5,100          -6.1%      (309)         4,791
  Louisiana              New Orleans         5,100      -11.9%         (608)         4,492
  Maine                  Portland            5,100          -2.2%      (111)         5,028
  Maryland               Baltimore           5,100          3.8%       195           5,295
  Massachusetts          Boston              5,100          34.9%     1,779          6,879
  Michigan               Detroit             5,100           4.0%       204          5,304
  Michigan               Grand Rapids        5,100          -8.4%      (428)         4,672
  Minnesota              St. Paul            5,100          4.0%       206           5,306
  Mississippi            Jackson             5,100          -8.0%      (406)         4,694
  Missouri               St. Louis           5,100          7.2%       366           5,466


                                                      4-4
Base
                                  Project    Location     Delta Cost   Total Location
                                   Cost      Percent      Difference    Project Cost
         State        City        ($/kW)     Variation      ($/kW)         ($/kW)
Missouri         Kansas City       5,100          3.4%       174           5,274
Montana          Great Falls       5,100          -4.8%      (244)         4,856
Nebraska         Omaha             5,100          -3.9%      (197)         4,903
New Hampshire    Concord           5,100          -2.0%      (100)         5,000
New Jersey       Newark            5,100          16.4%      837           5,937
New Mexico       Albuquerque       5,100          -4.4%      (222)         4,878
New York         New York          5,100          34.7%     1,768          6,868
New York         Syracuse          5,100           8.5%      433           5,533
Nevada           Las Vegas         5,100          7.5%       382           5,482
North Carolina   Charlotte         5,100      -12.0%         (612)         4,566
North Dakota     Bismarck          5,100          -8.5%      (434)         4,666
Ohio             Cincinnati        5,100          -0.3%      (13)          5,087
Oregon           Portland          5,100          9.1%       466           5,566
Pennsylvania     Philadelphia      5,100          12.7%       649          5,749
Pennsylvania     Wilkes-Barre      5,100          -3.9%      (201)         4,899
Rhode Island     Providence        5,100          4.2%       214           5,314
South Carolina   Spartanburg       5,100      -12.7%         (649)         4,451
South Dakota     Rapid City        5,100      -11.4%         (583)         4,517
Tennessee        Knoxville         5,100          -9.6%      (492)         4,608
Texas            Houston           5,100      -10.2%         (518)         4,582
Utah             Salt Lake City    5,100          -3.8%      (194)         4,906
Vermont          Burlington        5,100          -5.9%      (299)         4,801
Virginia         Alexandria        5,100           8.7%       443          5,543
Virginia         Lynchburg         5,100          -2.7%      (138)         4,962
Washington       Seattle           5,100          12.6%       644          5,744
Washington       Spokane           5,100          -2.7%      (136)         4,964
West Virginia    Charleston        5,100          -2.0%      (103)         4,997
Wisconsin        Green Bay         5,100          0.0%        0            5,100
Wyoming          Cheyenne          5,100          1.4%        74           5,174
Puerto Rico      Cayey               0            0           0              0


                                            4-5
TABLE 4-4 – LOCATION-BASED COSTS FOR APC/CCS FACILITY (1,300,000 KW)
                                      (OCTOBER 1, 2010 DOLLARS)
                                           Base
                                          Project    Location     Delta Cost   Total Location
                                           Cost      Percent      Difference    Project Cost
           State               City       ($/kW)     Variation      ($/kW)         ($/kW)
Alaska                 Anchorage           4,580          35.2%     1,610          6,190
Alaska                 Fairbanks           4,580          34.2%     1,565          6,145
Alabama                Huntsville          4,580          -8.3%      (380)         4,200
Arizona                Phoenix             4,580          -5.8%      (266)         4,314
Arkansas               Little Rock         4,580          -6.1%      (278)         4,302
California             Los Angeles         4,580          21.5%      985           5,565
California             Redding             4,580          10.4%      475           5,055
California             Bakersfield         4,580           9.9%      453           5,033
California             Sacramento          4,580          15.5%      710           5,290
California             San Francisco       4,580          45.2%     2,071          6,651
Colorado               Denver              4,580          -6.7%      (309)         4,271
Connecticut            Hartford            4,580          28.1%     1,288          5,868
Delaware               Dover               4,580          24.2%     1,109          5,689
District of Columbia   Washington          4,580          41.4%     1,895          6,475
Florida                Tallahassee         4,580      -12.1%         (552)         4,028
Florida                Tampa               4,580       -5.4%         (245)         4,335
Georgia                Atlanta             4,580          -9.0%      (413)         4,167
Hawaii                 Honolulu              0            0           0              0
Idaho                  Boise               4,580          -4.2%      (191)         4,389
Illinois               Chicago             4,580          21.7%      995           5,575
Indiana                Indianapolis        4,580          3.2%       148           4,728
Iowa                   Davenport           4,580       -1.7%          (79)         4,501
Iowa                   Waterloo            4,580      -10.0%         (457)         4,123
Kansas                 Wichita             4,580          -7.5%      (343)         4,237
Kentucky               Louisville          4,580          -6.2%      (284)         4,296
Louisiana              New Orleans         4,580      -12.4%         (567)         4,013
Maine                  Portland            4,580          -1.1%      (48)          4,532
Maryland               Baltimore           4,580          4.6%       211           4,791
Massachusetts          Boston              4,580          37.7%     1,728          6,308
Michigan               Detroit             4,580           4.2%       193          4,773
Michigan               Grand Rapids        4,580          -8.7%      (398)         4,182
Minnesota              St. Paul            4,580          4.3%       195           4,775
Mississippi            Jackson             4,580          -8.2%      (377)         4,203
Missouri               St. Louis           4,580          7.7%       354           4,934
Missouri               Kansas City         4,580          3.7%       168           4,748
Montana                Great Falls         4,580          -4.8%      (222)         4,358
Nebraska               Omaha               4,580          -3.9%      (180)         4,400
New Hampshire          Concord             4,580          -1.9%      (87)          4,493
New Jersey             Newark              4,580          17.1%      781           5,361


                                                    4-6
Base
                                        Project    Location        Delta Cost    Total Location
                                         Cost      Percent         Difference     Project Cost
           State            City        ($/kW)     Variation         ($/kW)          ($/kW)
  New Mexico           Albuquerque       4,580          -4.4%         (202)          4,378
  New York             New York          4,580          36.0%        1,650           6,230
  New York             Syracuse          4,580           9.7%         442            5,022
  Nevada               Las Vegas         4,580          7.9%          361            4,941
  North Carolina       Charlotte         4,580      -10.7%            (492)          4,088
  North Dakota         Bismarck          4,580          -8.8%         (404)          4,176
  Ohio                 Cincinnati        4,580          0.1%           4             4,584
  Oregon               Portland          4,580          10.1%         461            5,041
  Pennsylvania         Philadelphia      4,580          13.3%          609           5,189
  Pennsylvania         Wilkes-Barre      4,580          -4.0%         (182)          4,398
  Rhode Island         Providence        4,580          4.5%          205            4,785
  South Carolina       Spartanburg       4,580      -13.1%            (600)          3,980
  South Dakota         Rapid City        4,580      -11.8%            (542)          4,038
  Tennessee            Knoxville         4,580          -9.9%         (455)          4,125
  Texas                Houston           4,580      -10.5%            (482)          4,098
  Utah                 Salt Lake City    4,580          -3.6%         (167)          4,413
  Vermont              Burlington        4,580          -6.0%         (273)          4,307
  Virginia             Alexandria        4,580           9.9%          455           5,035
  Virginia             Lynchburg         4,580          -2.4%         (112)          4,468
  Washington           Seattle           4,580          13.7%          626           5,206
  Washington           Spokane           4,580          -2.6%         (121)          4,459
  West Virginia        Charleston        4,580          -2.0%         (93)           4,487
  Wisconsin            Green Bay         4,580          0.3%           14            4,594
  Wyoming              Cheyenne          4,580          2.2%          102            4,682
  Puerto Rico          Cayey               0            0              0               0

4.5 O&M ESTIMATE
The O&M items for the APC/CCS Facility are the same as those discussed in Section 3.5 for the
APC Facility (without CCS), except that adders are included to both FOM and VOM to
accommodate the expenses associated with compressor maintenance, sequestration maintenance,
and the associated additional labor required to manage, operate, and maintain the additional
equipment. Table 4-5 and Table 4-6 present the FOM and VOM expenses for the APC/CCS
Facility.
                   TABLE 4-5 – O&M EXPENSES FOR APC/CCS (650,000 KW)
                         Technology:                               APC/CCS
                     Fixed O&M Expense                          $76.62/kW-year
                    Variable O&M Expense                          $9.05/MWh


                                                  4-7
TABLE 4-6 – O&M EXPENSES FOR APC/CCS (1,300,000 KW)
                    Technology:                           APC/CCS
                Fixed O&M Expense                      $63.21/kW-year
               Variable O&M Expense                      $9.05/MWh

4.6 ENVIRONMENTAL COMPLIANCE INFORMATION
In addition to the equipment utilized for environmental compliance in the APC Facility, the
APC/CCS Facility includes an amine scrubber that is intended to remove 90 percent of the CO2
produced in the combustion process, wherein the captured CO2 is later compressed to HP and
sequestered, as discussed above. Table 4-7 presents the environmental emissions for the
APC/CCS Facility.
             TABLE 4-7 – ENVIRONMENTAL EMISSIONS FOR APC/CCS
                     Technology:                    APC/CCS
                        NOX                       0.06 lb/MMBtu
                         SO2                      0.02 lb/MMBtu
                         CO2                      20.6 lb/MMBtu


                                            4-8
5.   CONVENTIONAL NATURAL GAS COMBINED CYCLE (NGCC)
5.1 MECHANICAL EQUIPMENT AND SYSTEMS
The Conventional NGCC produces 540 MW of net electricity. The facility utilizes two natural
gas-fueled F-class CTs and associated electric generators, two supplemental-fired heat recovery
steam generators (“HRSG”), and one condensing ST and associated electric generator operating
in combined-cycle mode. Each CT is designed to produce nominally 172 MW and includes a
dry-low NOX (“DLN”) combustion system and a hydrogen-cooled electric generator. The two
triple-pressure HRSGs include integrated deaerators, SCRs, oxidation catalyst for the control of
carbon monoxide (“CO”), and supplemental duct firing with associated combustion
management. The ST is a single-reheat condensing ST designed for variable pressure operation,
designed to produce an additional 210 MW. The ST exhaust is cooled in a closed-loop
condenser system with a mechanical draft cooling tower. The CTs are equipped with inlet
evaporative coolers to reduce the temperature of the turbine inlet air to increase summer output.
The Conventional NGCC plant also includes a raw water treatment system consisting of
clarifiers and filters and a turbine hall, in which the CTs, ST, and HRSGs are enclosed to avoid
freezing during periods of cold ambient temperatures. Figure 5-1 presents the Conventional
NGCC process flow diagram.


                                              5-1
FIGURE 5-1 – CONVENTIONAL NGCC DESIGN CONFIGURATION


5.2 ELECTRICAL AND CONTROL SYSTEMS
The Conventional NGCC has two CT electric generators and one ST electric generator. The
generators for the CTs are 60 Hz and rated at approximately 215 MVA with an output voltage of
18 kV. The ST electric generator is 60 Hz and rated at approximately 310 MVA with an output
voltage of 18 kV. Each CT and ST electric generator is connected to a high-voltage bus in the
Conventional NGCC via a dedicated generator circuit breaker, generator GSU, and a disconnect
switch. The GSUs increase the voltage from the electric generators from 18 kV to
interconnected high voltage.
The Conventional NGCC is controlled using a DCS. The DCS provides centralized control of
the facility by integrating the control systems provided with each individual CT and associated
electric generator, ST and associated electric generator, and the control of BOP systems and
equipment.

5.3 OFF-SITE REQUIREMENTS
Natural gas is delivered to the facility through a lateral connected to the local natural gas trunk
line. Water for all processes at the Conventional NGCC Facility is obtained from a one of
several available water sources (e.g., municipal water supply). The Conventional NGCC Facility


                                               5-2
uses a water treatment system and a high-efficiency reverse osmosis system to reduce the
dissolved solids from the cooling water and to provide distilled water for HRSG makeup.
Wastewater is sent to a municipal wastewater system. Further, the electrical interconnection
from the Conventional NGCC on-site switchyard is effectuated by a connection to an adjacent
utility substation.

5.4 CAPITAL COST ESTIMATE
The base Cost Estimate for the Conventional NGCC Facility with a nominal capacity of
540 MW is $980/kW. Table 5-1 summarizes the Cost Estimate categories for the Conventional
NGCC Facility.
TABLE 5-1 – BASE PLANT SITE CAPITAL COST ESTIMATE FOR CONVENTIONAL
                                 NGCC
                                       Technology: Conventional NGCC
                             Nominal Capacity (ISO): 540,000 kW
                            Nominal Heat Rate (ISO): 7,050 Btu/kWh-HHV

       Capital Cost Category                                                         (000s) (October 1, 2010$)

       Civil Structural Material and Installation                                                40,100

       Mechanical Equipment Supply and
       Installation                                                                             221,500

       Electrical / I&C Supply and Installation                                                  35,000

       Project Indirects (1)                                                                     88,400

       EPC Cost before Contingency and Fee                                                      385,000

       Fee and Contingency                                                                       55,000

       Total Project EPC                                                                        440,000

       Owner Costs (excluding project finance)                                                   88,000

       Total Project Cost (excluding finance)                                                   528,000

       Total Project EPC                                                / kW                       815

       Owner Costs 20% (excluding project finance)                      / kW                       163

       Total Project Cost (excluding project finance)                   / kW                       978

       (1) Includes engineering, distributable costs, scaffolding, construction management, and start-up.


                                                            5-3
For this type of technology and power plant configuration, our regional adjustments took into
consideration the following:      outdoor installation considerations, air-cooled condensers
compared to cooling towers, seismic design differences, zero-water discharge issues, local
technical enhancements (e.g., additional noise remediation that is generally required in urban
siting), remote location issues, urban – high density population issues, labor wage and
productivity differences, location adjustments, owner cost differences, and the increase in
overheads associated with these 10 adjustments.
Outdoor installation locations are considered in geographic areas where enclosed structures for
the boilers would not be required due to the low probability of freezing. The locations that were
included in outdoor installation are Alabama, Arizona, Arkansas, Florida, Georgia, Hawaii,
Louisiana, Mississippi, New Mexico, South Carolina, and Puerto Rico.
The potential locations relating to the use of air-cooled condensers in place of mechanical draft
wet cooling towers were identified as Arizona, California, Connecticut, Delaware, District of
Columbia, Maryland, Massachusetts, New Hampshire, New York, Oregon, Pennsylvania, Rhode
Island, Virginia, and Puerto Rico. These locations are identified as those where conservation of
water, notwithstanding supply, has been and/or is becoming a significant issue in plant
permitting/siting.
Seismic design differences among the various locations were based on U.S. seismic map
information that detailed the various seismic zones throughout the U.S. No cost increases were
associated with seismic Zone 0 and cost step increases were considered for Zones 1, 2, 3 and 4.
The potential locations relating to the need of zero-water discharge were identified as Arizona,
California, Colorado, Connecticut, Delaware, District of Columbia, Maryland, Massachusetts,
New Hampshire, New York, Rhode Island, Virginia, and Puerto Rico. Similar to water usage
discussed above in this section on Conventional NGCC, wastewater treatment and disposal is
considered a critical permitting/siting issue in these areas.
The locations with local technical enhancements include California, Colorado, Connecticut,
Delaware, District of Columbia, Louisiana, Maryland, Massachusetts, New Jersey, New York,
Rhode Island, Vermont, and Virginia. These areas are places where noise, visual impacts, and
other technical enhancements generally need to be made by a project developer or utility to
comply with the applicable permitting/siting requirements.
Remote location issues are related to geographic areas that typically require installation of man
camps, higher craft incentives, and higher per diems are generally required with respect to
construction, due to the fact that such areas are long distances from urban areas, where labor is
generally abundant. Remote location designations were also considered in locations where
higher equipment freight costs are typically incurred, which for example are regions not near
established rail or highway access. Remote locations related to the Conventional NGCC include
Fairbanks, Alaska; Honolulu, Hawaii; Albuquerque, New Mexico; Cheyenne, Wyoming; and
Cayey, Puerto Rico.
Labor wage and productivity differences were handled as discussed in Section 2.5.1., taking into
consideration the amount of labor we estimated for the Conventional NGCC Facility.
Location adjustments were made to locations where higher cost of living levels are incurred
and/or where population density generally correlates to higher construction costs for power and
other infrastructure projects. These locations include Alaska, California, Connecticut, Delaware,


                                              5-4
District of Columbia, Hawaii, Illinois, Maine, Maryland, Massachusetts, Michigan, Minnesota,
New York, Ohio, and Wisconsin.
Owner costs were reviewed based on the need for utility upgrades and/or infrastructure costs
such as new facility transmission lines to tie to existing utility transmission substations or
existing transmission lines.
Table 5-2 presents the Conventional NGCC capital cost variations for alternative U.S. plant
locations, including the difference between the given location and the average location specified
for the Cost Estimate.
             TABLE 5-2 – LOCATION-BASED COSTS FOR CONVENTIONAL NGCC
                                        (OCTOBER 1, 2010 DOLLARS)
                                             Base
                                            Project    Location     Delta Cost   Total Location
                                             Cost      Percent      Difference    Project Cost
             State               City       ($/kW)     Variation      ($/kW)         ($/kW)
  Alaska                 Anchorage            980           33.3%      326           1,306
  Alaska                 Fairbanks            980           38.2%      374           1,354
  Alabama                Huntsville           980           -8.6%      (84)           896
  Arizona                Phoenix              980           2.6%        25           1,005
  Arkansas               Little Rock          980           -7.5%      (73)           912
  California             Los Angeles          980           29.0%      284           1,264
  California             Redding              980           13.5%      132           1,112
  California             Bakersfield          980           15.8%      154           1,134
  California             Sacramento           980           20.5%      200           1,180
  California             San Francisco        980           46.1%      452           1,432
  Colorado               Denver               980           2.1%        21           1,001
  Connecticut            Hartford             980           27.9%      274           1,254
  Delaware               Dover                980           26.2%      256           1,236
  District of Columbia   Washington           980           33.3%      326           1,306
  Florida                Tallahassee          980       -11.6%         (113)          867
  Florida                Tampa                980        -6.0%          (58)          922
  Georgia                Atlanta              980           -6.6%      (64)           916
  Hawaii                 Honolulu             980           50.2%      492           1,472
  Idaho                  Boise                980           -3.9%      (38)           942
  Illinois               Chicago              980           16.7%      163           1,143
  Indiana                Indianapolis         980           0.9%        9             989
  Iowa                   Davenport            980            0.5%       5             985
  Iowa                   Waterloo             980           -6.4%      (63)           917
  Kansas                 Wichita              980           -5.0%      (49)           936
  Kentucky               Louisville           980           -5.4%      (53)           927
  Louisiana              New Orleans          980           -5.2%      (51)           929
  Maine                  Portland             980           -3.4%      (33)           952
  Maryland               Baltimore            980           20.4%      200           1,180
  Massachusetts          Boston               980           40.0%      392           1,372
  Michigan               Detroit              980           5.3%        52           1,032


                                                      5-5
Base
                                     Project    Location     Delta Cost    Total Location
                                      Cost      Percent      Difference     Project Cost
           State          City       ($/kW)     Variation      ($/kW)          ($/kW)
  Michigan          Grand Rapids       980           -5.3%      (52)            928
  Minnesota         St. Paul           980           4.5%        44             1,024
  Mississippi       Jackson            980           -8.6%      (84)            896
  Missouri          St. Louis          980           5.6%        55             1,035
  Missouri          Kansas City        980           2.7%        27             1,007
  Montana           Great Falls        980           -2.4%      (24)            956
  Nebraska          Omaha              980           -1.5%      (15)            965
  New Hampshire     Concord            980           7.3%        72             1,052
  New Jersey        Newark             980           22.1%      217             1,197
  New Mexico        Albuquerque        980           -2.4%      (24)            956
  New York          New York           980           68.4%      670             1,650
  New York          Syracuse           980           16.3%      160             1,140
  Nevada            Las Vegas          980           6.2%        61             1,041
  North Carolina    Charlotte          980       -10.5%         (102)           888
  North Dakota      Bismarck           980           -5.4%      (53)            927
  Ohio              Cincinnati         980           -1.7%      (17)            963
  Oregon            Portland           980           13.2%      130             1,110
  Pennsylvania      Philadelphia       980           26.1%      255             1,235
  Pennsylvania      Wilkes-Barre       980           -1.7%      (17)             963
  Rhode Island      Providence         980           22.0%      215             1,195
  South Carolina    Spartanburg        980       -12.8%         (126)           854
  South Dakota      Rapid City         980           -8.0%      (78)            902
  Tennessee         Knoxville          980           -8.5%      (84)            896
  Texas             Houston            980           -8.8%      (87)            893
  Utah              Salt Lake City     980           -4.0%      (39)            941
  Vermont           Burlington         980           -0.1%       (1)            979
  Virginia          Alexandria         980           16.0%      157             1,137
  Virginia          Lynchburg          980           -5.8%      (57)             923
  Washington        Seattle            980            7.0%       68             1,048
  Washington        Spokane            980           -2.6%      (25)             955
  West Virginia     Charleston         980           0.1%        1              981
  Wisconsin         Green Bay          980           -1.3%      (13)            967
  Wyoming           Cheyenne           980           -0.5%       (4)            976
  Puerto Rico       Cayey              980           10.9%      106             1,086

5.5 O&M ESTIMATE
In addition to the general O&M items discussed in Section 2.5.2., the Conventional NGCC
Facility includes the major maintenance for the CTs, as well as the BOP, including the ST,
associated electric generators, HRSGs, and emissions reduction catalysts. These major
maintenance expenses are included with the VOM expense for this technology and are given on
an average basis across the MWhs incurred. Typically, significant overhauls on a Conventional


                                               5-6
NGCC Facility occur no less frequently than 24,000 operating hour intervals. Table 5-3 presents
the O&M expenses for the Conventional NGCC Facility.
             TABLE 5-3 – O&M EXPENSES FOR CONVENTIONAL NGCC
                     Technology:                      Conventional NGCC
                 Fixed O&M Expense                      $14.39/kW-year
                Variable O&M Expense                      $3.43/MWh

5.6 ENVIRONMENTAL COMPLIANCE INFORMATION
The Conventional NGCC utilizes DLN combustion systems in the primary combustion zone of
the CT and best available burner technology with respect to the duct burners in the HRSGs to
manage the production of NOX and CO. Additional control of NOX and CO is accomplished
through an SCR and an oxidization catalyst, respectively. Oxides of sulfur in the Conventional
NGCC are managed through the natural gas fuel quality, which is generally very low in sulfur
U.S. domestic pipeline quality natural gas, and consequently the low sulfur content translates
into SO2 after combustion. The Conventional NGCC does not include any control devices for
CO2, which is proportional the heat rate (inversely proportional to the efficiency) of the
technology. Water, wastewater, and solid waste compliance are achieved through traditional on-
site and off-site methods, and the costs for such compliance are included in the O&M estimate
for the Conventional NGCC Facility. Table 5-4 presents environmental emissions for the
Conventional NGCC Facility.
    TABLE 5-4 – ENVIRONMENTAL EMISSIONS FOR CONVENTIONAL NGCC
                      Technology:             Conventional NGCC
                         NOX                   0.0075 lb/MMBtu
                         SO2                    0.001 lb/MMBtu
                         CO2                     117 lb/MMBtu


                                             5-7
6.   ADVANCED GENERATION NATURAL GAS COMBINED CYCLE (AG-NGCC)
6.1 MECHANICAL EQUIPMENT AND SYSTEMS
The Advanced Generation (“AG”)-NGCC design is the same as the Conventional NGCC, except
an H-class CT is utilized in lieu of F-class, and there is only one CT/HRSG supporting the ST
included. Since the H-class CT design employees steam cooling of both stationary and rotational
hot parts, the HRSG systems and the ST are both considered “advanced” designs, as compared to
the Conventional NGCC. The net output of the AG-NGCC is 400 MW. Figure 6-1 presents the
AG-NGCC process flow diagram.
                  FIGURE 6-1 – AG-NGCC DESIGN CONFIGURATION


6.2 ELECTRICAL AND CONTROL SYSTEMS
The AG-NGCC electrical and control systems are similar to the Conventional NGCC Facility,
except that the sizing of the generators and transformers are larger to support the larger CT and
ST equipment utilized in the AG-NGCC.

6.3 OFF-SITE REQUIREMENTS
The off-site requirements for the AG-NGCC Facility are the same as the Conventional NGCC.
Refer to Section 5.3 for the description of the Conventional NGCC off-site requirements.

6.4 CAPITAL COST ESTIMATE
The base Cost Estimate for the AG-NGCC Facility with a nominal capacity of 400 MW is
$1,003/kW. Table 6-1 summarizes the Cost Estimate categories for the Conventional NGCC
Facility.


                                              6-1
TABLE 6-1 – BASE PLANT SITE CAPITAL COST ESTIMATE FOR AG-NGCC
                                       Technology: AG-NGCC
                             Nominal Capacity (ISO): 400,000 kW
                            Nominal Heat Rate (ISO): 6,430 Btu/kWh-HHV

      Capital Cost Category                                                           (000s) (October 1, 2010$)

      Civil Structural Material and Installation                                                   20,610

      Mechanical Equipment Supply and
      Installation                                                                                178,650

      Electrical / I&C Supply and Installation                                                     24,800

      Project Indirects (1)                                                                        68,300

      EPC Cost before Contingency and Fee                                                         292,360

      Fee and Contingency                                                                          42,000

      Total Project EPC                                                                           334,360

      Owner Costs (excluding project finance)                                                      66,872

      Total Project Cost (excluding finance)                                                      401,232

      Total Project EPC                                                  / kW                        836

      Owner Costs 20% (excluding project finance)                        / kW                        167

      Total Project Cost (excluding project finance)                    / kW                        1,003

      (1)   Includes engineering, distributable costs, scaffolding, construction management, and start-up.


The locational adjustments for the AG-NGCC Facility similar to those made for the
Conventional NGCC Facility.
Table 6-2 presents the AG-NGCC Facility capital cost variations for alternative U.S. plant
locations, including the difference between the given location and the average location specified
for the Cost Estimate.


                                                              6-2
TABLE 6-2 – LOCATION-BASED COSTS FOR AG-NGCC
                                      (OCTOBER 1, 2010 DOLLARS)
                                           Base
                                          Project    Location     Delta Cost   Total Location
                                           Cost      Percent      Difference    Project Cost
           State               City       ($/kW)     Variation      ($/kW)         ($/kW)
Alaska                 Anchorage           1,005          32.4%      325           1,330
Alaska                 Fairbanks           1,005          37.2%      374           1,379
Alabama                Huntsville          1,005          -8.3%      (84)           921
Arizona                Phoenix             1,005          2.6%        26           1,031
Arkansas               Little Rock         1,005          -6.7%      (67)           938
California             Los Angeles         1,005          28.2%      283           1,288
California             Redding             1,005          13.1%      132           1,137
California             Bakersfield         1,005          15.4%      154           1,159
California             Sacramento          1,005          19.9%      200           1,205
California             San Francisco       1,005          44.9%      451           1,456
Colorado               Denver              1,005          2.1%        21           1,026
Connecticut            Hartford            1,005          27.2%      273           1,278
Delaware               Dover               1,005          25.5%      256           1,261
District of Columbia   Washington          1,005          32.5%      326           1,331
Florida                Tallahassee         1,005      -11.2%         (113)          892
Florida                Tampa               1,005       -5.8%          (58)          947
Georgia                Atlanta             1,005          -6.3%      (64)           941
Hawaii                 Honolulu            1,005          48.9%      492           1,497
Idaho                  Boise               1,005          -3.7%      (38)           967
Illinois               Chicago             1,005          16.1%      162           1,167
Indiana                Indianapolis        1,005          0.9%        9            1,014
Iowa                   Davenport           1,005           0.5%       5            1,010
Iowa                   Waterloo            1,005          -6.2%      (62)           943
Kansas                 Wichita             1,005          -4.3%      (43)           962
Kentucky               Louisville          1,005          -5.2%      (52)           953
Louisiana              New Orleans         1,005          -5.0%      (50)           955
Maine                  Portland            1,005          -2.7%      (27)           978
Maryland               Baltimore           1,005          19.9%      200           1,205
Massachusetts          Boston              1,005          38.9%      391           1,396
Michigan               Detroit             1,005           5.2%       52           1,057
Michigan               Grand Rapids        1,005          -5.1%      (51)           954
Minnesota              St. Paul            1,005          4.4%        44           1,049
Mississippi            Jackson             1,005          -8.3%      (83)           922
Missouri               St. Louis           1,005          5.4%        54           1,059
Missouri               Kansas City         1,005          2.6%        26           1,031
Montana                Great Falls         1,005          -2.3%      (24)           981
Nebraska               Omaha               1,005          -1.4%      (14)           991
New Hampshire          Concord             1,005          7.2%        72           1,077
New Jersey             Newark              1,005          21.4%      215           1,220
New Mexico             Albuquerque         1,005          -2.3%      (23)           982


                                                    6-3
Base
                                       Project    Location        Delta Cost    Total Location
                                        Cost      Percent         Difference     Project Cost
           State           City        ($/kW)     Variation         ($/kW)          ($/kW)
  New York            New York          1,005          66.4%         667            1,672
  New York            Syracuse          1,005          15.9%         160            1,165
  Nevada              Las Vegas         1,005          6.0%           61            1,066
  North Carolina      Charlotte         1,005          -9.1%         (91)            914
  North Dakota        Bismarck          1,005          -5.2%         (52)            953
  Ohio                Cincinnati        1,005          -1.6%         (16)            989
  Oregon              Portland          1,005          12.9%         130            1,135
  Pennsylvania        Philadelphia      1,005          25.3%         254            1,259
  Pennsylvania        Wilkes-Barre      1,005          -1.6%         (16)            989
  Rhode Island        Providence        1,005          21.4%         215            1,220
  South Carolina      Spartanburg       1,005      -12.4%            (125)           880
  South Dakota        Rapid City        1,005          -7.7%         (77)            928
  Tennessee           Knoxville         1,005          -8.2%         (83)            922
  Texas               Houston           1,005          -8.5%         (86)            919
  Utah                Salt Lake City    1,005          -3.8%         (38)            967
  Vermont             Burlington        1,005          0.0%           (0)           1,005
  Virginia            Alexandria        1,005          15.6%         157            1,162
  Virginia            Lynchburg         1,005          -5.6%         (56)            949
  Washington          Seattle           1,005           6.8%          68            1,073
  Washington          Spokane           1,005          -2.5%         (25)            980
  West Virginia       Charleston        1,005          0.1%           1             1,006
  Wisconsin           Green Bay         1,005          -1.3%         (13)            992
  Wyoming             Cheyenne          1,005          -0.4%          (4)           1,001
  Puerto Rico         Cayey             1,005          10.6%         107            1,112

6.5 O&M ESTIMATE
The O&M items for the AG-NGCC Facility are the same as those described in Section 5.5 for
the Conventional NGCC Facility. Table 6-3 presents the O&M expenses for the AG-NGCC
Facility.
                       TABLE 6-3 – O&M EXPENSES FOR AG-NGCC
                        Technology:                              AG-NGCC
                    Fixed O&M Expense                          $14.62/kW-year
                   Variable O&M Expense                          $3.11/MWh

6.6 ENVIRONMENTAL COMPLIANCE INFORMATION
The environmental compliance strategy and equipment for the AG-NGCC Facility is the same as
those described in Section 5.6 for the Conventional NGCC Facility. Table 6-4 presents
environmental emissions for the AG-NGCC Facility.


                                                 6-4
TABLE 6-4 – ENVIRONMENTAL EMISSIONS FOR AG-NGCC
      Technology:           AG-NGCC
         NOX            0.0075 lb/MMBtu
          SO2            0.001 lb/MMBtu
          CO2             117 lb/MMBtu


                      6-5
7.   ADVANCED GENERATION NATURAL GAS COMBINED CYCLE WITH CCS
     (AG-NGCC/CCS)
7.1 MECHANICAL EQUIPMENT AND SYSTEMS
The plant configuration for the AG-NGCC/CCS Facility is the same as the AG-NGCC Facility
with the exception that an amine system based on MEA as the solvent is included for CO2
capture from the flue gas. The captured CO2 is compressed to approximately 2,000 psia for
injection into a pipeline at the plant fence line. Figure 7-1 presents the AG-NGCC with CCS
process flow diagram.
            FIGURE 7-1 – AG-NGCC WITH CCS DESIGN CONFIGURATION


7.2 ELECTRICAL AND CONTROL SYSTEMS
The electrical and control systems for the AG-NGCC/CCS Facility are materially similar to the
AG-NGCC Facility described in Section 6.2.

7.3 OFF-SITE REQUIREMENTS
The off-site requirements for the AG-NGCC/CCS Facility are materially similar to the
AG-NGCC Facility, except that the CO2 needs sequestering in one of the following geologic
formations: (1) exhausted gas storage location, (2) unminable coal seam, (3) enhanced oil
recovery, or (4) saline aquifer. To the extent that a sequestration site is not near the given facility
being analyzed, transportation for a viable sequestration site has the potential to materially affect
the capital cost estimates discussed below.

7.4 CAPITAL COST ESTIMATE
The base Cost Estimate for the AG-NGCC/CCS Facility with a nominal capacity of 340 MW is
$2,060/kW. The capital cost estimate was based on the AG-NGCC (without CCS) and the base
cost estimate was increased to include the expected costs of CCS. Table 7-1 summarizes the
Cost Estimate categories for the AG-NGCC/CCS Facility.


                                                 7-1
TABLE 7-1 – BASE PLANT SITE CAPITAL COST ESTIMATE FOR AG-NGCC/CCS
                                 COST
                                       Technology: AG-NGCC/CCS
                             Nominal Capacity (ISO): 340,000 kW
                            Nominal Heat Rate (ISO): 7,525 Btu/kWh-HHV

      Total Project EPC                                                                           583,667

      Owner Costs (excluding project finance)                                                     116,733

      Total Project Cost (excluding finance)                                                      700,400

      Total Project EPC                                                 / kW                       1,717

      Owner Costs 20% (excluding project finance)                       / kW                         343

      Total Project Cost (excluding project finance)                    / kW                       2,060

      (1)   Includes engineering, distributable costs, scaffolding, construction management, and start-up.


The locational adjustments for the AG-NGCC/CCS Facility are similar to those made for the
Conventional NGCC Facility, described in Section 5.4.
Table 7-2 presents the AG-NGCC/CCS Facility capital cost variations for alternative U.S. plant
locations, including the difference between the given location and the average location specified
for the Cost Estimate.


                                                             7-2
TABLE 7-2 – LOCATION-BASED COSTS FOR AG-NGCC/CCS
                                       (OCTOBER 1, 2010 DOLLARS)
                                            Base
                                           Project    Location     Delta Cost   Total Location
                                            Cost      Percent      Difference    Project Cost
           State                City       ($/kW)     Variation      ($/kW)         ($/kW)
Alaska                  Anchorage           2,060          20.8%      428           2,488
Alaska                  Fairbanks           2,060          23.7%      488           2,548
Alabama                 Huntsville          2,060          -8.5%      (174)         1,886
Arizona                 Phoenix             2,060          -2.3%      (47)          2,013
Arkansas                Little Rock         2,060          -7.0%      (143)         1,917
California              Los Angeles         2,060          16.1%      331           2,391
California              Redding             2,060           7.4%      152           2,212
California              Bakersfield         2,060           8.2%      169           2,229
California              Sacramento          2,060          13.3%      274           2,334
California              San Francisco       2,060          29.8%      615           2,675
Colorado                Denver              2,060          -2.9%      (60)          2,000
Connecticut             Hartford            2,060          15.9%      328           2,388
Delaware                Dover               2,060          13.5%      278           2,338
District of Columbia    Washington          2,060          14.8%      305           2,365
Florida                 Tallahassee         2,060      -11.4%         (234)         1,826
Florida                 Tampa               2,060       -5.3%         (108)         1,952
Georgia                 Atlanta             2,060          -7.9%      (162)         1,898
Hawaii                  Honolulu            2,060          26.8%      551           2,611
Idaho                   Boise               2,060          -4.9%      (100)         1,960
Illinois                Chicago             2,060          16.9%      348           2,408
Indiana                 Indianapolis        2,060          -0.5%      (11)          2,049
Iowa                    Davenport           2,060          -0.6%       (13)         2,047
Iowa                    Waterloo            2,060          -8.2%      (168)         1,892
Kansas                  Wichita             2,060          -6.4%      (132)         1,928
Kentucky                Louisville          2,060          -6.2%      (127)         1,933
Louisiana               New Orleans         2,060          -8.5%      (175)         1,885
Maine                   Portland            2,060          -4.9%      (102)         1,958
Maryland                Baltimore           2,060          7.3%       150           2,210
Massachusetts           Boston              2,060          26.6%      547           2,607
Michigan                Detroit             2,060           4.3%        88          2,148
Michigan                Grand Rapids        2,060          -7.0%      (144)         1,916
Minnesota               St. Paul            2,060          3.7%        76           2,136
Mississippi             Jackson             2,060          -8.4%      (173)         1,887
Missouri                St. Louis           2,060          4.4%        91           2,151
Missouri                Kansas City         2,060          2.3%        47           2,107
Montana                 Great Falls         2,060          -4.5%      (93)          1,967
Nebraska                Omaha               2,060          -3.2%      (65)          1,995
New Hampshire           Concord             2,060          1.6%        34           2,094
New Jersey              Newark              2,060          18.8%      388           2,448
New Mexico              Albuquerque         2,060          -4.2%      (86)          1,974


                                                     7-3
Base
                                       Project    Location        Delta Cost    Total Location
                                        Cost      Percent         Difference     Project Cost
           State           City        ($/kW)     Variation         ($/kW)          ($/kW)
  New York            New York          2,060          50.1%        1,032           3,092
  New York            Syracuse          2,060           6.4%         133            2,193
  Nevada              Las Vegas         2,060          6.1%          126            2,186
  North Carolina      Charlotte         2,060      -10.8%            (223)          1,837
  North Dakota        Bismarck          2,060          -7.1%         (146)          1,914
  Ohio                Cincinnati        2,060          -3.4%         (70)           1,990
  Oregon              Portland          2,060          7.1%          146            2,206
  Pennsylvania        Philadelphia      2,060          18.3%         378            2,438
  Pennsylvania        Wilkes-Barre      2,060          -3.7%         (77)           1,983
  Rhode Island        Providence        2,060          11.9%         244            2,304
  South Carolina      Spartanburg       2,060      -13.4%            (275)          1,785
  South Dakota        Rapid City        2,060          -9.8%         (203)          1,857
  Tennessee           Knoxville         2,060          -9.6%         (197)          1,863
  Texas               Houston           2,060          -9.6%         (198)          1,862
  Utah                Salt Lake City    2,060          -5.9%         (123)          1,937
  Vermont             Burlington        2,060          -4.0%         (81)           1,979
  Virginia            Alexandria        2,060           5.7%          118           2,178
  Virginia            Lynchburg         2,060          -6.6%         (137)          1,923
  Washington          Seattle           2,060           6.0%         123            2,183
  Washington          Spokane           2,060          -3.5%         (71)           1,989
  West Virginia       Charleston        2,060          -1.4%         (30)           2,030
  Wisconsin           Green Bay         2,060          -2.7%         (55)           2,005
  Wyoming             Cheyenne          2,060          -4.5%         (92)           1,968
  Puerto Rico         Cayey             2,060          1.7%           34            2,094

7.5 O&M ESTIMATE
The O&M items for the AG-NGCC/CCS Facility are the same as those set forth in Section 6.5
for the AG-NGCC Facility, except that adders are included to both FOM and VOM to
accommodate the expenses associated with compressor maintenance, sequestration maintenance,
and the associated additional labor required to manage, operate, and maintain the additional
equipment. Table 7-3 presents the O&M expenses for the AG-NGCC/CCS Facility.
                   TABLE 7-3 – O&M EXPENSES FOR AG-NGCC WITH CCS
                        Technology:                            AG-NGCC/CCS
                    Fixed O&M Expense                          $30.25/kW-year
                   Variable O&M Expense                          $6.45/MWh

7.6 ENVIRONMENTAL COMPLIANCE INFORMATION
The environmental compliance strategy and equipment for the AG-NGCC Facility are the same
as those described in Section 5.6 for the Conventional NGCC Facility, with the exception that
the AG-NGCC with CCS Facility includes an amine scrubber control device for CO2. Table 7-4
presents environmental emissions for the AG-NGCC/CCS Facility.


                                                 7-4
TABLE 7-4 – ENVIRONMENTAL EMISSIONS FOR AG-NGCC/CCS
         Technology:       AG-NGCC/CCS
            NOX           0.0075 lb/MMBtu
            SO2            0.001 lb/MMBtu
            CO2              12 lb/MMBtu


                        7-5
8.   CONVENTIONAL COMBUSTION TURBINE (CT)

8.1 MECHANICAL EQUIPMENT AND SYSTEMS
The Conventional CT Facility produces 85 MW of electricity using a single natural gas-fueled
E-class CT and associated electric generator in simple-cycle mode. The CT is equipped with an
inlet evaporative cooler to reduce the temperature of the turbine inlet air to increase summer
output. Figure 8-1 presents the Conventional CT Facility process flow diagram.
            FIGURE 8-1 – CONVENTIONAL CT DESIGN CONFIGURATION


8.2 ELECTRICAL AND CONTROL SYSTEMS
The Conventional CT Facility has one CT electric generator. The generator is a 60 Hz machine
rated at approximately 101 MVA with an output voltage of 13.8 kV. The CT electric generator
is connected to a high-voltage bus in the Conventional CT Facility switchyard via a dedicated
generator circuit breaker, GSU, and a disconnect switch. The GSU increases the voltage from
the electric generator from 13.8 kV to interconnected transmission system high voltage.
The Conventional CT Facility is controlled using a DCS. The DCS provides centralized control
of the facility by integrating the control systems provided with the individual CT and associated
electric generator and the control of BOP systems and equipment.

8.3 OFF-SITE REQUIREMENTS
Natural gas is delivered to the facility through an approximately lateral connected to the local
natural gas trunk line. Water for the limited processes that utilize water at the Conventional CT
Facility is obtained from a one of several available water sources (e.g., municipal water supply).
The Conventional CT Facility uses a water treatment system and a high-efficiency reverse
osmosis system to reduce the dissolved solids for compressor cleaning. Wastewater is sent to a
municipal wastewater system. Further, the electrical interconnection from the Conventional CT
on-site switchyard is effectuated by a connection to an adjacent utility substation.


                                               8-1
8.4 CAPITAL COST ESTIMATE
The base Cost Estimate for the Conventional CT Facility with a nominal capacity of 85 MW is
$975/kW. Table 8-1 summarizes the Cost Estimate categories for the Conventional CT Facility.
                             TABLE 8-1 – BASE PLANT SITE
                    CAPITAL COST ESTIMATE FOR CONVENTIONAL CT
                                       Technology: Conventional CT
                             Nominal Capacity (ISO): 85,000 kW
                            Nominal Heat Rate (ISO): 10,850 Btu/kWh-HHV

      Capital Cost Category                                                           (000s) (October 1, 2010$)

      Civil Structural Material and Installation                                                   5,570

      Mechanical Equipment Supply and
      Installation                                                                                 34,709

      Electrical / I&C Supply and Installation                                                     10,700

      Project Indirects (1)                                                                        12,248

      EPC Cost before Contingency and Fee                                                          63,227

      Fee and Contingency                                                                          5,757

      Total Project EPC                                                                            68,994

      Owner Costs (excluding project finance)                                                      13,799

      Total Project Cost (excluding finance)                                                       82,793

      Total Project EPC                                                 / kW                         812

      Owner Costs 20% (excluding project finance)                       / kW                         162

      Total Project Cost (excluding project finance)                    / kW                         974

      (1)   Includes engineering, distributable costs, scaffolding, construction management, and start-up.


For this type of technology and power plant configuration, our regional adjustments took into
consideration the following: outdoor installation considerations, seismic design differences,
local technical enhancements (e.g., additional noise remediation that is generally required in
urban siting), remote location issues, urban – high density population issues, labor wage and
productivity differences, location adjustments, owner cost differences, and the increase in
overheads associated with these previous eight location adjustments.
Outdoor installation locations are considered in geographic areas where enclosed structures for
the boilers would not be required due to the low probability of freezing. The locations that were


                                                             8-2
included in outdoor installation are Alabama, Arizona, Arkansas, Florida, Georgia, Hawaii,
Louisiana, Mississippi, New Mexico, South Carolina, and Puerto Rico.
Seismic design differences among the various locations were based on U.S. seismic map
information that detailed the various seismic zones throughout the U.S. No cost increases were
associated with seismic Zone 0 and cost step increases were considered for Zones 1, 2, 3 and 4.
The locations with local technical enhancements include California, Colorado, Connecticut,
Delaware, District of Columbia, Louisiana, Maryland, Massachusetts, New Jersey, New York,
Rhode Island, Vermont, and Virginia. These are areas where noise, visual impacts, and other
technical enhancements generally need to be made by a project developer or utility to comply
with the applicable permitting/siting requirements.
Remote location issues are related to geographic areas that typically require installation of man
camps, higher craft incentives, and higher per diems are generally required with respect to
construction, due to the fact that such areas are long distances from urban areas, where labor is
generally abundant. Remote location designations were also considered in locations where
higher equipment freight costs are typically incurred, which for example are regions not near
established rail or highway access. Remote locations related to the Conventional CT Facility
include Fairbanks, Alaska; Honolulu, Hawaii; Albuquerque, New Mexico; Cheyenne, Wyoming;
and Cayey, Puerto Rico.
Labor wage and productivity differences were handled as discussed in Section 2.5.1, taking into
consideration the amount of labor we estimated for the Conventional CT Facility.
Location adjustments were made to locations where higher cost of living levels are incurred
and/or where population density generally correlates to higher construction costs for power and
other infrastructure projects. These locations include Alaska, California, Connecticut, Delaware,
District of Columbia, Hawaii, Illinois, Maine, Maryland, Massachusetts, Michigan, Minnesota,
New York, Ohio, and Wisconsin.
Owner costs were reviewed based on the need for utility upgrades and/or infrastructure costs
such as new facility transmission lines to tie to existing utility transmission substations or
existing transmission lines.
Table 8-2 presents the Conventional CT Facility capital cost variations for alternative U.S. plant
locations.


                                               8-3
TABLE 8-2 – LOCATION-BASED COSTS FOR CONVENTIONAL CT
                                      (OCTOBER 1, 2010 DOLLARS)
                                           Base
                                          Project    Location     Delta Cost   Total Location
                                           Cost      Percent      Difference    Project Cost
           State               City       ($/kW)     Variation      ($/kW)         ($/kW)
Alaska                 Anchorage            975           31.7%      309           1,284
Alaska                 Fairbanks            975           36.5%      355           1,330
Alabama                Huntsville           975           -7.1%      (69)           906
Arizona                Phoenix              975           3.8%        38           1,013
Arkansas               Little Rock          975           -5.7%      (55)           920
California             Los Angeles          975           28.3%      276           1,251
California             Redding              975           13.2%      129           1,104
California             Bakersfield          975           15.6%      152           1,127
California             Sacramento           975           19.3%      188           1,163
California             San Francisco        975           43.6%      425           1,400
Colorado               Denver               975           3.5%        34           1,009
Connecticut            Hartford             975           27.1%      265           1,240
Delaware               Dover                975           25.9%      253           1,228
District of Columbia   Washington           975           33.8%      330           1,305
Florida                Tallahassee          975           -9.6%      (93)           882
Florida                Tampa                975           -5.1%      (50)           925
Georgia                Atlanta              975           -4.9%      (48)           927
Hawaii                 Honolulu             975           49.5%      482           1,457
Idaho                  Boise                975           -2.8%      (28)           947
Illinois               Chicago              975           13.6%      132           1,107
Indiana                Indianapolis         975           1.3%        13            988
Iowa                   Davenport            975            0.9%       8             983
Iowa                   Waterloo             975           -4.6%      (45)           930
Kansas                 Wichita              975           -3.0%      (29)           946
Kentucky               Louisville           975           -4.1%      (40)           935
Louisiana              New Orleans          975           -3.1%      (30)           945
Maine                  Portland             975           -1.6%      (15)           960
Maryland               Baltimore            975           21.4%      208           1,183
Massachusetts          Boston               975           37.5%      366           1,341
Michigan               Detroit              975            4.8%       46           1,021
Michigan               Grand Rapids         975           -3.8%      (37)           938
Minnesota              St. Paul             975           4.0%        39           1,014
Mississippi            Jackson              975           -7.1%      (69)           906
Missouri               St. Louis            975           5.0%        48           1,023
Missouri               Kansas City          975           2.4%        23            998
Montana                Great Falls          975           -1.3%      (12)           963
Nebraska               Omaha                975           -0.6%      (6)            969
New Hampshire          Concord              975           8.0%        78           1,053
New Jersey             Newark               975           19.3%      188           1,163


                                                    8-4
Base
                                     Project    Location     Delta Cost      Total Location
                                      Cost      Percent      Difference       Project Cost
           State         City        ($/kW)     Variation      ($/kW)            ($/kW)
  New Mexico        Albuquerque        975           -1.4%      (13)              962
  New York          New York           975           62.5%      609              1,584
  New York          Syracuse           975           16.8%      164              1,139
  Nevada            Las Vegas          975           5.2%        50              1,025
  North Carolina    Charlotte          975           -7.2%      (70)              905
  North Dakota      Bismarck           975           -3.8%      (38)              937
  Ohio              Cincinnati         975           -0.8%       (8)              967
  Oregon            Portland           975           13.0%      127              1,102
  Pennsylvania      Philadelphia       975           24.1%      235              1,210
  Pennsylvania      Wilkes-Barre       975           -0.7%      (7)               968
  Rhode Island      Providence         975           21.6%      210              1,185
  South Carolina    Spartanburg        975       -10.3%         (101)             874
  South Dakota      Rapid City         975           -5.8%      (57)              918
  Tennessee         Knoxville          975           -6.6%      (65)              910
  Texas             Houston            975           -7.0%      (68)              907
  Utah              Salt Lake City     975           -2.6%      (25)              950
  Vermont           Burlington         975           1.3%        13               988
  Virginia          Alexandria         975           16.8%      163              1,138
  Virginia          Lynchburg          975           -4.5%      (44)              931
  Washington        Seattle            975            6.1%       59              1,034
  Washington        Spokane            975           -1.8%      (18)              957
  West Virginia     Charleston         975           0.6%        6                981
  Wisconsin         Green Bay          975           -0.6%       (6)              969
  Wyoming           Cheyenne           975           1.0%        10               985
  Puerto Rico       Cayey              975           12.1%      118              1,093

8.5 O&M ESTIMATE
In addition to the general O&M items discussed in Section 2.5.2, the Conventional CT Facility
includes the major maintenance for the CT and associated electric generator. These major
maintenance expenses are included with the VOM expense for this technology, based upon an
assumed 10 percent annual capacity factor and an operating profile of approximately 8 hours of
operation per CT start. Typically, significant overhauls on a Conventional CT Facility occur no
less frequently than 8,000 operating hour intervals; with more significant major maintenance
outages occurring at 24,000 operating hour intervals; however, often times the major
maintenance for a CT at a peaking facility is driven off of CT hours (depending on the
equipment manufacturer and the operating hours per start incurred on the equipment). Table 8-3
presents the O&M expenses for the Conventional CT Facility.


                                               8-5
TABLE 8-3 – O&M EXPENSES FOR CONVENTIONAL CT
                    Technology:                       Conventional CT
                Fixed O&M Expense                      $6.98/kW-year
               Variable O&M Expense                     $14.70/MWh

8.6 ENVIRONMENTAL COMPLIANCE INFORMATION
Typically, a Conventional CT Facility would be equipped with only the DLN combustion
hardware to mitigate emissions. There are some states in the U.S. that do require a “hot” SCR
that can operate at the higher exhaust temperatures of a simple-cycle plant, though that
equipment was not contemplated herein.
      TABLE 8-4 – ENVIRONMENTAL EMISSIONS FOR CONVENTIONAL CT
                     Technology:               Conventional CT
                        NOX                     0.03 lb/MMBtu
                         SO2                   0.001 lb/MMBtu
                         CO2                    117 lb/MMBtu


                                            8-6
9.   ADVANCED COMBUSTION TURBINE (ACT)

9.1 MECHANICAL EQUIPMENT AND SYSTEMS
The Advanced CT Facility produces 210 MW of electricity using a single natural gas-fueled,
state of the art (as of 2010) F-class CT and associated electric generator. The CT is equipped
with an inlet evaporative cooler to reduce the temperature of the turbine inlet air to increase
summer output. Figure 9-1 presents the Advanced CT process flow diagram.
              FIGURE 9-1 – ADVANCED CT DESIGN CONFIGURATION


9.2 ELECTRICAL AND CONTROL SYSTEMS
The Advanced CT Facility has the same general electrical and control systems as the
Conventional CT Facility, except that the electric generator is rated at approximately 234 MVA
and the corresponding GSU is larger in the Advanced CT Facility.

9.3 OFF-SITE REQUIREMENTS
The off-site requirements for the Advanced CT Facility are materially similar to the
Conventional CT Facility.

9.4 CAPITAL COST ESTIMATE
The base Cost Estimate for the Advanced CT Facility with a nominal capacity of 210 MW is
$665/kW. Table 9-1 summarizes the Cost Estimate categories for the Advanced CT Facility.


                                             9-1
TABLE 9-1 – BASE PLANT SITE CAPITAL COST ESTIMATE FOR ADVANCED CT
                                      Technology: Advanced CT
                            Nominal Capacity (ISO): 210,000 kW
                           Nominal Heat Rate (ISO): 9,750 Btu/kWh-HHV

      Capital Cost Category                                                          (000s) (October 1, 2010$)

      Civil Structural Material and Installation                                                 11,800

      Mechanical Equipment Supply and
      Installation                                                                               58,700

      Electrical / I&C Supply and Installation                                                   15,300

      Project Indirects (1)                                                                      16,460

      EPC Cost before Contingency and Fee                                                       102,260

      Fee and Contingency                                                                        14,196

      Total Project EPC                                                                         116,456

      Owner Costs (excluding project finance)                                                    23,291

      Total Project Cost (excluding finance)                                                    139,747

      Total Project EPC                                                / kW                        554

      Owner Costs 20% (excluding project finance)                      / kW                        111

      Total Project Cost (excluding project finance)                   / kW                        665

      (1) Includes engineering, distributable costs, scaffolding, construction management, and start-up.


The locational considerations for the Advanced CT Facility are the same as those set forth in the
section on the Conventional CT Facility.
Table 9-2 presents the Advanced CT Facility capital cost variations for alternative U.S. plant
locations.


                                                            9-2
TABLE 9-2 – LOCATION-BASED COSTS FOR ADVANCED CT
                                      (OCTOBER 1, 2010 DOLLARS)
                                           Base
                                          Project    Location     Delta Cost   Total Location
                                           Cost      Percent      Difference    Project Cost
           State               City       ($/kW)     Variation      ($/kW)         ($/kW)
Alaska                 Anchorage            665           34.3%      228            893
Alaska                 Fairbanks            665            5.4%       36            701
Alabama                Huntsville           665           -1.4%      (9)            656
Arizona                Phoenix              665           4.4%        29            694
Arkansas               Little Rock          665           -3.4%      (23)           642
California             Los Angeles          665            5.6%      38             703
California             Redding              665            2.5%      17             682
California             Bakersfield          665            1.2%       8             673
California             Sacramento           665            1.3%       9             674
California             San Francisco        665           -0.2%      (2)            663
Colorado               Denver               665           20.6%      137            802
Connecticut            Hartford             665           3.7%        25            690
Delaware               Dover                665           61.7%      410           1,075
District of Columbia   Washington           665           12.2%       81            746
Florida                Tallahassee          665            4.6%       31            696
Florida                Tampa                665           -4.6%      (31)           634
Georgia                Atlanta              665           -1.5%      (10)           655
Hawaii                 Honolulu             665           1.2%        8             673
Idaho                  Boise                665           4.7%        31            696
Illinois               Chicago              665           16.1%      107            772
Indiana                Indianapolis         665           1.7%        11            676
Iowa                   Davenport            665           16.6%      111            776
Iowa                   Waterloo             665           -5.5%      (37)           628
Kansas                 Wichita              665           -3.0%      (20)           645
Kentucky               Louisville           665           -4.6%      (31)           634
Louisiana              New Orleans          665           -5.2%      (35)           630
Maine                  Portland             665           0.0%       (0)            665
Maryland               Baltimore            665           5.6%        37            702
Massachusetts          Boston               665           12.6%       84            749
Michigan               Detroit              665           -3.0%      (20)           645
Michigan               Grand Rapids         665            6.5%       43            708
Minnesota              St. Paul             665           -0.6%      (4)            661
Mississippi            Jackson              665           2.3%        15            680
Missouri               St. Louis            665           1.0%        6             671
Missouri               Kansas City          665           5.5%        36            701
Montana                Great Falls          665           10.3%       68            733
Nebraska               Omaha                665           34.3%      228            893
New Hampshire          Concord              665           5.4%        36            701
New Jersey             Newark               665           -1.4%      (9)            656


                                                    9-3
Base
                                       Project    Location       Delta Cost    Total Location
                                        Cost      Percent        Difference     Project Cost
           State           City        ($/kW)     Variation        ($/kW)          ($/kW)
  New Mexico          Albuquerque        665           4.4%          29             694
  New York            New York           665           -3.4%        (23)            642
  New York            Syracuse           665            5.6%         38             703
  Nevada              Las Vegas          665           2.5%          17             682
  North Carolina      Charlotte          665           1.2%          8              673
  North Dakota        Bismarck           665           1.3%          9              674
  Ohio                Cincinnati         665           -0.2%        (2)             663
  Oregon              Portland           665           20.6%        137             802
  Pennsylvania        Philadelphia       665            3.7%        25              690
  Pennsylvania        Wilkes-Barre       665           61.7%        410            1,075
  Rhode Island        Providence         665           12.2%         81             746
  South Carolina      Spartanburg        665           4.6%          31             696
  South Dakota        Rapid City         665           -4.6%        (31)            634
  Tennessee           Knoxville          665           -1.5%        (10)            655
  Texas               Houston            665           1.2%          8              673
  Utah                Salt Lake City     665           4.7%          31             696
  Vermont             Burlington         665           16.1%        107             772
  Virginia            Alexandria         665            1.7%         11             676
  Virginia            Lynchburg          665           16.6%        111             776
  Washington          Seattle            665           -5.5%        (37)            628
  Washington          Spokane            665           -3.0%        (20)            645
  West Virginia       Charleston         665           -4.6%        (31)            634
  Wisconsin           Green Bay          665           -5.2%        (35)            630
  Wyoming             Cheyenne           665           0.0%         (0)             665
  Puerto Rico         Cayey              665           5.6%          37             702

9.5 O&M ESTIMATE
The O&M items for the Advanced CT Facility are the same as those set forth in Section 8.5 for
the Conventional CT Facility. Table 9-3 presents the O&M expenses for the Advanced CT
Facility.
                    TABLE 9-3 – O&M EXPENSES FOR ADVANCED CT
                        Technology:                            Advanced CT
                    Fixed O&M Expense                          $6.70/kW-year
                   Variable O&M Expense                         $9.87/MWh

9.6 ENVIRONMENTAL COMPLIANCE INFORMATION
The environmental compliance strategy and equipment for the Advanced CT Facility are the
same as those used for the Conventional CT Facility (see Section 8.6). Table 9-4 presents
environmental emissions for the Advanced CT Facility.


                                                 9-4
TABLE 9-4 – ENVIRONMENTAL EMISSIONS FOR ADVANCED CT
        Technology:            Advanced CT
           NOX                 0.03 lb/MMBtu
            SO2               0.001 lb/MMBtu
            CO2                117 lb/MMBtu


                        9-5
10. INTEGRATED GASIFICATION COMBINED CYCLE (IGCC)

10.1 MECHANICAL EQUIPMENT AND SYSTEMS
The following describes the IGCC Facility, which is a nominal 600 MW net coal-fired
gasification-to-power facility. An analysis is also provided for a nominally 1,200 MW coal-fired
gasification-to-power facility, which is essentially a dual-unit configuration, based on doubling
the single-unit description provided below; however, a detailed technical description (due to the
similarities/duplication with the single unit) is not provided herein. The feed for the gasification
system is a slurry of water and ground coal and/or petroleum coke. The raw feedstock is ground
in rod mills along with recycled water and slag fines to form the slurry. A fluxing agent is also
added, if necessary, depending on the properties of the feedstock, to facilitate slagging at
appropriate temperatures in the gasifier.
Air separation units (“ASU”) provide a 95 percent-pure oxygen (“O2”) stream for gasification,
and nitrogen for use as a diluent in the CTs, and for purging the gasifiers.
The IGCC Facility is based on two trains of ConocoPhillips (E-Gas) gasifier, which is a
two-stage, refractory lined vessel that converts the slurry feed into syngas consisting of
hydrogen, CO, CO2, methane, nitrogen, argon and water along with sulfur compounds in the
form of hydrogen sulfide (“H2S”) and carbonyl sulfide (“COS”) and a small amount of NH3.
The first stage is the slagging section in which the feedstock is partially combusted with O2 at
elevated temperature and pressure (2,500 degrees ºF and 540 psia). O2 and preheated slurry are
fed to each of two opposing mixing nozzles at opposite ends of the horizontal section. The
gasification temperature is maintained above the ash fusion point to allow for slag formation and
carbon conversion.
The raw syngas from the first stage flows into the vertical second stage where additional feed
slurry is introduced to take advantage of the sensible heat in the gas. This fuel undergoes
devolatization and pyrolysis generating additional syngas. The endothermic nature of the
reactions and the introduction of a quench fluid reduce the temperature of the gas exiting to the
gasifier to approximately 1,900ºF. At these temperatures (2,500ºF to 1,900ºF), two additional
reactions occur, which change the character of the syngas as follows: (1) carbon-steam to
produce CO; and (2) water gas shift (steam and CO) to produce hydrogen and CO2. In addition,
the lower reaction temperature in the second stage allows the formation of methane. Unreacted
char is carried overhead and exits the reactor with the syngas. This char is recycled to the first
stage of gasification.
The mineral matter in the feedstock and any fluxing agent form a molten slag that flows out of
the horizontal section into water quench bath. The cooled slag exits the bottom of the quench, is
crushed and exits the unit through a continuous slag removal system as a slurry.
The hot raw syngas is cooled in a vertical fire tube boiler from 1,900ºF to 700ºF. The hot gas is
on the tube side with pressurized water on the shell side. This unit generates HP saturated steam.
The saturated steam is sent to the HRSGs in the power block.
After cooling, the syngas is cleaned of entrained particles in a filter vessel containing numerous
candlestick-type filter elements. The particles collect on the filter elements producing an
essentially particulate matter free syngas that proceeds through the system.


                                               10-1
Captured particulate matter is cleaned from the filter elements using cleaned syngas (in a
back-pulse mode) and the carbon-rich material is pneumatically conveyed back to the first stage
of the gasifier for conversion.
Following particulate matter removal, the syngas is scrubbed with water to remove chlorine and
trace metals. The scrubbing medium is condensed sour water from the low-temperature heat
recovery system.
After the chlorine scrubber, the raw syngas is treated in COS hydrolysis units, which convert the
COS in the syngas to H2S. The syngas is then cooled to approximately 100°F in a series of shell
and tube heat exchangers in a step known as low-temperature heat recovery. This cooling
removes most of the water in the syngas. In addition, most of the NH3 and a small portion of
CO2 and H2S are absorbed in the water. A portion of the condensed water is used in the chlorine
scrubber with the remainder sent to sour water treatment. The low temperature heat removed
prior to acid gas removal (“AGR”) is used within the process.
After low-temperature heat recovery, the H2S is then removed in the AGR units. The AGR units
use the Selexol solvent in a single absorption stage to remove much of the sulfur from the
syngas. The syngas passes through a mercury removal system consisting of sulfated activated
carbon beds. Finally, the treated syngas is moisturized and sent to the power block.
The acid gas streams containing H2S and COS with some CO2 from AGR and sour water
treatment are fed to the sulfur recovery units (“SRUs”). The SRUs are based on a standard Claus
process to convert the acid gas to pure molten sulfur. The tail gas from the SRUs, composed of
CO2, nitrogen, and small amounts of sulfur, is catalytically hydrogenated to convert all of the
sulfur to H2S. This converted tail gas is compressed and recycled to the gasifiers.
Process water blowdown and water condensed during cooling of the sour syngas contains small
amounts of dissolved gases (H2S, CO2 and NH3). This water is treated in sour water stripping
units and either recycled to slurry preparation or further treated in a zero-liquid discharge
(“ZLD”) system to recover and reuse water. Solid waste from the ZLD is landfilled.
The power block for the IGCC Facility case is based on a two-on-one combined-cycle
configuration using F-class CTs. The combined cycle is similar to the Conventional NGCC
Facility except the CTs are designed to combust natural gas and/or syngas, and the combustors
are not DLN. Figure 10-1 presents the IGCC process flow diagram.


                                              10-2
FIGURE 10-1 – IGCC DESIGN CONFIGURATION


10.2 ELECTRICAL AND CONTROL SYSTEMS
The IGCC Facility has two CT electric generators and one ST electric generator. The generators
for the CTs are 60 Hz machines rated at approximately 255 MVA with an output voltage of
18 kV. The ST electric generator is a 60 Hz machine rated at approximately 333 MVA with an
output voltage of 18 kV. Each CT electric generator is connected to a high-voltage bus in the
IGCC Facility switchyard via a dedicated generator circuit breaker, GSU, and a disconnect
switch. The ST electric generator is connected directly to its GSU and connected through a
disconnect switch between two breakers on the high-voltage bus. The GSUs increase the
voltage from the electric generators from 18 kV to interconnected transmission system high
voltage.
The IGCC Facility is controlled using a DCS. The DCS provides centralized control of the
facility by integrating the control systems provided with each individual CT and associated
electric generator, ST and associated electric generator, and the control of BOP systems and
equipment.

10.3 OFF-SITE REQUIREMENTS
Coal is delivered to the IGCC Facility by rail, truck or barge. Water for all processes at the
IGCC is obtained from one of several available water sources; however, water is typically
sourced from an adjacent river, when possible. The IGCC uses a water treatment system and a
high-efficiency reverse osmosis system to reduce the dissolved solids from the cooling water and
to provide distilled water for HRSG makeup. Wastewater is sent to an adjacent river or other
approved wastewater delivery point. Further, the electrical interconnection from the IGCC on-
site switchyard is effectuated by a connection to an adjacent utility substation.


                                             10-3
10.4 CAPITAL COST ESTIMATE
The base Cost Estimate for the IGCC Facility with a nominal capacity of 600 MW is $3,565/kW
and with a nominal capacity of 1,200 MW is $3,221/kW. Table 10-1 and Table 10-2 summarize
the Cost Estimate categories for the IGCC Facility.
      TABLE 10-1 – BASE PLANT SITE CAPITAL COST ESTIMATE FOR IGCC
                                      Technology: IGCC
                            Nominal Capacity (ISO): 600,000 kW
                           Nominal Heat Rate (ISO): 8,700 Btu/kWh-HHV

      Capital Cost Category                                                          (000s) (October 1, 2010$)

      Civil Structural Material and Installation                                                102,121

      Mechanical Equipment Supply and
      Installation                                                                              975,212

      Electrical / I&C Supply and Installation                                                  200,708

      Project Indirects (1)                                                                     313,558

      EPC Cost before Contingency and Fee                                                      1,591,599

      Fee and Contingency                                                                       190,992

      Total Project EPC                                                                        1,782,591

      Owner Costs (excluding project finance)                                                   356,518

      Total Project Cost (excluding finance)                                                   2,139,109

      Total Project EPC                                                / kW                       2,971

      Owner Costs 20% (excluding project finance)                      / kW                        594

      Total Project Cost (excluding project finance)                   / kW                       3,565

      (1) Includes engineering, distributable costs, scaffolding, construction management, and start-up.


                                                           10-4
TABLE 10-2 – BASE PLANT SITE CAPITAL COST ESTIMATE FOR IGCC
                                      Technology: IGCC
                            Nominal Capacity (ISO): 1,200,000 kW
                           Nominal Heat Rate (ISO): 8,700 Btu/kWh-HHV

      Capital Cost Category                                                          (000s) (October 1, 2010$)

      Civil Structural Material and Installation                                                178,606

      Mechanical Equipment Supply and
      Installation                                                                             1,859,974

      Electrical / I&C Supply and Installation                                                  364,745

      Project Indirects (1)                                                                     521,600

      EPC Cost before Contingency and Fee                                                      2,924,925

      Fee and Contingency                                                                       350,991

      Total Project EPC                                                                        3,275,916

      Owner Costs (excluding project finance)                                                   589,665

      Total Project Cost (excluding finance)                                                   3,865,581

      Total Project EPC                                                / kW                       2730

      Owner Costs 18% (excluding project finance)                      / kW                        491

      Total Project Cost (excluding project finance)                   / kW                       3,221

      (1) Includes engineering, distributable costs, scaffolding, construction management, and start-up.


For this type of technology and power plant configuration, our regional adjustments took into
consideration the following: outdoor installation considerations, seismic design differences,
remote location issues, labor wage and productivity differences, location adjustments, owner cost
differences, and the increase in overheads associated with these six adjustments.

Outdoor installation locations are considered in geographic areas where enclosed structures for
the boilers would not be required due to the low probability of freezing. The locations that
included outdoor installation are Alabama, Arizona, Arkansas, Florida, Georgia, Hawaii,
Louisiana, Mississippi, New Mexico, South Carolina, and Puerto Rico.
Seismic design differences among the various locations were based on U.S. seismic map
information that detailed the various seismic zones throughout the U.S. No cost increases were
associated with seismic Zone 0 and cost step increases were considered for Zones 1, 2, 3 and 4.


                                                           10-5
Remote locations issues are related to geographic areas that typically require installation of man
camps, higher craft incentives, and higher per diems for construction, because such areas are
long distances from urban areas, where labor is generally abundant. Remote location
designations were also considered in locations where higher equipment freight costs are typically
incurred, which for example are regions not near established rail or highway access. Remote
locations related to the IGCC Facility include Fairbanks, Alaska; Honolulu, Hawaii;
Albuquerque, New Mexico; Cheyenne, Wyoming; and Cayey, Puerto Rico.
Labor wage and productivity differences were handled as discussed in Section 2.5.1, taking into
consideration the amount of labor we estimated for the IGCC Facility.
Location adjustments were made to locations where higher cost of living levels are incurred
and/or where population density generally correlates to higher construction costs for power and
other infrastructure projects. These locations include Alaska, California, Connecticut, Delaware,
District of Columbia, Hawaii, Illinois, Maine, Maryland, Massachusetts, Michigan, Minnesota,
New York, Ohio, and Wisconsin.
Owner costs were reviewed based on the need for utility upgrades and/or infrastructure costs
such as new facility transmission lines to tie to existing utility transmission substations or
existing transmission lines.
Table 10-3 and Table 10-4 present the IGCC Facility capital cost variations for alternative U.S.
plant locations.


                                              10-6
TABLE 10-3 – LOCATION-BASED COSTS FOR IGCC (600,000 KW)
                                      (OCTOBER 1, 2010 DOLLARS)
                                           Base
                                          Project    Location     Delta Cost   Total Location
                                           Cost      Percent      Difference    Project Cost
           State               City       ($/kW)     Variation      ($/kW)         ($/kW)
Alaska                 Anchorage           3,565       29.4%        1,049          4,614
Alaska                 Fairbanks           3,565       28.5%        1,016          4,581
Alabama                Huntsville          3,565       -6.5%         (232)         3,333
Arizona                Phoenix             3,565       -4.5%         (160)         3,405
Arkansas               Little Rock         3,565       -4.7%         (167)         3,398
California             Los Angeles         3,565       18.1%         645           4,210
California             Redding             3,565        8.7%         312           3,877
California             Bakersfield         3,565        8.4%         299           3,864
California             Sacramento          3,565       12.8%         455           4,020
California             San Francisco       3,565       37.6%        1,342          4,907
Colorado               Denver              3,565       -5.2%         (187)         3,378
Connecticut            Hartford            3,565       23.7%         846           4,411
Delaware               Dover               3,565       20.6%         734           4,299
District of Columbia   Washington          3,565       35.6%        1,269          4,834
Florida                Tallahassee         3,565       -9.5%         (339)         3,226
Florida                Tampa               3,565       -4.3%         (152)         3,413
Georgia                Atlanta             3,565       -7.1%         (252)         3,313
Hawaii                 Honolulu              0                        0
Idaho                  Boise               3,565       -3.2%         (113)         3,452
Illinois               Chicago             3,565       17.4%         619           4,184
Indiana                Indianapolis        3,565           2.9%      103           3,668
Iowa                   Davenport           3,565       -1.4%          (48)         3,517
Iowa                   Waterloo            3,565       -7.8%         (279)         3,286
Kansas                 Wichita             3,565       -5.8%         (208)         3,357
Kentucky               Louisville          3,565       -4.8%         (172)         3,393
Louisiana              New Orleans         3,565       -9.8%         (348)         3,217
Maine                  Portland            3,565       -0.4%         (14)          3,551
Maryland               Baltimore           3,565           4.3%      153           3,718
Massachusetts          Boston              3,565       31.3%        1,115          4,680
Michigan               Detroit             3,565        3.4%          120          3,685
Michigan               Grand Rapids        3,565       -6.8%         (243)         3,322
Minnesota              St. Paul            3,565           3.4%      123           3,688
Mississippi            Jackson             3,565       -6.5%         (230)         3,335
Missouri               St. Louis           3,565           6.4%      227           3,792
Missouri               Kansas City         3,565           3.0%      107           3,672
Montana                Great Falls         3,565       -3.7%         (131)         3,434
Nebraska               Omaha               3,565       -3.0%         (108)         3,457
New Hampshire          Concord             3,565       -1.4%         (49)          3,516
New Jersey             Newark              3,565       13.5%         480           4,045


                                                    10-7
Base
                                  Project    Location     Delta Cost   Total Location
                                   Cost      Percent      Difference    Project Cost
         State        City        ($/kW)     Variation      ($/kW)         ($/kW)
New Mexico       Albuquerque       3,565        -3.4%        (120)         3,445
New York         New York          3,565       28.4%        1,013          4,578
New York         Syracuse          3,565        9.7%         345           3,910
Nevada           Las Vegas         3,565           8.1%      290           3,855
North Carolina   Charlotte         3,565        -8.3%        (296)         3,269
North Dakota     Bismarck          3,565        -6.9%        (247)         3,318
Ohio             Cincinnati        3,565           0.4%       16           3,581
Oregon           Portland          3,565           8.5%      303           3,868
Pennsylvania     Philadelphia      3,565       10.6%          377          3,942
Pennsylvania     Wilkes-Barre      3,565       -3.0%         (107)         3,458
Rhode Island     Providence        3,565           3.6%      129           3,694
South Carolina   Spartanburg       3,565       -10.2%        (364)         3,201
South Dakota     Rapid City        3,565        -9.3%        (331)         3,234
Tennessee        Knoxville         3,565        -7.7%        (276)         3,289
Texas            Houston           3,565        -8.3%        (294)         3,271
Utah             Salt Lake City    3,565        -2.6%        (91)          3,474
Vermont          Burlington        3,565        -4.6%        (162)         3,403
Virginia         Alexandria        3,565         8.8%        313           3,878
Virginia         Lynchburg         3,565        -1.6%        (56)          3,509
Washington       Seattle           3,565       11.3%         404           3,969
Washington       Spokane           3,565       -2.0%         (70)          3,495
West Virginia    Charleston        3,565        -1.5%        (55)          3,510
Wisconsin        Green Bay         3,565           0.5%       19           3,584
Wyoming          Cheyenne          3,565           3.7%      132           3,697
Puerto Rico      Cayey               0                        0              0


                                            10-8
TABLE 10-4 – LOCATION-BASED COSTS FOR IGCC (1,200,000 KW)
                                      (OCTOBER 1, 2010 DOLLARS)
                                           Base
                                          Project    Location     Delta Cost   Total Location
                                           Cost      Percent      Difference    Project Cost
           State               City       ($/kW)     Variation      ($/kW)         ($/kW)
Alaska                 Anchorage           3,221       32.0%        1,031          4,252
Alaska                 Fairbanks           3,221       30.9%         996           4,217
Alabama                Huntsville          3,221        -6.7%        (216)         3,005
Arizona                Phoenix             3,221        -4.6%        (147)         3,074
Arkansas               Little Rock         3,221        -4.8%        (154)         3,067
California             Los Angeles         3,221       19.8%         637           3,858
California             Redding             3,221        9.6%         308           3,529
California             Bakersfield         3,221        9.2%         296           3,517
California             Sacramento          3,221       13.7%         442           3,663
California             San Francisco       3,221       40.8%        1,313          4,534
Colorado               Denver              3,221        -5.4%        (173)         3,048
Connecticut            Hartford            3,221       26.0%         836           4,057
Delaware               Dover               3,221       22.7%         730           3,951
District of Columbia   Washington          3,221       39.5%        1,272          4,493
Florida                Tallahassee         3,221        -9.9%        (318)         2,903
Florida                Tampa               3,221        -4.4%        (143)         3,078
Georgia                Atlanta             3,221        -7.3%        (235)         2,986
Hawaii                 Honolulu              -                         -
Idaho                  Boise               3,221        -3.2%        (102)         3,119
Illinois               Chicago             3,221       18.2%         586           3,807
Indiana                Indianapolis        3,221           3.3%      107           3,328
Iowa                   Davenport           3,221        -1.4%         (45)         3,176
Iowa                   Waterloo            3,221        -8.1%        (261)         2,960
Kansas                 Wichita             3,221        -6.0%        (192)         3,029
Kentucky               Louisville          3,221        -4.9%        (158)         3,063
Louisiana              New Orleans         3,221       -10.1%        (326)         2,895
Maine                  Portland            3,221           0.0%       (1)          3,220
Maryland               Baltimore           3,221           5.0%      162           3,383
Massachusetts          Boston              3,221       33.8%        1,087          4,308
Michigan               Detroit             3,221         3.5%         114          3,335
Michigan               Grand Rapids        3,221        -7.1%        (227)         2,994
Minnesota              St. Paul            3,221           3.6%      117           3,338
Mississippi            Jackson             3,221        -6.6%        (214)         3,007
Missouri               St. Louis           3,221           6.9%      221           3,442
Missouri               Kansas City         3,221           3.2%      103           3,324
Montana                Great Falls         3,221        -3.7%        (119)         3,102
Nebraska               Omaha               3,221        -3.1%        (99)          3,122
New Hampshire          Concord             3,221        -1.3%        (42)          3,179
New Jersey             Newark              3,221       14.0%         449           3,670


                                                    10-9
Base
                                       Project     Location       Delta Cost    Total Location
                                        Cost       Percent        Difference     Project Cost
           State           City        ($/kW)      Variation        ($/kW)          ($/kW)
  New Mexico          Albuquerque       3,221        -3.4%           (109)          3,112
  New York            New York          3,221        29.5%           949            4,170
  New York            Syracuse          3,221        10.8%           349            3,570
  Nevada              Las Vegas         3,221        8.6%            278            3,499
  North Carolina      Charlotte         3,221        -8.5%           (273)          2,948
  North Dakota        Bismarck          3,221        -7.2%           (230)          2,991
  Ohio                Cincinnati        3,221        0.8%             25            3,246
  Oregon              Portland          3,221        9.3%            300            3,521
  Pennsylvania        Philadelphia      3,221        11.0%           355            3,576
  Pennsylvania        Wilkes-Barre      3,221        -3.0%           (96)           3,125
  Rhode Island        Providence        3,221        3.9%            124            3,345
  South Carolina      Spartanburg       3,221       -10.5%           (337)          2,884
  South Dakota        Rapid City        3,221        -9.6%           (309)          2,912
  Tennessee           Knoxville         3,221        -7.9%           (256)          2,965
  Texas               Houston           3,221        -8.5%           (275)          2,946
  Utah                Salt Lake City    3,221        -2.4%           (76)           3,145
  Vermont             Burlington        3,221        -4.6%           (148)          3,073
  Virginia            Alexandria        3,221         9.9%           320            3,541
  Virginia            Lynchburg         3,221        -1.3%           (41)           3,180
  Washington          Seattle           3,221        12.3%           395            3,616
  Washington          Spokane           3,221        -1.9%           (62)           3,159
  West Virginia       Charleston        3,221        -1.5%           (49)           3,172
  Wisconsin           Green Bay         3,221        0.8%             27            3,248
  Wyoming             Cheyenne          3,221        4.6%            148            3,369
  Puerto Rico         Cayey               0          0                0               0

10.5 O&M ESTIMATE
In addition to the general O&M items discussed in Section 2.5.2, IGCC Facility includes the
major maintenance for the CTs, as well as the BOP, including the ST, associated electric
generators, HRSGs, and emissions reduction catalysts. Additionally, provisions need to be made
for routine and major maintenance for the gasification systems, the ASU, and associated
gasification auxiliary equipment needs to be made. For example, major maintenance for the
gasifier includes repair and replacement of the refractory. Typically, significant overhauls on an
IGCC Facility occur no less frequently than 18 months and the cycle for the power generation
equipment is similar to the to the Advanced NGCC discussed above. Table 10-5 and Table 10-6
present the O&M expenses for the IGCC Facility.
                   TABLE 10-5 – O&M EXPENSES FOR IGCC (600,000 KW)
                        Technology:                                 IGCC
                    Fixed O&M Expense                          $59.23/kW-year
                   Variable O&M Expense                          $6.87/MWh


                                                 10-10
TABLE 10-6 – O&M EXPENSES FOR IGCC (1,200,000 KW)
                     Technology:                             IGCC
                 Fixed O&M Expense                      $48.90/kW-year
                Variable O&M Expense                      $6.87/MWh

10.6 ENVIRONMENTAL COMPLIANCE INFORMATION
The IGCC uses syngas combustors (which do not have DLN) in the CT and best available burner
technology with respect to the duct burners in the HRSGs to manage the production of NOX and
CO. Additional control of NOX and CO is accomplished through an SCR and an oxidization
catalyst, respectively. SO2 in the IGCC is managed through the removal of sulfur in the syngas
via the AGR system prior to combustion. The IGCC does not include any control devices for
CO2, which is proportional to the heat rate (inversely proportional to the efficiency) of the
technology. Water, wastewater, and solid waste compliance are achieved through traditional
on-site and off-site methods, and the costs for such compliance are included in the O&M
Estimate for the IGCC. Table 10-7 presents environmental emissions for the IGCC Facility.
              TABLE 10-7 – ENVIRONMENTAL EMISSIONS FOR IGCC
                      Technology:                     IGCC
                         NOX                    0.0075 lb/MMBtu
                          SO2                    0.025 lb/MMBtu
                          CO2                     206 lb/MMBtu


                                            10-11
11. INTEGRATED GASIFICATION COMBINED CYCLE WITH CCS (IGCC/CCS)

11.1 MECHANICAL EQUIPMENT AND SYSTEMS
The plant configuration for the IGCC/CCS Facility case is the same as the IGCC Facility case
with the exceptions that: (1) a water gas shift reactor system is substituted instead of the COS
hydrolysis system upstream of the AGR; and (2) a two-stage Selexol AGR system is utilized
instead of a single stage to allow the capture of CO2 from the syngas prior to combustion. The
captured CO2 is compressed to approximately 2,000 psia for injection into a pipeline at the plant
fence line. The IGCC/CCS Facility produces 690 MW of gross power and 520 MW of net
power. Figure 11-1 presents the IGCC/CCS process flow diagram.
                 FIGURE 11-1 – IGCC/CCS DESIGN CONFIGURATION


11.2 ELECTRICAL AND CONTROL SYSTEMS
The electrical and control systems for the IGCC/CCS Facility are materially similar to the IGCC
Facility (without CCS) discussed in Section 10.2.

11.3 OFF-SITE REQUIREMENTS
The off-site requirements for the IGCC/CCS Facility are materially similar to the IGCC Facility
(without CCS) discussed in Section 10.3, except that an interconnection needs to be made with
respect to the sequestration of CO2.

11.4 CAPITAL COST ESTIMATE
The base Cost Estimate for the IGCC/CCS Facility with a nominal capacity of 520 MW is
$5,348/kW. Table 11-1 summarizes the Cost Estimate categories for the IGCC/CCS Facility.


                                              11-1
TABLE 11-1 – BASE PLANT SITE CAPITAL COST ESTIMATE FOR IGCC/CCS
                                      Technology: IGCC/CCS
                            Nominal Capacity (ISO): 520,000 kW
                           Nominal Heat Rate (ISO): 10,700 Btu/kWh-HHV

      Capital Cost Category                                                          (000s) (October 1, 2010$)

      Total Project EPC                                                                        2,317,500

      Owner Costs (excluding project finance)                                                   463,500

      Total Project Cost (excluding finance)                                                   2,781,000

      Total Project EPC                                                / kW                       4,458

      Owner Costs 20% (excluding project finance)                      / kW                        892

      Total Project Cost (excluding project finance)                   / kW                       5,348

      (1) Includes engineering, distributable costs, scaffolding, construction management, and start-up.


The locational considerations for the IGCC/CCS Facility are the same as those set forth in
Section 10.4 for the IGCC Facility.
Table 11-2 presents the IGCC/CCS Facility capital cost variations for alternative U.S. plant
locations.


                                                           11-2
TABLE 11-2 – LOCATION-BASED COSTS FOR IGCC/CCS
                                      (OCTOBER 1, 2010 DOLLARS)
                                           Base
                                          Project    Location     Delta Cost   Total Location
                                           Cost      Percent      Difference    Project Cost
           State               City       ($/kW)     Variation      ($/kW)         ($/kW)
Alaska                 Anchorage           5,350       23.1%        1,236          6,586
Alaska                 Fairbanks           5,350       22.9%        1,225          6,575
Alabama                Huntsville          5,350        -7.4%        (397)         4,953
Arizona                Phoenix             5,350        -5.5%        (293)         5,057
Arkansas               Little Rock         5,350        -5.7%        (306)         5,044
California             Los Angeles         5,350       13.7%         732           6,082
California             Redding             5,350        6.5%         348           5,698
California             Bakersfield         5,350        6.1%         326           5,676
California             Sacramento          5,350       11.1%         591           5,941
California             San Francisco       5,350       30.7%        1,642          6,992
Colorado               Denver              5,350        -6.3%        (335)         5,015
Connecticut            Hartford            5,350       17.7%         946           6,296
Delaware               Dover               5,350       14.5%         774           6,124
District of Columbia   Washington          5,350       23.0%        1,229          6,579
Florida                Tallahassee         5,350       -10.5%        (561)         4,789
Florida                Tampa               5,350        -4.5%        (243)         5,107
Georgia                Atlanta             5,350        -8.1%        (432)         4,918
Hawaii                 Honolulu              0             0          0              0
Idaho                  Boise               5,350        -4.2%        (227)         5,123
Illinois               Chicago             5,350       17.9%         959           6,309
Indiana                Indianapolis        5,350           1.2%       67           5,417
Iowa                   Davenport           5,350        -1.5%         (82)         5,268
Iowa                   Waterloo            5,350        -8.9%        (474)         4,876
Kansas                 Wichita             5,350        -6.9%        (370)         4,980
Kentucky               Louisville          5,350        -5.8%        (309)         5,041
Louisiana              New Orleans         5,350       -10.8%        (577)         4,773
Maine                  Portland            5,350        -2.8%        (151)         5,199
Maryland               Baltimore           5,350           1.1%       60           5,410
Massachusetts          Boston              5,350       26.2%        1,402          6,752
Michigan               Detroit             5,350         3.5%         185          5,535
Michigan               Grand Rapids        5,350        -7.7%        (413)         4,937
Minnesota              St. Paul            5,350           3.4%      181           5,531
Mississippi            Jackson             5,350        -7.4%        (394)         4,956
Missouri               St. Louis           5,350           5.5%      295           5,645
Missouri               Kansas City         5,350           2.7%      145           5,495
Montana                Great Falls         5,350        -4.8%        (259)         5,091
Nebraska               Omaha               5,350        -3.8%        (201)         5,149
New Hampshire          Concord             5,350        -2.2%        (119)         5,231
New Jersey             Newark              5,350       14.9%         795           6,145


                                                    11-3
Base
                                       Project    Location        Delta Cost    Total Location
                                        Cost      Percent         Difference     Project Cost
           State           City        ($/kW)     Variation         ($/kW)          ($/kW)
  New Mexico          Albuquerque       5,350        -4.4%           (235)          5,115
  New York            New York          5,350       31.4%           1,681           7,031
  New York            Syracuse          5,350        5.5%            295            5,645
  Nevada              Las Vegas         5,350           7.7%         410            5,760
  North Carolina      Charlotte         5,350       -10.1%           (538)          4,812
  North Dakota        Bismarck          5,350        -7.8%           (419)          4,931
  Ohio                Cincinnati        5,350        -1.5%           (82)           5,268
  Oregon              Portland          5,350           6.2%         333            5,683
  Pennsylvania        Philadelphia      5,350       11.3%             602           5,952
  Pennsylvania        Wilkes-Barre      5,350       -4.1%            (217)          5,133
  Rhode Island        Providence        5,350           3.4%         183            5,533
  South Carolina      Spartanburg       5,350       -12.0%           (640)          4,710
  South Dakota        Rapid City        5,350       -10.5%           (562)          4,788
  Tennessee           Knoxville         5,350        -9.1%           (486)          4,864
  Texas               Houston           5,350        -9.3%           (499)          4,851
  Utah                Salt Lake City    5,350        -4.6%           (245)          5,105
  Vermont             Burlington        5,350        -5.8%           (311)          5,039
  Virginia            Alexandria        5,350         4.5%            241           5,591
  Virginia            Lynchburg         5,350        -3.8%           (203)          5,147
  Washington          Seattle           5,350         9.4%            505           5,855
  Washington          Spokane           5,350        -2.9%           (154)          5,196
  West Virginia       Charleston        5,350        -2.1%           (111)          5,239
  Wisconsin           Green Bay         5,350        -1.1%           (58)           5,292
  Wyoming             Cheyenne          5,350        -0.5%           (29)           5,321
  Puerto Rico         Cayey               0             0             0               0

11.5 O&M ESTIMATE
The O&M methodology for the IGCC/CCS Facility is the same as that set forth in the section on
the IGCC Facility, except that consideration needs to be made for the additional maintenance
resulting from the CCS equipment.
Table 11-3 presents the O&M expenses for the IGCC/CCS Facility.
                      TABLE 11-3 – O&M EXPENSES FOR IGCC/CCS
                        Technology:                              IGCC/CCS
                    Fixed O&M Expense                          $69.30/kW-year
                   Variable O&M Expense                          $8.04/MWh

11.6 ENVIRONMENTAL COMPLIANCE INFORMATION
The environmental compliance strategy for the IGCC/CCS Facility is the same as that set forth in
the section on the IGCC Facility, except for CCS including a two-stage Selexol AGR for capture
of CO2. Table 11-4 presents environmental emissions for the IGCC/CCS Facility.


                                                 11-4
TABLE 11-4 – ENVIRONMENTAL EMISSIONS FOR IGCC/CCS
      Technology:            IGCC/CCS
         NOX             0.0075 lb/MMBtu
          SO2             0.015 lb/MMBtu
          CO2              20.6 lb/MMBtu


                      11-5
12. ADVANCED NUCLEAR (AN)

12.1 MECHANICAL EQUIPMENT AND SYSTEMS
The Advanced Nuclear (“AN”) Facility consists of two 1,117 MW Westinghouse AP1000
nuclear power units built in a brownfield (existing nuclear facility site).
The steam cycle of a nuclear powered electric generation facility is similar to other
steam-powered generating facilities. The difference is with the source of heat used to generate
steam. In units that use fossil fuels, hydrocarbons are burned to heat water, producing steam. In
the AP1000, splitting the nucleus (fission) of uranium atoms provides the energy to heat the
water.
Nuclear fuel is a uranium dioxide ceramic pellet encased in a zirconium alloy tube. The uranium
atoms in the pellet absorb neutrons and split, or fission. When the uranium atom splits, a large
amount of energy, as well as additional neutrons and fission fragments are released. The
neutrons can be absorbed by other uranium atoms which fission, producing more neutrons. The
chain reaction is controlled by controlling the number of neutrons available for fission. The
number of neutrons available is controlled by the water in the nuclear reactor core, the
arrangement of neutron absorbing control rods inserted into the core, the design of the core, and
by controlling the void fraction and temperature of the coolant water (which both affect the
density of water which affects the neutrons available for the fission process).
The uranium fuel is contained inside a pressurized water reactor (“PWR”). The AP1000 is a
two-loop PWR. The fission of the uranium fuel releases heat to the surrounding water (reactor
cooling water), which under pressure does not boil, but through a heat exchanger (typically
referred to as a steam generator) results in a lower pressure water (that in the “secondary loop”)
to boil.
The cooling water inside the PWR is circulated through the nuclear core by internal pumps. This
cooling water system is termed the Reactor Coolant System (“RCS”). The RCS consists of two
heat transfer circuits, with each circuit containing one Delta-125 steam generator, two reactor
coolant pumps, and a single hot leg and two cold legs for circulating coolant between the reactor
and the steam generators. The system also includes a pressurizer, interconnecting piping, and the
valves and instrumentation necessary for operational control and the actuation of safeguards.
Each AP1000 unit has a 130-foot diameter freestanding containment vessel with four ring
sections and an upper and lower head.
The passive core cooling system provides protection for the facility against RCS leaks and
ruptures. The passive containment cooling system is the ultimate safety-related ultimate heat
sink for the facility. The passive containment cooling system cools the containment following an
accident to rapidly reduce the pressure via the natural circulation of air supplemented by water
evaporation to transfer heat through the steel containment vessel.
Main steam from the steam generator is routed to the HP section of the ST. The ST consists of a
double-flow HP ST section and three double-flow LP ST sections in a tandem-compound
configuration. As the steam exits the HP section it passes through a moisture separator and
reheater. The moisture separator and reheater dries and reheats the steam before it enters the LP
ST section, which improves the cycle efficiency and reduces moisture related erosion of the LP
ST blades. A portion of the steam is extracted from the HP and LP sections of the ST and with


                                              12-1
ST exhaust heats the condensate and feedwater before it is sent back to the reactor. The HP and
LP STs are connected via a common shaft that drives the generator which produces the electrical
power output of approximately 1,100 MW per unit.
The steam that exits the LP section of the ST, as well as the drains from the feedwater heaters,
are directed to the condenser. The condenser is a surface condensing (tube type) heat exchanger
that is maintained under vacuum to increase the turbine efficiency. The steam condenses on the
outside of the tubes and condenser cooling water is circulated through the inside of the tubes.
Numerous other systems are needed to support and provide redundancy for the cycle process
described herein. These include the residual heat removal system, the HP core flooder system,
and the LP core flooder system which are redundant systems and are designed to remove heat
from the reactor core in the event the normal core cooling system fails. Other support systems
include the liquid and solid radioactive waste systems which handle, control, and process
radioactive waste from the plant. The reactor containment ventilation system controls and filters
airborne radiation. Figure 12-1 presents a simplified process flow diagram for a PWR AN plant.
                     FIGURE 12-1 – AN DESIGN CONFIGURATION


12.2 ELECTRICAL AND CONTROL SYSTEMS
The AN Facility has one ST electric generator for each reactor. Each generator is a 60 Hz
machine rated at approximately 1,250 MVA with an output voltage of 24 kV. The ST electric
generator is connected through a generator circuit breaker to a GSU that is in turn connected
between two circuit breakers in the high-voltage bus in the facility switchyard through a
disconnect switch. The GSU increases the voltage from the electric generator from 24 kV to
interconnected transmission system high voltage.


                                              12-2
The AN Facility is controlled using a DCS. The DCS provides centralized control of the facility
by integrating the control systems provided with the reactor, ST and associated electric generator
and the control of BOP systems and equipment.

12.3 OFF-SITE REQUIREMENTS
Water for all processes at the AN Facility is obtained from one of several available water supply
options; however, water is typically sourced from an adjacent river, when possible. The
AN Facility uses a water treatment system and a high-efficiency reverse osmosis system to
reduce the dissolved solids from the cooling water and to provide distilled water. Wastewater is
sent to an adjacent river or other approved wastewater delivery point. Further, the electrical
interconnection from the AN on-site switchyard is effectuated by a connection to an adjacent
utility substation.

12.4 CAPITAL COST ESTIMATE
The base Cost Estimate for the AN Facility with a nominal capacity of 2,236 MW is $5,339/kW.
Table 12-1 summarizes the Cost Estimate categories for the AN Facility.


                                              12-3
TABLE 12-1 – BASE PLANT SITE CAPITAL COST ESTIMATE FOR AN
                                      Technology: AN
                            Nominal Capacity (ISO): 2,236,000 kW
                           Nominal Heat Rate (ISO): N/A Btu/kWh-HHV

      Capital Cost Category                                                          (000s) (October 1, 2010$)

      Civil Structural Material and Installation                                               1,732,000

      Mechanical Equipment Supply and
      Installation                                                                             3,400,000

      Electrical / I&C Supply and Installation                                                  630,000

      Project Indirects (1)                                                                    2,722,500

      EPC Cost before Contingency and Fee                                                      8,484,500

      Fee and Contingency                                                                      1,300,000

      Total Project EPC                                                                        9,784,500

      Owner Costs (excluding project finance)                                                  2,152,590

      Total Project Cost (excluding finance)                                                  11,937,090

      Total Project EPC                                                / kW                       4,376

      Owner Costs 22% (excluding project finance)                      / kW                        963

      Total Project Cost (excluding project finance)                   / kW                       5,339
      (1) Includes engineering, distributable costs, scaffolding, construction management, and start-up.


For this type of technology and power plant configuration, our regional adjustments took into
consideration the following: seismic design differences, remote location issues, labor wage and
productivity differences, location adjustments, owner cost differences, and the increase in
overheads associated with these five adjustments.
Seismic design differences among the various locations were based on U.S. seismic map
information that detailed the various seismic zones throughout the U.S. No cost increases were
associated with seismic Zone 0 and cost step increases were considered for Zones 1, 2, 3 and 4.
Remote location issues are related to geographic areas that typically require installation of man
camps, higher craft incentives, and higher per diems are generally required with respect to
construction, due to the fact that such areas are long distances from urban areas, where labor is
generally abundant. Remote location designations were also considered in locations where
higher equipment freight costs are typically incurred, which for example are regions not near
established rail or highway access. Remote locations related to the Advanced Nuclear Facility


                                                           12-4
include Fairbanks, Alaska; Honolulu, Hawaii; Albuquerque, New Mexico; Cheyenne, Wyoming;
and Cayey, Puerto Rico.
Labor wage and productivity differences were handled as discussed in Section 2.5.1, taking into
consideration the amount of labor we estimated for the AN Facility.
Location adjustments were made to locations where higher cost of living levels are incurred
and/or where population density generally correlates to higher construction costs for power and
other infrastructure projects. These locations include Alaska, California, Connecticut, Delaware,
District of Columbia, Hawaii, Illinois, Maine, Maryland, Massachusetts, Michigan, Minnesota,
New York, Ohio, and Wisconsin.
Owner costs were reviewed based on the need for utility upgrades and/or infrastructure costs
such as new facility transmission lines to tie to existing utility transmission substations or
existing transmission lines.
Table 12-2 presents the AN Facility capital cost variations for alternative U.S. plant locations.
                         TABLE 12-2 – LOCATION-BASED COSTS FOR AN
                                         (OCTOBER 1, 2010 DOLLARS)
                                              Base
                                             Project    Location      Delta Cost   Total Location
                                              Cost      Percent       Difference    Project Cost
             State                City       ($/kW)     Variation       ($/kW)         ($/kW)
  Alaska                 Anchorage            5,340       16.3%          868           6,208
  Alaska                 Fairbanks            5,340       16.4%          878           6,218
  Alabama                 Huntsville          5,340           -3.3%      (174)         5,166
  Arizona                 Phoenix             5,340           -2.4%      (126)         5,214
  Arkansas                Little Rock         5,340           -2.5%      (131)         5,209
  California              Los Angeles         5,340        9.5%          505           5,845
  California              Redding             5,340        4.6%          245           5,585
  California              Bakersfield         5,340        4.4%          236           5,576
  California              Sacramento          5,340        6.5%          348           5,688
  California              San Francisco       5,340       20.9%         1,114          6,454
  Colorado                Denver              5,340           -2.6%      (136)         5,204
  Connecticut             Hartford            5,340       14.7%          784           6,124
  Delaware                Dover               5,340       13.2%          707           6,047
  District of Columbia    Washington          5,340       23.9%         1,275          6,615
  Florida                 Tallahassee         5,340           -4.6%      (248)         5,092
  Florida                 Tampa               5,340           -2.1%      (114)         5,226
  Georgia                 Atlanta             5,340           -3.5%      (189)         5,151
  Hawaii                  Honolulu              0             0           0              0
  Idaho                   Boise               5,340           -1.6%      (86)          5,254
  Illinois               Chicago              5,340           9.0%       479           5,819
  Indiana                 Indianapolis        5,340           2.0%       108           5,448
  Iowa                    Davenport           5,340           -0.6%       (35)         5,305
  Iowa                    Waterloo            5,340           -3.7%      (200)         5,140
  Kansas                  Wichita             5,340           -2.8%      (151)         5,189
  Kentucky               Louisville           5,340           -2.4%      (126)         5,214


                                                       12-5
Base
                                  Project    Location      Delta Cost   Total Location
                                   Cost      Percent       Difference    Project Cost
         State         City       ($/kW)     Variation       ($/kW)         ($/kW)
Louisiana        New Orleans       5,340           -4.8%      (254)         5,086
Maine            Portland          5,340           0.4%        21           5,361
Maryland         Baltimore         5,340           3.4%       180           5,520
Massachusetts    Boston            5,340       18.3%          976           6,316
Michigan         Detroit           5,340            1.6%        83          5,423
Michigan         Grand Rapids      5,340           -3.3%      (174)         5,166
Minnesota        St. Paul          5,340           1.9%        99           5,439
Mississippi      Jackson           5,340           -3.2%      (173)         5,167
Missouri         St. Louis         5,340           2.8%       148           5,488
Missouri         Kansas City       5,340           1.3%        70           5,410
Montana          Great Falls       5,340           -1.9%      (100)         5,240
Nebraska         Omaha             5,340           -1.5%      (80)          5,260
New Hampshire    Concord           5,340           -0.8%      (41)          5,299
New Jersey       Newark            5,340           6.4%       340           5,680
New Mexico       Albuquerque       5,340           -1.6%      (83)          5,257
New York         New York          5,340       13.4%          718           6,058
New York         Syracuse          5,340        6.6%          355           5,695
Nevada           Las Vegas         5,340           4.1%       220           5,560
North Carolina   Charlotte         5,340           -4.1%      (218)         5,122
North Dakota     Bismarck          5,340           -3.3%      (176)         5,164
Ohio             Cincinnati        5,340           0.8%        45           5,385
Oregon           Portland          5,340           4.5%       239           5,579
Pennsylvania     Philadelphia      5,340            4.9%      263           5,603
Pennsylvania     Wilkes-Barre      5,340           -1.5%      (82)          5,258
Rhode Island     Providence        5,340           1.6%        87           5,427
South Carolina   Spartanburg       5,340           -5.1%      (272)         5,068
South Dakota     Rapid City        5,340           -4.4%      (237)         5,103
Tennessee        Knoxville         5,340           -3.7%      (200)         5,140
Texas            Houston           5,340           -3.9%      (210)         5,130
Utah             Salt Lake City    5,340           -1.5%      (80)          5,260
Vermont          Burlington        5,340           -2.3%      (122)         5,218
Virginia         Alexandria        5,340            6.2%      332           5,672
Virginia         Lynchburg         5,340           -0.1%      (6)           5,334
Washington       Seattle           5,340            5.8%      311           5,651
Washington       Spokane           5,340           -1.0%      (56)          5,284
West Virginia    Charleston        5,340           -0.8%      (42)          5,298
Wisconsin        Green Bay         5,340           1.0%        51           5,391
Wyoming          Cheyenne          5,340           3.5%       188           5,528
Puerto Rico      Cayey               0             0           0              0


                                            12-6
12.5 O&M ESTIMATE
In addition to the general items discussed in the section of this report entitled O&M Estimate, the
AN Facility includes provisions for major maintenance on the steam generators, STs, electric
generators, BOP systems, and the reactor (beyond refueling). Table 12-3 presents the O&M
expenses for the AN Facility.
                         TABLE 12-3 – O&M EXPENSES FOR AN
                     Technology:                                 AN
                 Fixed O&M Expense                         $88.75/kW-year
                Variable O&M Expense                         $2.04/MWh

12.6 ENVIRONMENTAL COMPLIANCE INFORMATION
Environmental compliance with respect to air emissions is effectively not necessary for the AN
Facility, as this technology does not combust a fuel as is the case for other non-renewable power
technologies. While there are environmental compliance considerations for a given nuclear
facility (e.g., spent nuclear fuel), only air emissions were considered in this report. Table 12-4
presents environmental emissions for the AN Facility.
                 TABLE 12-4 – ENVIRONMENTAL EMISSIONS FOR AN
                       Technology:                         AN
                          NOX                         0 lb/MMBtu
                           SO2                        0 lb/MMBtu
                           CO2                        0 lb/MMBtu


                                               12-7
13. BIOMASS COMBINED CYCLE (BCC)

13.1 MECHANICAL EQUIPMENT AND SYSTEMS
The Biomass Combined-Cycle (“BCC”) Facility utilizes approximately 500 tons per day of
wood (at 25 percent moisture), or 370 dry tons per day for the production of 20 MW net of
electricity. The facility consists of a biomass gasification system for the conversion of the wood
to syngas, a clean-up system for the syngas, and a combined-cycle plant using the syngas as fuel.
The gasification system consists of dual circulating fluid bed (“CFB”) units (one gasifier and one
combustor) connected by a sand circulation system. Related equipment includes the wood feed
system, the product gas quench, ash handling, steam supply and typical BOP equipment.
The wood is fed to the circulating fluid bed gasifier through a standard system of lock hoppers,
live bottom bins and feed screws. The lock hoppers are purged with nitrogen to keep the
produced fuel gas from escaping.
The gasifier is a refractory-lined vessel with a sand-type carrier and requires a LP steam source.
The primary purpose of the steam is to maintain a reducing environment in the gasifier to enable
pure gasification and not partial oxidation conditions. The gasification CFB is essentially an
entrained flow reactor, which operates between 1,400F and 1,500F. The two products of the
gasifier are a medium-heating value gas (approximately 450 Btu/scf dry) and non-converted
char. A small amount of condensable “tars” are also produced. The gases are directed to a
clean-up system to remove the entrained tars.
The CFB combustor unit burns the char produced in the gasifier. The char combustor operates at
approximately 1,800F. The flue gas from the char combustor goes to a boiler to recover the
excess sensible energy.
The two CFBs are connected by the sand circulation system. The purpose of this system is to
transfer the char and circulating sand from the gasifier to the combustor, where the char is
burned to reheat the sand. This hotter sand is then returned to the gasifier to provide the energy
to convert the solid wood to a gas. The sand transfer system consists of mechanical cyclones
(two in series for each CFB) and a sand inventory pot for each leg of the configuration. An
overflow system, with some fluidizing steam in the pot, is used to regulate the flow from the
gasifier to the combustor.
The syngas clean-up system consists of a reformer to convert the tars and other hydrocarbons to
CO and hydrogen in an isothermal fluidized bed reactor. The hot syngas is cooled by producing
steam to be used in the combined cycle. A wet scrubber removes particulates, NH3 and residual
tars. The excess scrubber water is sent off-site to a wastewater treatment facility.
The syngas is then compressed to the required pressure for use in the CT. The BCC Facility is
based on a single CT, which produces approximately 15 MW of electricity. The CT exhaust is
sent to an HRSG. The HRSG is equipped with an SCR to reduce NOX emissions. Both the
steam generated in the HRSG and the steam generated the cooling of the combustion flue gas
and the syngas are superheated and sent to the ST. The ST output is approximately 9 MW. The
total gross output is approximately 24 MW. The internal power load is approximately 4 MW for
a net power output of about 20 MW.


                                              13-1
Nitrogen is required for start-up and shutdown. A separate steam system is required for start-up.
NH3 is required for operation of the two SCRs for reducing NOX emissions. A flare system is
required for normal operation to eliminate volatile organics from the scrubbing system, and for
start-up and shutdown of the process. Figure 13-1 presents the BCC process flow diagram,
where the “Power Block” is based on a traditional combined-cycle configuration, as is often the
case for gasification derivative plants.
                    FIGURE 13-1 – BCC DESIGN CONFIGURATION


13.2 ELECTRICAL AND CONTROL SYSTEMS
The BCC Facility has one CT electric generator and one ST electric generator. The generator for
the CT is a 60 Hz machine rated at approximately 17 MVA with an output voltage of 13.8 kV.
The ST electric generator is a 60 Hz machine rated at approximately 10 MVA with an output
voltage of 13.8 kV. The generator breakers for the CT and ST electric generators are bussed
together in 15 kV class switchgear that is connected to a high-voltage transmission system at the
facility switchyard via a circuit breaker, GSU, and a disconnect switch. The GSU increases the
voltage from the electric generators from 13.8 kV to interconnected transmission system high
voltage.
The BCC Facility is controlled using a DCS. The DCS provides centralized control of the
facility by integrating the control systems provided with each individual CT and associated


                                              13-2
electric generator, ST and associated electric generator, and the control of BOP systems and
equipment.

13.3 OFF-SITE REQUIREMENTS
Biomass is delivered to the BCC Facility by rail, truck or barge. Water for all processes at the
BCC Facility is obtained from one of several available water sources. The BCC Facility uses a
water treatment system and a high-efficiency reverse osmosis system to reduce the dissolved
solids from the cooling water and to provide distilled water for HRSG makeup. Wastewater is
sent to a municipal wastewater system or other available wastewater delivery point. Further, the
electrical interconnection from the BCC Facility on-site switchyard is effectuated by a
connection to an adjacent utility substation.

13.4 CAPITAL COST ESTIMATE
The base Cost Estimate for the BCC Facility with a nominal capacity of 20 MW is $7,573/kW.
Table 13-1 summarizes the Cost Estimate categories for the BCC Facility.


                                             13-3
TABLE 13-1 – BASE PLANT SITE CAPITAL COST ESTIMATE FOR BCC
                                      Technology: BCC
                            Nominal Capacity (ISO): 20,000 kW
                           Nominal Heat Rate (ISO): 12,350 Btu/kWh-HHV

      Capital Cost Category                                                          (000s) (October 1, 2010$)

      Civil Structural Material and Installation                                                 16,459

      Mechanical Equipment Supply and
      Installation                                                                               70,137

      Electrical / I&C Supply and Installation                                                   11,267

      Project Indirects (1)                                                                      21,207

      EPC Cost before Contingency and Fee                                                       119,070

      Fee and Contingency                                                                        12,500

      Total Project EPC                                                                         131,570

      Owner Costs (excluding project finance)                                                    26,314

      Total Project Cost (excluding finance)                                                    157,884

      Total Project EPC                                                / kW                       6,578

      Owner Costs 20% (excluding project finance)                      / kW                       1,316

      Total Project Cost (excluding project finance)                   / kW                       7,894

      (1) Includes engineering, distributable costs, scaffolding, construction management, and start-up.


For this type of technology and power plant configuration, our regional adjustments took into
consideration the following: outdoor installation considerations, seismic design differences,
remote location issues, labor wage and productivity differences, location adjustments, owner cost
differences, and the increase in overheads associated with these six adjustments.

Outdoor installation locations are considered in geographic areas where enclosed structures for
the boilers would not be required due to the low probability of freezing. The locations that
included outdoor installation are Alabama, Arizona, Arkansas, Florida, Georgia, Hawaii,
Louisiana, Mississippi, New Mexico, South Carolina, and Puerto Rico.
Seismic design differences among the various locations were based on U.S. seismic map
information that detailed the various seismic zones throughout the U.S. No cost increases were
associated with seismic Zone 0 and cost step increases were considered for Zones 1, 2, 3 and 4.


                                                           13-4
Remote location issues are related to geographic areas that typically require installation of man
camps, higher craft incentives, and higher per diems are generally required with respect to
construction, due to the fact that such areas are long distances from urban areas, where labor is
generally abundant. Remote location designations were also considered in locations where
higher equipment freight costs are typically incurred, which for example are regions not near
established rail or highway access. Remote locations related to the BCC include Fairbanks,
Alaska; Honolulu, Hawaii; Albuquerque, New Mexico; Cheyenne, Wyoming; and Cayey, Puerto
Rico.
Labor wage and productivity differences were handled as discussed in Section 2.5.1, taking into
consideration the amount of labor we estimated for the BCC Facility.
Location adjustments were made to locations where higher cost of living levels are incurred
and/or where population density generally correlates to higher construction costs for power and
other infrastructure projects. These locations include Alaska, California, Connecticut, Delaware,
District of Columbia, Hawaii, Illinois, Maine, Maryland, Massachusetts, Michigan, Minnesota,
New York, Ohio, and Wisconsin.
Owner costs were reviewed based on the need for utility upgrades and/or infrastructure costs
such as new facility transmission lines to tie to existing utility transmission substations or
existing transmission lines.
Table 13-2 presents the BCC Facility capital cost variations for alternative U.S. plant locations.


                                               13-5
TABLE 13-2 – LOCATION-BASED COSTS FOR BCC
                                       (OCTOBER 1, 2010 DOLLARS)
                                            Base
                                           Project    Location      Delta Cost   Total Location
                                            Cost      Percent       Difference    Project Cost
           State                City       ($/kW)     Variation       ($/kW)         ($/kW)
Alaska                  Anchorage           7,900       14.0%         1,104          9,004
Alaska                  Fairbanks           7,900       15.2%         1,197          9,097
Alabama                 Huntsville          7,900           -6.0%      (472)         7,428
Arizona                 Phoenix               0             0.0%        0              0
Arkansas                Little Rock         7,900           -5.0%      (392)         7,508
California              Los Angeles         7,900        7.2%          566           8,466
California              Redding             7,900        3.3%          262           8,162
California              Bakersfield         7,900        3.0%          237           8,137
California              Sacramento          7,900        6.8%          539           8,439
California              San Francisco       7,900       19.6%         1,547          9,447
Colorado                Denver              7,900           -9.2%      (724)         7,176
Connecticut             Hartford            7,900       11.9%          940           8,840
Delaware                Dover               7,900           9.7%       768           8,668
District of Columbia    Washington          7,900       15.1%         1,196          9,096
Florida                 Tallahassee         7,900           -8.0%      (635)         7,265
Florida                 Tampa               7,900           -3.5%      (274)         7,626
Georgia                 Atlanta             7,900           -6.5%      (511)         7,389
Hawaii                  Honolulu            7,900       29.3%         2,311          10,211
Idaho                   Boise               7,900           -3.9%      (304)         7,596
Illinois                Chicago             7,900       13.6%         1,073          8,973
Indiana                 Indianapolis        7,900           0.4%        35           7,935
Iowa                    Davenport           7,900           -1.2%       (93)         7,807
Iowa                    Waterloo            7,900           -6.8%      (539)         7,361
Kansas                  Wichita             7,900           -5.6%      (444)         7,456
Kentucky                Louisville          7,900           -4.7%      (375)         7,525
Louisiana               New Orleans         7,900           -8.3%      (653)         7,247
Maine                   Portland            7,900           -3.0%      (236)         7,664
Maryland                Baltimore           7,900           0.1%        10           7,910
Massachusetts           Boston              7,900       18.5%         1,459          9,359
Michigan                Detroit             7,900            2.4%       188          8,088
Michigan                Grand Rapids        7,900           -5.9%      (469)         7,431
Minnesota               St. Paul            7,900           2.5%       200           8,100
Mississippi             Jackson             7,900           -5.9%      (469)         7,431
Missouri                St. Louis           7,900           2.8%       220           8,120
Missouri                Kansas City         7,900           1.5%       119           8,019
Montana                 Great Falls         7,900           -4.8%      (379)         7,521
Nebraska                Omaha               7,900           -3.2%      (252)         7,648
New Hampshire           Concord             7,900           -2.3%      (182)         7,718
New Jersey              Newark              7,900       11.2%          882           8,782


                                                     13-6
Base
                                       Project    Location         Delta Cost     Total Location
                                        Cost      Percent          Difference      Project Cost
           State           City        ($/kW)     Variation          ($/kW)           ($/kW)
  New Mexico          Albuquerque         0             0.0%           0                0
  New York            New York          7,900       23.6%            1,866            9,766
  New York            Syracuse          7,900        3.3%             259             8,159
  Nevada              Las Vegas           0             0.0%           0                0
  North Carolina      Charlotte         7,900           -8.3%         (658)           7,242
  North Dakota        Bismarck          7,900           -6.0%         (476)           7,424
  Ohio                Cincinnati        7,900           -1.7%         (134)           7,766
  Oregon              Portland          7,900           3.1%          246             8,146
  Pennsylvania        Philadelphia      7,900            8.1%          639            8,539
  Pennsylvania        Wilkes-Barre      7,900           -3.7%         (293)           7,607
  Rhode Island        Providence        7,900           2.1%          162             8,062
  South Carolina      Spartanburg       7,900           -9.8%         (771)           7,129
  South Dakota        Rapid City        7,900           -8.1%         (639)           7,261
  Tennessee           Knoxville         7,900           -7.3%         (575)           7,325
  Texas               Houston           7,900           -7.2%         (568)           7,332
  Utah                Salt Lake City      0             0.0%           0                0
  Vermont             Burlington        7,900           -5.1%         (400)           7,500
  Virginia            Alexandria        7,900            2.5%          198            8,098
  Virginia            Lynchburg         7,900           -3.4%         (271)           7,629
  Washington          Seattle           7,900            5.6%          441            8,341
  Washington          Spokane           7,900           -2.8%         (222)           7,678
  West Virginia       Charleston        7,900           -1.9%         (149)           7,751
  Wisconsin           Green Bay         7,900           -1.1%         (83)            7,817
  Wyoming             Cheyenne            0             0.0%           0                0
  Puerto Rico         Cayey             7,900           -3.7%         (290)           7,610

13.5 O&M ESTIMATE
In addition to the general items discussed in the section of this report entitled O&M Estimate, the
BCC Facility include the major maintenance for the CT, as well as the BOP, including the ST,
associated electric generator, HRSG, and emissions reduction catalysts. These major
maintenance expenses are included with the VOM expense for this technology and are given on
an average basis across the MWhs incurred. Typically, significant overhauls on a BCC Facility
occur no less frequently than 8,000 operating hour intervals, with more significant major outages
occurring on 24,000 hour intervals. Additionally, major maintenance needs to be completed on
the gasifier, including the refractory, which due to the lower operating temperature (as compared
to the IGCC Facility discussed above) only needs replacing approximately every 10 years.
Table 13-3 presents the O&M expenses for the BCC Facility.
                          TABLE 13-3 – O&M EXPENSES FOR BCC
                        Technology:                                   BCC
                    Fixed O&M Expense                           $338.79/kW-year
                   Variable O&M Expense                           $16.64/MWh


                                                 13-7
13.6 ENVIRONMENTAL COMPLIANCE INFORMATION
The BCC Facility utilizes syngas combustors (which do not have DLN) in the CT and best
available burner technology with respect to the duct burners in the HRSGs to manage the
production of NOX and CO. Additional control of NOX and CO is accomplished through an SCR
and an oxidization catalyst, respectively. SO2 in the IGCC is managed through the use of low-
sulfur biomass feedstocks. The BCC does not include any control devices for CO2, which is
proportional to the heat rate (inversely proportional to the efficiency) of the technology. Water,
wastewater, and solid waste compliance are achieved through traditional on-site and off-site
methods, and the costs for such compliance are included in the O&M Estimate for the BCC
Facility. Table 13-4 presents environmental emissions for the BCC Facility.
                TABLE 13-4 – ENVIRONMENTAL EMISSIONS FOR BCC
                      Technology:                        BCC
                         NOX                       0.054 lb/MMBtu
                          SO2                        0 lb/MMBtu
                          CO2                       195 lb/MMBtu


                                              13-8
14. BIOMASS BUBBLING FLUIZED BED (BBFB)

14.1 MECHANICAL EQUIPMENT AND SYSTEMS
The Biomass BFB (“BBFB”) Facility utilizes approximately 2,000 tons per day of wood (at
50 percent maximum moisture) for the production of 50 MW net of electricity. The BBFB
Facility consists of a BFB boiler, which will flow to the ST. Steam leaving the ST will be
condensed to water in a shell and tube surface condenser. The water will be pumped from the
“hotwell” of the condenser through a series of feedwater heaters for purposes of pre-heating the
water with ST extraction steam. The combination of feedwater heating and waste heat flowing
through the economizer is included to improve cycle efficiency. The water will enter the first
feedwater heater where it will be heated using extraction steam from the ST. The water will then
flow to the deaerating feedwater heater and into an electric-driven boiler feed pump where the
pressure of the water will be increased to approximately 1,800 psia. After leaving the boiler feed
pump, the water will flow through two more feedwater heaters. After exiting the last feedwater
heater, the water will flow to the economizer section of the BFB boiler for delivery to the
combustion section where it will be converted back to steam and the cycle will be repeated. The
cooling tower is to be used to cool the circulating water that is used to condense the steam inside
the condenser.
In a BFB boiler, a portion of air is introduced through the bottom of the combustor. The bottom
of the bed is supported by refractory walls or water-cooled membrane with specially designed air
nozzles which distribute the air uniformly. The fuel and limestone are fed into the lower bed. In
the presence of fluidizing air, the fuel and limestone quickly and uniformly mix under the
turbulent environment and behave like a fluid. Carbon particles in the fuel are exposed to the
combustion air. The balance of combustion air is introduced at the top of the lower, dense bed.
This staged combustion limits the formation of NOX. The advantages of BFB boiler technology
include fuel flexibility, low SO2 emissions, low NOX emissions, and high combustion efficiency.
                     FIGURE 14-1 – BCC DESIGN CONFIGURATION


                                               14-1
14.2 ELECTRICAL AND CONTROL SYSTEMS
The BBFB Facility has one ST electric generator. The generator for the ST is a 60 Hz machine
rated at approximately 65 MVA with an output voltage of 13.8 kV. The generator breakers for
the ST electric generator are bussed together in 15 kV class switchgear that is connected to a
high-voltage transmission system at the facility switchyard via a circuit breaker, GSU, and a
disconnect switch. The GSU increases the voltage from the electric generators from 13.8 kV to
interconnected transmission system high voltage.
The BBFB Facility is controlled using a DCS. The DCS provides centralized control of the
facility by integrating the control systems provided with the ST and associated electric generator
and the control of BOP systems and equipment.

14.3 OFF-SITE REQUIREMENTS
Biomass is delivered to the BBFBFacility by rail, truck or barge. Water for all processes at the
BBFB Facility is obtained from one of several available water sources. The BBFB Facility uses
a water treatment system and a high-efficiency reverse osmosis system to reduce the dissolved
solids from the cooling water and to provide distilled water for HRSG makeup. Wastewater is
sent to a municipal wastewater system or other available wastewater delivery point. Further, the
electrical interconnection from the BBFB Facility on-site switchyard is effectuated by a
connection to an adjacent utility substation.

14.4 CAPITAL COST ESTIMATE
The base Cost Estimate for the BBFB Facility with a nominal capacity of 50 MW is $3,860/kW.
Table 14-1 summarizes the Cost Estimate categories for the BBFB Facility.


                                              14-2
TABLE 14-1 – BASE PLANT SITE CAPITAL COST ESTIMATE FOR BBFB
                                      Technology: BBFB
                            Nominal Capacity (ISO): 50,000 kW
                           Nominal Heat Rate (ISO): 13,500 Btu/kWh-HHV

      Capital Cost Category                                                          (000s) (October 1, 2010$)

      Civil Structural Material and Installation                                                 13,650

      Mechanical Equipment Supply and
      Installation                                                                               67,200

      Electrical / I&C Supply and Installation                                                   20,000

      Project Indirects (1)                                                                      40,250

      EPC Cost before Contingency and Fee                                                       141,100

      Fee and Contingency                                                                        19,754

      Total Project EPC                                                                         160,854

      Owner Costs (excluding project finance)                                                    32,171

      Total Project Cost (excluding finance)                                                    193,025

      Total Project EPC                                                / kW                       3,217

      Owner Costs 20% (excluding project finance)                      / kW                        643

      Total Project Cost (excluding project finance)                   / kW                       3,860

      (1) Includes engineering, distributable costs, scaffolding, construction management, and start-up.


For this type of technology and power plant configuration, our regional adjustments took into
consideration the following: outdoor installation considerations, seismic design differences,
remote location issues, labor wage and productivity differences, location adjustments, owner cost
differences, and the increase in overheads associated with these six adjustments.

Outdoor installation locations are considered in geographic areas where enclosed structures for
the boilers would not be required due to the low probability of freezing. The locations that
included outdoor installation are Alabama, Arizona, Arkansas, Florida, Georgia, Hawaii,
Louisiana, Mississippi, New Mexico, South Carolina, and Puerto Rico.
Seismic design differences among the various locations were based on U.S. seismic map
information that detailed the various seismic zones throughout the U.S. No cost increases were
associated with seismic Zone 0 and cost step increases were considered for Zones 1, 2, 3 and 4.


                                                           14-3
Remote location issues are related to geographic areas that typically require installation of man
camps, higher craft incentives, and higher per diems are generally required with respect to
construction, due to the fact that such areas are long distances from urban areas, where labor is
generally abundant. Remote location designations were also considered in locations where
higher equipment freight costs are typically incurred, which for example are regions not near
established rail or highway access. Remote locations related to the BCC include Fairbanks,
Alaska; Honolulu, Hawaii; Albuquerque, New Mexico; Cheyenne, Wyoming; and Cayey, Puerto
Rico.
Labor wage and productivity differences were handled as discussed in Section 2.5.1, taking into
consideration the amount of labor we estimated for the BCC Facility.
Location adjustments were made to locations where higher cost of living levels are incurred
and/or where population density generally correlates to higher construction costs for power and
other infrastructure projects. These locations include Alaska, California, Connecticut, Delaware,
District of Columbia, Hawaii, Illinois, Maine, Maryland, Massachusetts, Michigan, Minnesota,
New York, Ohio, and Wisconsin.
Owner costs were reviewed based on the need for utility upgrades and/or infrastructure costs
such as new facility transmission lines to tie to existing utility transmission substations or
existing transmission lines.
Table 14-2 presents the BBFB Facility capital cost variations for alternative U.S. plant locations.


                                               14-4
TABLE 14-2– LOCATION-BASED COSTS FOR BBFB
                                       (OCTOBER 1, 2010 DOLLARS)
                                            Base
                                           Project    Location      Delta Cost   Total Location
                                            Cost      Percent       Difference    Project Cost
           State                City       ($/kW)     Variation       ($/kW)         ($/kW)
Alaska                  Anchorage           3,860       25.8%          995           4,855
Alaska                  Fairbanks           3,860       27.9%         1,076          4,936
Alabama                 Huntsville          3,860           -9.7%      (376)         3,484
Arizona                 Phoenix               0             0.0%        0              0
Arkansas                Little Rock         3,860           -8.1%      (311)         3,549
California              Los Angeles         3,860       13.4%          516           4,376
California              Redding             3,860        6.3%          242           4,102
California              Bakersfield         3,860        5.7%          221           4,081
California              Sacramento          3,860       11.9%          460           4,320
California              San Francisco       3,860       35.6%         1,373          5,233
Colorado                Denver              3,860           -8.2%      (318)         3,542
Connecticut             Hartford            3,860       22.9%          882           4,742
Delaware                Dover               3,860       19.3%          745           4,605
District of Columbia    Washington          3,860       31.6%         1,219          5,079
Florida                 Tallahassee         3,860       -13.1%         (506)         3,354
Florida                 Tampa               3,860        -5.7%         (221)         3,639
Georgia                 Atlanta             3,860       -10.5%         (407)         3,453
Hawaii                  Honolulu            3,860       58.2%         2,248          6,108
Idaho                   Boise               3,860           -6.2%      (238)         3,622
Illinois                Chicago             3,860       22.7%          875           4,735
Indiana                 Indianapolis        3,860           1.5%        56           3,916
Iowa                    Davenport           3,860        -1.9%          (74)         3,786
Iowa                    Waterloo            3,860       -11.0%         (426)         3,434
Kansas                  Wichita             3,860           -9.1%      (350)         3,510
Kentucky                Louisville          3,860           -7.6%      (295)         3,565
Louisiana               New Orleans         3,860       -13.5%         (520)         3,340
Maine                   Portland            3,860           -4.0%      (156)         3,704
Maryland                Baltimore           3,860           1.6%        63           3,923
Massachusetts           Boston              3,860       33.5%         1,292          5,152
Michigan                Detroit             3,860            3.9%       150          4,010
Michigan                Grand Rapids        3,860           -9.6%      (371)         3,489
Minnesota               St. Paul            3,860           4.3%       166           4,026
Mississippi             Jackson             3,860           -9.7%      (373)         3,487
Missouri                St. Louis           3,860           4.7%       181           4,041
Missouri                Kansas City         3,860           2.5%        96           3,956
Montana                 Great Falls         3,860           -4.8%      (185)         3,675
Nebraska                Omaha               3,860           -5.1%      (198)         3,662
New Hampshire           Concord             3,860           -3.6%      (141)         3,719
New Jersey              Newark              3,860       18.1%          698           4,558


                                                     14-5
Base
                                       Project    Location         Delta Cost     Total Location
                                        Cost      Percent          Difference      Project Cost
           State           City        ($/kW)     Variation          ($/kW)           ($/kW)
  New Mexico          Albuquerque       3,860           0.0%         (3,860)            -
  New York            New York          3,860       38.3%            1,477            5,337
  New York            Syracuse          3,860        7.5%             288             4,148
  Nevada              Las Vegas           0             0.0%           0                0
  North Carolina      Charlotte         3,860       -13.4%            (517)           3,343
  North Dakota        Bismarck          3,860           -9.7%         (376)           3,484
  Ohio                Cincinnati        3,860           -2.0%         (77)            3,783
  Oregon              Portland          3,860           5.9%          228             4,088
  Pennsylvania        Philadelphia      3,860       13.1%              507            4,367
  Pennsylvania        Wilkes-Barre      3,860       -5.9%             (229)           3,631
  Rhode Island        Providence        3,860           3.4%          131             3,991
  South Carolina      Spartanburg       3,860       -15.8%            (611)           3,249
  South Dakota        Rapid City        3,860       -13.1%            (505)           3,355
  Tennessee           Knoxville         3,860       -11.7%            (453)           3,407
  Texas               Houston           3,860       -11.6%            (449)           3,411
  Utah                Salt Lake City      0             0.0%           0                0
  Vermont             Burlington        3,860           -8.1%         (314)           3,546
  Virginia            Alexandria        3,860            6.2%          240            4,100
  Virginia            Lynchburg         3,860           -4.8%         (186)           3,674
  Washington          Seattle           3,860            9.9%          382            4,242
  Washington          Spokane           3,860           -4.5%         (172)           3,688
  West Virginia       Charleston        3,860           -3.0%         (117)           3,743
  Wisconsin           Green Bay         3,860           -1.0%         (39)            3,821
  Wyoming             Cheyenne            0             0.0%           0                0
  Puerto Rico         Cayey             3,860           -5.5%         (213)           3,647

14.5 O&M ESTIMATE
In addition to the general items discussed in the section of this report entitled O&M Estimate, the
BBFB Facility includes the major maintenance for the ST and associated electric generator, as
well as the BOP. These major maintenance expenses are included with the VOM expense for
this technology and are given on an average basis across the MWhs incurred. Typically,
significant overhauls on a BBFB Facility occur no less frequently than 6 to 8 years. Table 14-3
presents the O&M expenses for the BBFB Facility.
                          TABLE 14-3 – O&M EXPENSES FOR BCC
                        Technology:                                   BCC
                    Fixed O&M Expense                           $100.50/kW-year
                   Variable O&M Expense                            $5.0/MWh


                                                 14-6
14.6 ENVIRONMENTAL COMPLIANCE INFORMATION
The BBFB Facility utilizes BFB combustion to control NOX and CO. SO2 in the BFB is
managed through the use of low-sulfur biomass feedstocks. The BBFB Facility does not include
any control devices for CO2, which is proportional to the heat rate (inversely proportional to the
efficiency) of the technology. Water, wastewater, and solid waste compliance are achieved
through traditional on-site and off-site methods, and the costs for such compliance are included
in the O&M Estimate for the BBFB Facility. Table 14-4 presents environmental emissions for
the BBFB Facility.
               TABLE 14-4 – ENVIRONMENTAL EMISSIONS FOR BBFB
                      Technology:                         BBFB
                         NOX                         0.08 lb/MMBtu
                          SO2                          0 lb/MMBtu
                          CO2                        195 lb/MMBtu


                                              14-7
15. FUEL CELL (FC) MECHANICAL EQUIPMENT AND SYSTEMS
The Fuel Cell (“FC”) Facility utilizes multiple phosphoric acid fuel cell units, each with a power
output of 400 kW, for a total output of 10 MW. The fuel cells convert chemical energy directly
into electricity from natural gas and air vapor and produce heat and water vapor as byproducts.
The fuel (the reactant) is introduced continuously to the anode side of the unit cell while air (the
oxidant) is introduced continuously into the cathode side via a blower. In a fuel cell, electricity
is produced by ionic transfer across an electrolyte that separates the fuel from the air. A high
temperature fuel cell produces electricity by splitting a molecule of the oxidant into its ionic
components at the cathode, passing ions through the electrolyte (e.g. in the case of the
FC Facility, a phosphoric acid ion) and then reacting the ions with the fuel at the anode to
produce heat to allow the reaction to occur. During this ionic transfer process, two electrons are
stripped from each ion to which develops a voltage and current. Since each fuel cell develops a
relatively low voltage, the cells are stacked to produce a higher, more useful voltage. Depending
on the type of fuel cell, high temperature waste heat from the process may be available for
cogeneration applications. Figure 15-1 presents the fuel cell process flow diagram.
                      FIGURE 15-1 – FC DESIGN CONFIGURATION


15.1 ELECTRICAL AND CONTROL SYSTEMS
Each fuel cell stack generates DC electric power. These stacks are connected to DC-to-AC
inverters that produce an output of 60 Hz, three-phase 480 volt (“V”) AC electric power voltage.
The inverters also provide power quality control and protection when designed to IEEE
Standards. The fuel cell units are connected through circuit breakers to a switchgear bus that
combines the output of the fuel cell units for a total output of 10 MW. The switchgear is
connected through a circuit breaker to the local utility distribution system.
Each individual fuel cell module has its own autonomous control system with an overall data
acquisition system for the combined FC Facility.

15.2 OFF-SITE REQUIREMENTS
Natural gas is delivered to the FC Facility through a lateral or in an urban environment,
potentially through the local distribution company infrastructure. Water for all processes at the


                                               15-1
FC Facility is obtained from one of several available water sources, but given that the water
needs are low, a municipal (potable) water source would be preferable. Wastewater is sent to a
municipal wastewater system. Further, the electrical interconnection from the FC Facility is into
the local grid distribution infrastructure.

15.3 CAPITAL COST ESTIMATE
The base Cost Estimate for the FC Facility with a nominal capacity of 10 MW is $9,960/kW.
Table 15-1 summarizes the Cost Estimate categories for the FC Facility.
        TABLE 15-1 – BASE PLANT SITE CAPITAL COST ESTIMATE FOR FC
                                       Technology: FC
                             Nominal Capacity (ISO): 10,000 kW
                            Nominal Heat Rate (ISO): 9,500 Btu/kWh-HHV

      Capital Cost Category                                                           (000s) (October 1, 2010$)

      Civil Structural Material and Installation                                                   3,148

      Mechanical Equipment Supply and
      Installation                                                                                 49,925

      Electrical / I&C Supply and Installation                                                     2,050

      Project Indirects (1)                                                                        3,473

      EPC Cost before Contingency and Fee                                                          58,596

      Fee and Contingency                                                                          4,688

      Total Project EPC                                                                            63,284

      Owner Costs (excluding project finance)                                                      5,063

      Total Project Cost (excluding finance)                                                       68,347

      Total Project EPC                                                 / kW                       6,328

      Owner Costs 8% (excluding project finance)                        / kW                         500

      Total Project Cost (excluding project finance)                    / kW                       6,835

      (1)   Includes engineering, distributable costs, scaffolding, construction management, and start-up.


For this type of technology and power plant configuration, our regional adjustments took into
consideration the following: seismic design differences, remote location issues, labor wage and
productivity differences, location adjustments, owner cost differences, and the increase in
overheads associated with these five adjustments.


                                                             15-2
Seismic design differences among the various locations were based on U.S. seismic map
information that detailed the various seismic zones throughout the U.S. No cost increases were
associated with seismic Zone 0 and cost step increases were considered for Zones 1, 2, 3 and 4.
Remote location issues are related to geographic areas that typically require installation of man
camps, higher craft incentives, and higher per diems are generally required with respect to
construction, due to the fact that such areas are long distances from urban areas, where labor is
generally abundant. Remote location designations were also considered in locations where
higher equipment freight costs are typically incurred, which for example are regions not near
established rail or highway access. Remote locations related to the FC Facility include
Fairbanks, Alaska; Honolulu, Hawaii; Albuquerque, New Mexico; Cheyenne, Wyoming; and
Cayey, Puerto Rico.
Labor wage and productivity differences were handled as discussed in Section 2.5.1, taking into
consideration the amount of labor we estimated for the FC Facility.
Location adjustments were made to locations where higher cost of living levels are incurred
and/or where population density generally correlates to higher construction costs for power and
other infrastructure projects. These locations include Alaska, California, Connecticut, Delaware,
District of Columbia, Hawaii, Illinois, Maine, Maryland, Massachusetts, Michigan, Minnesota,
New York, Ohio, and Wisconsin.
Owner costs were reviewed based on the need for utility upgrades and/or infrastructure costs
such as new facility transmission lines to tie to existing utility transmission substations or
existing transmission lines.
Table 15-2 presents the FC Facility capital cost variations for alternative U.S. plant locations.


                                                15-3
TABLE 15-2 – LOCATION-BASED COSTS FOR FC
                                      (OCTOBER 1, 2010 DOLLARS)
                                           Base
                                          Project    Location      Delta Cost   Total Location
                                           Cost      Percent       Difference    Project Cost
           State               City       ($/kW)     Variation       ($/kW)         ($/kW)
Alaska                 Anchorage           6,835       12.7%          871           7,706
Alaska                 Fairbanks           6,835       18.4%         1,255          8,090
Alabama                Huntsville          6,835           -4.6%      (312)         6,523
Arizona                Phoenix             6,835           -3.5%      (240)         6,595
Arkansas               Little Rock         6,835           -3.7%      (251)         6,584
California             Los Angeles         6,835        4.3%          293           7,128
California             Redding             6,835        1.7%          119           6,954
California             Bakersfield         6,835        2.2%          150           6,985
California             Sacramento          6,835        4.6%          313           7,148
California             San Francisco       6,835       10.7%          733           7,568
Colorado               Denver              6,835           -4.1%      (278)         6,557
Connecticut            Hartford            6,835           4.4%       299           7,134
Delaware               Dover               6,835           2.4%       166           7,001
District of Columbia   Washington          6,835           1.9%       127           6,962
Florida                Tallahassee         6,835           -6.3%      (432)         6,403
Florida                Tampa               6,835           -2.6%      (179)         6,656
Georgia                Atlanta             6,835           -5.0%      (340)         6,495
Hawaii                 Honolulu            6,835       12.0%          817           7,652
Idaho                  Boise               6,835           -3.0%      (203)         6,632
Illinois               Chicago             6,835       10.0%          681           7,516
Indiana                Indianapolis        6,835           -0.6%      (42)          6,793
Iowa                   Davenport           6,835           -1.0%       (65)         6,770
Iowa                   Waterloo            6,835           -5.5%      (378)         6,457
Kansas                 Wichita             6,835           -4.5%      (306)         6,529
Kentucky               Louisville          6,835           -3.8%      (258)         6,577
Louisiana              New Orleans         6,835           -6.5%      (445)         6,390
Maine                  Portland            6,835           -2.4%      (162)         6,673
Maryland               Baltimore           6,835           -1.3%      (86)          6,749
Massachusetts          Boston              6,835           9.7%       662           7,497
Michigan               Detroit             6,835            2.3%       156          6,991
Michigan               Grand Rapids        6,835           -4.5%      (310)         6,525
Minnesota              St. Paul            6,835           1.9%       133           6,968
Mississippi            Jackson             6,835           -4.5%      (310)         6,525
Missouri               St. Louis           6,835           2.6%       180           7,015
Missouri               Kansas City         6,835           1.4%        94           6,929
Montana                Great Falls         6,835           -3.1%      (209)         6,626
Nebraska               Omaha               6,835           -2.5%      (172)         6,663
New Hampshire          Concord             6,835           -1.4%      (98)          6,737
New Jersey             Newark              6,835       10.1%          689           7,524


                                                    15-4
Base
                                       Project    Location        Delta Cost      Total Location
                                        Cost      Percent         Difference       Project Cost
           State           City        ($/kW)     Variation         ($/kW)            ($/kW)
  New Mexico          Albuquerque        6,835          -2.8%        (194)              6,641
  New York            New York           6,835       22.2%          1,514               8,349
  New York            Syracuse           6,835       -0.7%           (48)               6,787
  Nevada              Las Vegas          6,835          3.7%         253                7,088
  North Carolina      Charlotte          6,835          -6.6%        (451)              6,384
  North Dakota        Bismarck           6,835          -4.6%        (314)              6,521
  Ohio                Cincinnati         6,835          -2.6%        (180)              6,655
  Oregon              Portland           6,835          1.6%         107                6,942
  Pennsylvania        Philadelphia       6,835           6.7%         459               7,294
  Pennsylvania        Wilkes-Barre       6,835          -2.9%        (195)              6,640
  Rhode Island        Providence         6,835          1.8%         124                6,959
  South Carolina      Spartanburg        6,835          -7.6%        (517)              6,318
  South Dakota        Rapid City         6,835          -6.3%        (429)              6,406
  Tennessee           Knoxville          6,835          -5.8%        (398)              6,437
  Texas               Houston            6,835          -5.8%        (398)              6,437
  Utah                Salt Lake City     6,835          -3.7%        (251)              6,584
  Vermont             Burlington         6,835          -3.7%        (251)              6,584
  Virginia            Alexandria         6,835          -0.8%         (52)              6,783
  Virginia            Lynchburg          6,835          -4.0%        (276)              6,559
  Washington          Seattle            6,835           3.6%         244               7,079
  Washington          Spokane            6,835          -1.8%        (126)              6,709
  West Virginia       Charleston         6,835          -1.2%        (80)               6,755
  Wisconsin           Green Bay          6,835          -1.9%        (130)              6,705
  Wyoming             Cheyenne           6,835          -3.6%        (245)              6,590
  Puerto Rico         Cayey              6,835          -0.2%        (14)               6,821

15.4 O&M ESTIMATE
In addition to the general items discussed in the section of this report entitled O&M Estimate,
since a FC is a direct energy conversion device, the specific O&M related to the FC Facility that
differs from other facilities discussed in this report is the stack replacement, currently anticipated
to be every five years by the various vendors and developers. Table 15-3 presents the O&M
expenses for the FC Facility.
                           TABLE 15-3 – O&M EXPENSES FOR FC
                        Technology:                                  FC
                    Fixed O&M Expense                           $350/kW-year
                   Variable O&M Expense                           $0/MWh


                                                 15-5
15.5 ENVIRONMENTAL COMPLIANCE INFORMATION
Table 15-4 presents environmental emissions for the FC Facility. It should be noted that the CO2
production from the FC Facility occurs as a result of reforming natural gas to the feedstock for
the fuel cell module.
                TABLE 15-4 – ENVIRONMENTAL EMISSIONS FOR FC
                      Technology:                      FC
                         NOX                    <0.013 lb/MMBtu
                          SO2                  <0.00013 lb/MMBtu
                          CO2                    <130 lb/MMBtu


                                             15-6
16. GEOTHERMAL DUAL FLASH (GT)

16.1 MECHANICAL EQUIPMENT AND SYSTEMS
The Geothermal (“GT”) Facility produces 50 MW net of electricity. The facility uses a
dual-flash GT cycle, which includes one ST with the capability to generate 55 gross MW based
on a high-temperature, high-salinity brine. The GT Facility consists of production wells, a
Turbine Generating Facility (“TGF”), a Brine Processing Facility (“BPF”), injection wells, and a
plant injection well. GT fluid in mixed phase (steam and brine) from the production wells is
piped to the BPF where the fluid is flashed at successively lower pressures to produce three
separate pressure levels of steam to be delivered to the TGF. Additionally, the BPF will produce
a concentrated brine to be further processed to remove solids.
The GT production wells deliver the GT brine to the BPF where it is initially flashed in a
separator drum to produce HP steam. The remaining brine is subject to two additional pressure
reduction stages, in closed pressure vessels called crystallizers, which are operated in a manner
to prevent the rapid scaling of the vessel walls and internal parts by the precipitation of solids
from the brine. The medium-pressure crystallizer is supplied with a small quantity of seed flow,
concentrated brine from the primary clarifier, to provide a nucleus to which the solids in the
crystallizer brine can attach themselves and be carried out with the brine leaving the crystallizer.
The separated brine from the crystallizers is sent through an atmospheric flash tank to reduce
pressure, and then further processed via a primary and secondary clarifier system where the
solids produced are formed into a solid cake after being passed through a filter press, treated with
acid and neutralizing washes, and steam and hot-air dried to produce a silica rich filter cake
Steam at the three pressure levels from the BPF is delivered to the TGF and directed through
steam scrubbers (one for each pressure level), which are designed to produce 99.95 percent
quality steam, by removing free liquids and a proportion of the entrained liquids within the
steam. The scrubbed steam is delivered to the ST. The ST is a condensing ST equipped with
dual HP, IP, and LP inlets. Steam from the ST is condensed in a two-pass shell and tube
condenser constructed of stainless steel, with part of the condensate used for cooling tower
make-up, and the remainder pumped to the re-injection wells. Condensate pumps direct
condensate to the circulating water system, the purge system, or the condensate injection system.
The non-condensable gases are evacuated by a non-condensable gas removal system and vent
products delivered to an H2S abatement system. Cooling water for the ST condenser is supplied
by an induced-draft cooling tower. Circulating water pumps direct water from the cooling tower
to the ST condenser. Make-up water for the cycle is supplied from the condensate from the ST
condenser. Additional make-up water may be needed during the summer months. Figure 16-1
presents a simplified process flow diagram for a GT power plant configuration.


                                               16-1
FIGURE 16-1 – GT DESIGN CONFIGURATION


16.2 ELECTRICAL AND CONTROL SYSTEMS
The GT Facility has one ST electric generator. The generator is a 60 Hz machine rated at
approximately 70 MVA with an output voltage of 13.8 kV. The ST electric generator is
connected to a high-voltage bus in the facility switchyard via a dedicated generator circuit
breaker, GSU, high-voltage circuit breaker and a disconnect switch. The GSU increases the
voltage from the electric generator from 13.8 kV to interconnected transmission system high
voltage.
The GT Facility is controlled using a DCS. The DCS provides centralized control of the facility
by integrating the control systems provided with the BPF, ST and associated electric generator,
and the control of BOP systems and equipment.

16.3 OFF-SITE REQUIREMENTS
Since the GT Facility is fueled by a renewable, underground fuel source, an off-site fuel source,
other than incidental plant heating, is not required. Water for all processes at the GT Facility is
obtained from one of several available water sources; however, due to the geography of most
geothermal power plants, water is sourced from on-site wells. Processed wastewater is generally
re-injected, if wells are the source of water, though many GT facilities utilize ZLD. Further, the


                                               16-2
electrical interconnection from the GT Facility is accomplished by interconnecting via the plant
switchyard into the utility high-voltage transmission system.

16.4 CAPITAL COST ESTIMATE
The base Cost Estimate for the GT Facility with a nominal capacity of 50 MW is $6,163/kW.
Table 16-1 summarizes the Cost Estimate categories for the GT Facility.
       TABLE 16-1 – BASE PLANT SITE CAPITAL COST ESTIMATE FOR GT
                                      Technology: GT
                            Nominal Capacity (ISO): 50,000 kW
                           Nominal Heat Rate (ISO): N/A Btu/kWh-HHV

      Capital Cost Category                                                          (000s) (October 1, 2010$)

      Civil Structural Material and Installation                                                  9,450

      Mechanical Equipment Supply and
      Installation (and well costs)                                                             152,000

      Electrical / I&C Supply and Installation                                                   12,062

      Project Indirects (1)                                                                      32,000

      EPC Cost before Contingency and Fee                                                       205,512

      Fee and Contingency                                                                        30,827

      Total Project EPC                                                                         236,339

      Owner Costs (excluding project finance)                                                    42,541

      Total Project Cost (excluding finance)                                                    278,879

      Total Project EPC                                                / kW                       4,726

      Owner Costs 18% (excluding project finance)                      / kW                        852

      Total Project Cost (excluding project finance)                   / kW                       5,578

      (1) Includes engineering, distributable costs, scaffolding, construction management, and start-up.


For this type of technology and power plant configuration, our regional adjustments took into
consideration the following: seismic design differences, local technical enhancements
(e.g., additional noise remediation that is generally required in urban siting), remote location
issues, labor wage and productivity differences, location adjustments, and the increase in
overheads associated with these five adjustments. It was assumed that geothermal facilities
would only be considered in 13 states: Alaska, Arizona, California, Colorado, Florida, Hawaii,
Idaho, Nevada, New Mexico, Oregon, Utah, Washington, and Wyoming.


                                                           16-3
Seismic design differences among the various locations were based on U.S. seismic map
information that detailed the various seismic zones throughout the U.S. No cost increases were
associated with seismic Zone 0 and cost step increases were considered for Zones 1, 2, 3 and 4.
Remote location issues are related to geographic areas that typically require installation of man
camps, higher craft incentives, and higher per diems are generally required with respect to
construction, due to the fact that such areas are long distances from urban areas, where labor is
generally abundant. Remote location designations were also considered in locations where
higher equipment freight costs are typically incurred, which for example are regions not near
established rail or highway access. Remote locations related to the Geothermal Facility include
Fairbanks, Alaska; Honolulu, Hawaii; Albuquerque, New Mexico; and Cheyenne, Wyoming.
Labor wage and productivity differences were handled as discussed in Section 2.5.1, taking into
consideration the amount of labor we estimated for the GT Facility.
Location adjustments were made to locations where higher cost of living levels are incurred
and/or where population density generally correlates to higher construction costs for power and
other infrastructure projects. These locations include Alaska, California, Hawaii, and Wyoming.
Table 16-2 presents the GT Facility capital cost variations for alternative U.S. plant locations.


                                                16-4
TABLE 16-2 – LOCATION-BASED COSTS FOR GT
                                       (OCTOBER 1, 2010 DOLLARS)
                                            Base
                                           Project    Location     Delta Cost   Total Location
                                            Cost      Percent      Difference    Project Cost
           State                City       ($/kW)     Variation      ($/kW)         ($/kW)
Alaska                 Anchorage            5,580       13.9%         777           6,357
Alaska                 Fairbanks            5,580       20.6%        1,150          6,730
Alabama                Huntsville             0             0.0%       0              0
Arizona                 Phoenix             5,580       -3.1%         (173)         5,407
Arkansas                Little Rock           0             0.0%       0              0
California              Los Angeles         5,580        5.4%         301           5,881
California              Redding             5,580        1.8%         101           5,681
California              Bakersfield         5,580        2.4%         136           5,716
California              Sacramento          5,580        4.9%         271           5,851
California              San Francisco       5,580       11.8%         661           6,241
Colorado                Denver              5,580       -3.0%         (165)         5,415
Connecticut             Hartford              0             0.0%       0              0
Delaware                Dover                 0             0.0%       0              0
District of Columbia    Washington            0             0.0%       0              0
Florida                 Tallahassee           0             0.0%       0              0
Florida                 Tampa                 0             0.0%       0              0
Georgia                Atlanta                0             0.0%       0              0
Hawaii                  Honolulu            5,580       21.8%        1,217          6,797
Idaho                   Boise               5,580       -2.6%         (146)         5,434
Illinois               Chicago                0             0.0%       0              0
Indiana                 Indianapolis          0             0.0%       0              0
Iowa                    Davenport             0             0.0%       0              0
Iowa                    Waterloo              0             0.0%       0              0
Kansas                  Wichita               0             0.0%       0              0
Kentucky               Louisville             0             0.0%       0              0
Louisiana               New Orleans           0             0.0%       0              0
Maine                   Portland              0             0.0%       0              0
Maryland                Baltimore             0             0.0%       0              0
Massachusetts           Boston                0             0.0%       0              0
Michigan               Detroit                0             0.0%       0              0
Michigan               Grand Rapids           0             0.0%       0              0
Minnesota               St. Paul              0             0.0%       0              0
Mississippi             Jackson               0             0.0%       0              0
Missouri                St. Louis             0             0.0%       0              0
Missouri                Kansas City           0             0.0%       0              0
Montana                 Great Falls           0             0.0%       0              0
Nebraska                Omaha                 0             0.0%       0              0
New Hampshire           Concord               0             0.0%       0              0
New Jersey              Newark                0             0.0%       0              0


                                                     16-5
Base
                                       Project    Location        Delta Cost    Total Location
                                        Cost      Percent         Difference     Project Cost
           State           City        ($/kW)     Variation         ($/kW)          ($/kW)
  New Mexico          Albuquerque       5,580       -2.1%            (117)           5,463
  New York            New York            0             0.0%          0                0
  New York            Syracuse            0             0.0%          0                0
  Nevada              Las Vegas         5,580           3.5%         193             5,773
  North Carolina      Charlotte           0             0.0%          0                0
  North Dakota        Bismarck            0             0.0%          0                0
  Ohio                Cincinnati          0             0.0%          0                0
  Oregon              Portland          5,580           1.7%          92             5,672
  Pennsylvania        Philadelphia        0             0.0%          0                0
  Pennsylvania        Wilkes-Barre        0             0.0%          0                0
  Rhode Island        Providence          0             0.0%          0                0
  South Carolina      Spartanburg         0             0.0%          0                0
  South Dakota        Rapid City          0             0.0%          0                0
  Tennessee           Knoxville           0             0.0%          0                0
  Texas               Houston             0             0.0%          0                0
  Utah                Salt Lake City    5,580       -3.1%            (173)           5,407
  Vermont             Burlington          0             0.0%          0                0
  Virginia            Alexandria          0             0.0%          0                0
  Virginia            Lynchburg           0             0.0%          0                0
  Washington          Seattle           5,580        3.5%             194            5,774
  Washington          Spokane           5,580       -1.8%            (103)           5,477
  West Virginia       Charleston          0             0.0%          0                0
  Wisconsin           Green Bay           0             0.0%          0                0
  Wyoming             Cheyenne          5,580       -2.9%            (164)           5,416
  Puerto Rico         Cayey               0             0.0%          0                0

16.5 O&M ESTIMATE
In addition to the general items discussed in the section of this report entitled O&M Estimate, the
GT Facility includes major maintenance on the ST, electric generator (each approximately every
six years) and well field maintenance, which can vary depending on the GT resource. Table 16-3
presents the FOM and VOM expenses for the GT Facility.
                           TABLE 16-3 – O&M EXPENSES FOR GT
                        Technology:                                  GT
                    Fixed O&M Expense                          $84.27/kW-year
                   Variable O&M Expense                          $9.46/MWh

16.6 ENVIRONMENTAL COMPLIANCE INFORMATION
Table 16-4 presents environmental emissions for the GT Facility.


                                                 16-6
TABLE 16-4 – ENVIRONMENTAL EMISSIONS FOR GT
    Technology:                GT
       NOX                 0 per MWh
        SO2               0.2 per MWh
        CO2               120 per MWh


                   16-7
17. GEOTHERMAL BINARY (BINARY)

17.1 MECHANICAL EQUIPMENT AND SYSTEMS
The Geothermal Binary (“Binary”) Facility produces 50 MW net of electricity. The Binary
Facility consists primarily of three heat recovery systems. These heat recovery systems operate
on a closed looped organic supercritical Rankine cycle using geothermal brine as a heat source,
with a brine temperature approximately 275°F. Cycle heat rejection will be provided through
three cooling towers. After supplying the three heat recovery systems with hot water, the
geothermal brine will be re-injected into the resource at approximately 140°F through injection
wells.
The heat recovery systems are equipped with a multistage, radial inflow turbo-expander
generator unit. The turbo-expander is designed for a supercritical refrigerant inlet pressure and
temperature. Each turbo-expander unit has a design output (gross) of approximately 10,000 kW.
Refrigerant is pumped from the condenser to the evaporators in each heat recovery system by
means of a single high pressure vertical turbine pump.
                      FIGURE 17-1 – GT DESIGN CONFIGURATION


17.2 ELECTRICAL AND CONTROL SYSTEMS
There are to be three turbine generators at the Binary Facility. Each turbine generator is to be an
air cooled unit with static excitation designed for operation at 60 Hz, three-phase and 12.5 kV.
Each turbine generator is to be rated for 18 MW with a power factor range of 0.85 lagging.
The three turbine generators are to be connected to a single GSU connected through a generator
circuit breaker and a switchgear main circuit breaker and underground cable to a switch on a
common open air bus in the Binary Facility substation.


                                               17-1
17.3 OFF-SITE REQUIREMENTS
Since the Binary Facility is fueled by a renewable, underground fuel source, an off-site fuel
source, other than incidental plant heating is not required. Water for all processes at the Binary
Facility is obtained from one of several available water sources; however, due to the geography
of most geothermal power plants, water is sourced from on-site wells. Processed wastewater is
generally re-injected, if wells are the source of water, though many Binary facilities utilize ZLD.
Further, the electrical interconnection from the Binary Facility is accomplished by
interconnecting via the plant switchyard into the utility high-voltage transmission system.

17.4 CAPITAL COST ESTIMATE
The base Cost Estimate for the Binary Facility with a nominal capacity of 50 MW is $4,141/kW.
Table 17-1 summarizes the Cost Estimate categories for the Binary Facility.
        TABLE 17-1 – BASE PLANT SITE CAPITAL COST ESTIMATE FOR GT
                                      Technology: GT
                            Nominal Capacity (ISO): 50,000 kW
                           Nominal Heat Rate (ISO): N/A Btu/kWh-HHV

      Capital Cost Category                                                          (000s) (October 1, 2010$)

      Civil Structural Material and Installation                                                  6,760

      Mechanical Equipment Supply and
      Installation (and well costs)                                                             107,545

      Electrical / I&C Supply and Installation                                                   13,345

      Project Indirects (1)                                                                      29,000

      EPC Cost before Contingency and Fee                                                       156,650

      Fee and Contingency                                                                        18,798

      Total Project EPC                                                                         175,448

      Owner Costs (excluding project finance)                                                    31,598

      Total Project Cost (excluding finance)                                                    207,046

      Total Project EPC                                                / kW                       3,509

      Owner Costs 18% (excluding project finance)                      / kW                        632

      Total Project Cost (excluding project finance)                   / kW                       4,141

      (1) Includes engineering, distributable costs, scaffolding, construction management, and start-up.


                                                           17-2
For this type of technology and power plant configuration, our regional adjustments took into
consideration the following: seismic design differences, local technical enhancements
(e.g., additional noise remediation that is generally required in urban siting), remote location
issues, labor wage and productivity differences, location adjustments, and the increase in
overheads associated with these five adjustments. It was assumed that geothermal facilities
would only be considered in 13 states: Alaska, Arizona, California, Colorado, Florida, Hawaii,
Idaho, Nevada, New Mexico, Oregon, Utah, Washington, and Wyoming.
Seismic design differences among the various locations were based on U.S. seismic map
information that detailed the various seismic zones throughout the U.S. No cost increases were
associated with seismic Zone 0 and cost step increases were considered for Zones 1, 2, 3 and 4.
Remote location issues are related to geographic areas that typically require installation of man
camps, higher craft incentives, and higher per diems are generally required with respect to
construction, due to the fact that such areas are long distances from urban areas, where labor is
generally abundant. Remote location designations were also considered in locations where
higher equipment freight costs are typically incurred, which for example are regions not near
established rail or highway access. Remote locations related to the Geothermal Facility include
Fairbanks, Alaska; Honolulu, Hawaii; Albuquerque, New Mexico; and Cheyenne, Wyoming.
Labor wage and productivity differences were handled as discussed in Section 2.5.1, taking into
consideration the amount of labor we estimated for the GT Facility.
Location adjustments were made to locations where higher cost of living levels are incurred
and/or where population density generally correlates to higher construction costs for power and
other infrastructure projects. These locations include Alaska, California, Hawaii, and Wyoming.
Table 17-2 presents the GT Facility capital cost variations for alternative U.S. plant locations.


                                                17-3
TABLE 17-2 – LOCATION-BASED COSTS FOR GT
                                       (OCTOBER 1, 2010 DOLLARS)
                                            Base
                                           Project    Location     Delta Cost   Total Location
                                            Cost      Percent      Difference    Project Cost
           State                City       ($/kW)     Variation      ($/kW)         ($/kW)
Alaska                 Anchorage            4,140       17.1%         710           4,850
Alaska                 Fairbanks            4,140       26.0%        1,075          5,215
Alabama                Huntsville             0             0.0%       0              0
Arizona                 Phoenix             4,140       -3.0%         (125)         4,015
Arkansas                Little Rock           0             0.0%       0              0
California              Los Angeles         4,140       6.5%          270           4,410
California              Redding             4,140       2.1%           88           4,228
California              Bakersfield         4,140       3.1%          127           4,267
California              Sacramento          4,140       5.4%          222           4,362
California              San Francisco       4,140       13.4%         553           4,693
Colorado                Denver              4,140       -2.7%         (112)         4,028
Connecticut             Hartford              0             0.0%       0              0
Delaware                Dover                 0             0.0%       0              0
District of Columbia    Washington            0             0.0%       0              0
Florida                 Tallahassee           0             0.0%       0              0
Florida                 Tampa                 0             0.0%       0              0
Georgia                Atlanta                0             0.0%       0              0
Hawaii                  Honolulu            4,140       28.5%        1,178          5,318
Idaho                   Boise               4,140       -2.5%         (105)         4,035
Illinois               Chicago                0             0.0%       0              0
Indiana                 Indianapolis          0             0.0%       0              0
Iowa                    Davenport             0             0.0%       0              0
Iowa                    Waterloo              0             0.0%       0              0
Kansas                  Wichita               0             0.0%       0              0
Kentucky               Louisville             0             0.0%       0              0
Louisiana               New Orleans           0             0.0%       0              0
Maine                   Portland              0             0.0%       0              0
Maryland                Baltimore             0             0.0%       0              0
Massachusetts           Boston                0             0.0%       0              0
Michigan               Detroit                0             0.0%       0              0
Michigan               Grand Rapids           0             0.0%       0              0
Minnesota               St. Paul              0             0.0%       0              0
Mississippi             Jackson               0             0.0%       0              0
Missouri                St. Louis             0             0.0%       0              0
Missouri                Kansas City           0             0.0%       0              0
Montana                 Great Falls           0             0.0%       0              0
Nebraska                Omaha                 0             0.0%       0              0
New Hampshire           Concord               0             0.0%       0              0
New Jersey              Newark                0             0.0%       0              0


                                                     17-4
Base
                                       Project    Location        Delta Cost    Total Location
                                        Cost      Percent         Difference     Project Cost
           State           City        ($/kW)     Variation         ($/kW)          ($/kW)
  New Mexico          Albuquerque       4,140       -1.8%            (76)            4,064
  New York            New York            0             0.0%          0                0
  New York            Syracuse            0             0.0%          0                0
  Nevada              Las Vegas         4,140           3.6%         150             4,290
  North Carolina      Charlotte           0             0.0%          0                0
  North Dakota        Bismarck            0             0.0%          0                0
  Ohio                Cincinnati          0             0.0%          0                0
  Oregon              Portland          4,140           2.0%          81             4,221
  Pennsylvania        Philadelphia        0             0.0%          0                0
  Pennsylvania        Wilkes-Barre        0             0.0%          0                0
  Rhode Island        Providence          0             0.0%          0                0
  South Carolina      Spartanburg         0             0.0%          0                0
  South Dakota        Rapid City          0             0.0%          0                0
  Tennessee           Knoxville           0             0.0%          0                0
  Texas               Houston             0             0.0%          0                0
  Utah                Salt Lake City    4,140       -2.9%            (118)           4,022
  Vermont             Burlington          0             0.0%          0                0
  Virginia            Alexandria          0             0.0%          0                0
  Virginia            Lynchburg           0             0.0%          0                0
  Washington          Seattle           4,140        3.8%            158             4,298
  Washington          Spokane           4,140       -1.7%            (72)            4,068
  West Virginia       Charleston          0             0.0%          0                0
  Wisconsin           Green Bay           0             0.0%          0                0
  Wyoming             Cheyenne          4,140       -2.6%            (106)           4,034
  Puerto Rico         Cayey               0             0.0%          0                0

17.5 O&M ESTIMATE
In addition to the general items discussed in the section of this report entitled O&M Estimate, the
Binary Facility includes major maintenance on the turbines, electric generator (each
approximately every six years) and well field maintenance, which can vary depending on the
Binary Facility resource. Table 17-3 presents the FOM and VOM expenses for the Binary
Facility.
                       TABLE 17-3 – O&M EXPENSES FOR BINARY
                        Technology:                                  GT
                    Fixed O&M Expense                          $43.82/kW-year
                   Variable O&M Expense                          $5.15/MWh


                                                 17-5
17.6 ENVIRONMENTAL COMPLIANCE INFORMATION
Table 17-4 presents environmental emissions for the Binary Facility.
             TABLE 17-4 – ENVIRONMENTAL EMISSIONS FOR BINARY
                      Technology:                      Binary
                         NOX                         0 per MWh
                          SO2                       0.2 per MWh
                          CO2                       120 per MWh


                                             17-6
18. MUNICIPAL SOLID WASTE (MSW)

18.1 MECHANICAL EQUIPMENT AND SYSTEMS
The MSW Facility processes approximately 2,000 tons per day of MSW and produces
approximately 50 MW. Three refuse-fired boilers are installed, which incorporate the Marin
mass-burning technology and grates specifically designed for combusting waste having an HHV
between 4,000 and 6,500 Btu/lb. The three boilers together produce approximately 450,000 lb/hr
of 900 psia steam.
Grapple cranes are used to transfer solid waste from a storage pit to loading chutes, where
hydraulically operated feeds push the MSW onto the grates at a rate determined by the
combustion control system. The Martin grates are constructed as assemblies of modular grate
units. The units are driven by hydraulic systems to provide a reverse reciprocating motion of the
grates, which move the burning refuse along the length of the downward sloped grate. At the
end of its travel along the grate, the MSW is completely combusted, and the remaining ash
residue falls into a proprietary Martin ash residue discharger, which receives the combustion
residue and cools it in a quench chamber. The fly ash from the dry flue gas scrubber and fabric
filter baghouse is conveyed to the ash discharger where it is combined with the bottom ash and
quenched. After being quenched, the combined ash residue is pushed up an inclined
draining/drying chute. Excess water from the residue drains back into the quench bath. The
residue, containing sufficient moisture to prevent dusting, is transferred by a conveyor to a
residue storage pit. Clamshell grapple cranes transport the residue to a scalper screen. The
scalper screen extracts pieces of the residue larger than a certain size in order to protect the
downstream equipment. The smaller material which passes through the scalper screen is fed
onto a conveyer belt which discharges onto a vibrating feeder. The vibrating feeder passes the
residue beneath a magnetic drum to separate ferrous material from the ash. Non-magnetic
residue falls onto a distribution conveyor for distribution to a transport vehicle. Ferrous material
is conveyed to a rotating trommel screen for cleaning, after which it is conveyed to a roll-off
container.
Each boiler is equipped with a dry flue gas scrubber in combination with a reverse air fabric
filter baghouse. The dry scrubbers remove the acid gases (mainly SO2, hydrochloric acid and
hydrofluoric acid) from the flue gas. A hydrated lime injection system prior to the dry scrubber
augments the AGR capability of the system. The reverse air baghouse reduces dioxin/furan and
particulate emissions. The facility also uses selective non-catalytic reduction (“SNCR”) for NOX
control, and activated carbon injection for mercury control.
Steam from the boilers is used to drive a single condensing ST for the production of
approximately 50 MW of net electricity. The ST exhausts to a water-cooled condenser which
receives circulating cooling water from an evaporative-type cooling tower. The ST includes
extraction taps to provide steam for feedwater heating, air preheating and other miscellaneous
steam requirements. The MSW process flow diagram at a high level is similar to the pulverized
coal flow diagram, except that the fuel source is MSW, rather than coal (see Figure 3-1).
The MSW process flow diagram at a high level is similar to the pulverized coal flow diagram,
except that the fuel source is MSW, rather than coal.


                                               18-1
18.2 ELECTRICAL AND CONTROL SYSTEMS
The MSW Facility has one ST electric generator. The generator is a 60 Hz machine rated at
approximately 70 MVA with an output voltage of 13.8 kV. The ST electric generator is
connected to a high-voltage bus in the facility switchyard via a dedicated generator circuit
breaker, GSU, high-voltage circuit breaker and a disconnect switch. The GSU increases the
voltage from the electric generator from 13.8 kV to interconnected transmission system high
voltage.
The MSW Facility is controlled using a DCS. The DCS provides centralized control of the
facility by integrating the control systems provided with the boiler, ST and associated electric
generator, and the control of BOP systems and equipment.

18.3 OFF-SITE REQUIREMENTS
MSW is delivered to the facility via rail, truck or barge. Water for all processes at the
MSW Facility can be obtained from one of a variety of sources. The MSW Facility uses a water
treatment system and a high-efficiency reverse osmosis system to reduce the dissolved solids
from the cooling water and to provide distilled water for boiler make-up. Wastewater is sent to a
municipal wastewater system or other approved alternative.               Further, the electrical
interconnection from the MSW Facility on-site switchyard is effectuated by a connection to an
adjacent utility substation.

18.4 CAPITAL COST ESTIMATE
The base Cost Estimate for the MSW Facility with a nominal capacity of 50 MW is $8,232/kW.
Table 18-1 summarizes the Cost Estimate categories for the GT Facility.


                                              18-2
TABLE 18-1 – BASE PLANT SITE CAPITAL COST ESTIMATE FOR MSW
                                      Technology: MSW
                            Nominal Capacity (ISO): 50,000 kW
                           Nominal Heat Rate (ISO): 18,000 Btu/kWh-HHV

      Capital Cost Category                                                          (000s) (October 1, 2010$)

      Civil Structural Material and Installation                                                 33,875

      Mechanical Equipment Supply and
      Installation                                                                              183,000

      Electrical / I&C Supply and Installation                                                   25,300

      Project Indirects (1)                                                                      56,080

      EPC Cost before Contingency and Fee                                                       298,255

      Fee and Contingency                                                                        44,738

      Total Project EPC                                                                         342,993

      Owner Costs (excluding project finance)                                                    68,599

      Total Project Cost (excluding finance)                                                    411,592

      Total Project EPC                                                / kW                       6,860

      Owner Costs 20% (excluding project finance)                      / kW                       1,372

      Total Project Cost (excluding project finance)                   / kW                       8,232

      (1) Includes engineering, distributable costs, scaffolding, construction management, and start-up.


For this type of technology and power plant configuration, our regional adjustments took into
consideration the following: seismic design differences, local enhancements, remote location
issues, labor wage and productivity differences, location adjustments, and the increase in
overheads associated with these five adjustments.
Seismic design differences among the various locations were based on U.S. seismic map
information that detailed the various seismic zones throughout the U.S. No cost increases were
associated with seismic Zone 0 and cost step increases were considered for Zones 1, 2, 3 and 4.
Remote location issues are related to geographic areas that typically require installation of man
camps, higher craft incentives, and higher per diems are generally required with respect to
construction, due to the fact that such areas are long distances from urban areas, where labor is
generally abundant. Remote location designations were also considered in locations where
higher equipment freight costs are typically incurred, which for example are regions not near
established rail or highway access. Remote locations related to the MSW Facility include


                                                           18-3
Fairbanks, Alaska; Honolulu, Hawaii; Albuquerque, New Mexico; Cheyenne, Wyoming; and
Cayey, Puerto Rico.
Labor wage and productivity differences were handled as discussed in Section 2.5.1, taking into
consideration the amount of labor we estimated for the MSW Facility.
Location adjustments were made to locations where higher cost of living levels are incurred
and/or where population density generally correlates to higher construction costs for power and
other infrastructure projects. These locations include Alaska, California, Connecticut, Delaware,
District of Columbia, Hawaii, Illinois, Maine, Maryland, Massachusetts, Michigan, Minnesota,
New York, Ohio, and Wisconsin.
Table 18-2 presents the MSW Facility capital cost variations for alternative U.S. plant locations.
                         TABLE 18-2 – LOCATION-BASED COSTS FOR MSW
                                         (OCTOBER 1, 2010 DOLLARS)
                                              Base
                                             Project    Location     Delta Cost   Total Location
                                              Cost      Percent      Difference    Project Cost
             State                City       ($/kW)     Variation      ($/kW)         ($/kW)
  Alaska                  Anchorage           8,240       12.8%        1,054          9,294
  Alaska                  Fairbanks           8,240       17.7%        1,459          9,699
  Alabama                 Huntsville          8,240       -5.8%         (474)         7,766
  Arizona                 Phoenix             8,240       -4.5%         (371)         7,869
  Arkansas                Little Rock         8,240       -4.7%         (387)         7,853
  California              Los Angeles         8,240        5.2%         430           8,670
  California              Redding             8,240        1.9%         154           8,394
  California              Bakersfield         8,240        2.1%         176           8,416
  California              Sacramento          8,240        5.7%         472           8,712
  California              San Francisco       8,240       13.4%        1,104          9,344
  Colorado                Denver              8,240       -4.7%         (384)         7,856
  Connecticut             Hartford            8,240           5.2%      429           8,669
  Delaware                Dover               8,240           3.1%      258           8,498
  District of Columbia    Washington          8,240           1.7%      140           8,380
  Florida                 Tallahassee         8,240       -7.9%         (649)         7,591
  Florida                 Tampa               8,240       -3.3%         (268)         7,972
  Georgia                 Atlanta             8,240       -6.3%         (515)         7,725
  Hawaii                  Honolulu            8,240       19.9%        1,638          9,878
  Idaho                   Boise               8,240       -3.8%         (315)         7,925
  Illinois                Chicago             8,240       12.5%        1,033          9,273
  Indiana                 Indianapolis        8,240       -0.9%         (78)          8,162
  Iowa                    Davenport           8,240       -1.0%          (79)         8,161
  Iowa                    Waterloo            8,240       -6.7%         (548)         7,692
  Kansas                  Wichita             8,240       -5.4%         (446)         7,794
  Kentucky                Louisville          8,240       -4.8%         (392)         7,848
  Louisiana               New Orleans         8,240       -7.3%         (603)         7,637
  Maine                   Portland            8,240       -4.1%         (341)         7,899
  Maryland                Baltimore           8,240       -1.7%         (144)         8,096


                                                       18-4
Base
                                      Project    Location      Delta Cost       Total Location
                                       Cost      Percent       Difference        Project Cost
           State           City       ($/kW)     Variation       ($/kW)             ($/kW)
  Massachusetts      Boston            8,240       11.8%           975               9,215
  Michigan           Detroit           8,240        2.7%           220               8,460
  Michigan           Grand Rapids      8,240       -5.8%          (475)              7,765
  Minnesota          St. Paul          8,240           2.3%        190               8,430
  Mississippi        Jackson           8,240       -5.7%          (471)              7,769
  Missouri           St. Louis         8,240           3.0%        247               8,487
  Missouri           Kansas City       8,240           1.8%        150               8,390
  Montana            Great Falls       8,240       -4.0%          (333)              7,907
  Nebraska           Omaha             8,240       -3.0%          (243)              7,997
  New Hampshire      Concord           8,240       -2.0%          (166)              8,074
  New Jersey         Newark            8,240       11.9%           984               9,224
  New Mexico         Albuquerque       8,240       -3.5%          (287)              7,953
  New York           New York          8,240       26.3%          2,167             10,407
  New York           Syracuse          8,240       -0.4%           (31)             8,209
  Nevada             Las Vegas         8,240           4.5%        370               8,610
  North Carolina     Charlotte         8,240       -8.3%          (688)              7,552
  North Dakota       Bismarck          8,240       -5.6%          (463)              7,777
  Ohio               Cincinnati        8,240       -3.1%          (256)              7,984
  Oregon             Portland          8,240           1.7%        136               8,376
  Pennsylvania       Philadelphia      8,240        8.5%           698               8,938
  Pennsylvania       Wilkes-Barre      8,240       -3.4%          (283)              7,957
  Rhode Island       Providence        8,240           2.8%        229               8,469
  South Carolina     Spartanburg       8,240       -9.5%          (786)              7,454
  South Dakota       Rapid City        8,240       -7.9%          (654)              7,586
  Tennessee          Knoxville         8,240       -7.3%          (603)              7,637
  Texas              Houston           8,240       -7.3%          (598)              7,642
  Utah               Salt Lake City    8,240       -4.9%          (401)              7,839
  Vermont            Burlington        8,240       -4.4%          (364)              7,876
  Virginia           Alexandria        8,240       -1.8%          (148)              8,092
  Virginia           Lynchburg         8,240       -5.1%          (420)              7,820
  Washington         Seattle           8,240        4.1%           342               8,582
  Washington         Spokane           8,240       -2.8%          (228)              8,012
  West Virginia      Charleston        8,240       -1.6%          (135)              8,105
  Wisconsin          Green Bay         8,240       -2.3%          (186)              8,054
  Wyoming            Cheyenne          8,240       -4.6%          (383)              7,857
  Puerto Rico        Cayey             8,240       -1.7%          (144)              8,096

18.5 O&M ESTIMATE
In addition to the general items discussed in the section of this report entitled O&M Estimate, the
MSW Facility includes major maintenance for the feedstock handling, ST, electric generator,
boiler, and BOP systems. Table 18-3 presents the O&M expenses for the MSW Facility.


                                                18-5
TABLE 18-3 – O&M EXPENSES FOR MSW
                    Technology:                            MSW
                Fixed O&M Expense                     $373.76/kW-year
               Variable O&M Expense                     $8.33/MWh

18.6 ENVIRONMENTAL COMPLIANCE INFORMATION
As mentioned above in the section on mechanical systems, each boiler is equipped with a dry
flue gas scrubber in combination with a reverse air fabric filter baghouse. A hydrated lime
injection system prior to the dry scrubber augments the AGR capability of the system. The
reverse air baghouse reduces dioxin/furan and particulate emissions, an SNCR is used for NOX
control, and activated carbon injection is used for mercury control. Table 18-4 presents
environmental emissions for the MSW Facility.
              TABLE 18-4 – ENVIRONMENTAL EMISSIONS FOR MSW
                     Technology:                       MSW
                        NOX                       0.27 lb/MMBtu
                         SO2                      0.07 lb/MMBtu
                         CO2                      200 lb/MMBtu


                                           18-6
19. HYDROELECTRIC (HY)

19.1 MECHANICAL EQUIPMENT AND SYSTEMS
The 500 MW Hydroelectric (“HY”) Facility is composed of two 250 MW vertical shaft Francis
turbine generator units with a minimum of 650 feet (200 meters) of head. Figure 19-1 presents
the HY process flow diagram.
                      FIGURE 19-1 – HY DESIGN CONFIGURATION


19.2 ELECTRICAL AND CONTROL SYSTEMS
The HY Facility has two synchronous electric generators. Each generator is a 60 Hz machine
rated at approximately 300 MVA with an output voltage of approximately 23 kV. Each electric
generator is connected to a high-voltage bus in the facility switchyard via a dedicated generator
circuit breaker, GSU, high-voltage circuit breaker and a disconnect switch. In some instances,
the generator is connected directly to its GSU and connected through a disconnect switch
between two breakers on the high-voltage bus. The GSU increases the voltage from the electric
generator from 23 kV to interconnected transmission system high voltage.
The HY Facility is controlled using a DCS. The DCS provides centralized control of the facility
by integrating the control systems provided hydro-turbine and associated electric generator and
the control of BOP systems and equipment.

19.3 OFF-SITE REQUIREMENTS
Since the fuel source for the HY Facility is renewable, the most important off-site requirement is
the electrical interconnection to the high-voltage transmission system of the utility, which can be
effectuated through the HY Facility switchyard.


                                               19-1
19.4 CAPITAL COST ESTIMATE
The base Cost Estimate for the HY Facility with a nominal capacity of 500 MW is $3,076/kW.
Table 19-1 summarizes the Cost Estimate categories for the HY Facility.
        TABLE 19-1 – BASE PLANT SITE CAPITAL COST ESTIMATE FOR HY
                                       Technology: HY
                             Nominal Capacity (ISO): 500,000 kW
                            Nominal Heat Rate (ISO): Not Applicable

      Capital Cost Category                                                           (000s) (October 1, 2010$)

      Civil Structural Material and Installation                                                  634,250

      Mechanical Equipment Supply and
      Installation                                                                                253,000

      Electrical / I&C Supply and Installation                                                     77,600

      Project Indirects (1)                                                                       174,500

      EPC Cost before Contingency and Fee                                                        1,139,350

      Fee and Contingency                                                                         142,419

      Total Project EPC                                                                          1,281,769

      Owner Costs (excluding project finance)                                                     256,354

      Total Project Cost (excluding finance)                                                     1,538,123

      Total Project EPC                                                  / kW                       2,564

      Owner Costs 20% (excluding project finance)                        / kW                        513

      Total Project Cost (excluding project finance)                    / kW                        3,076

      (1)   Includes engineering, distributable costs, scaffolding, construction management, and start-up.


For this type of technology and power plant configuration, our regional adjustments took into
consideration the following: seismic design differences, local technical enhancements
(e.g., additional noise remediation that is generally required in urban siting), remote location
issues, labor wage and productivity differences, location adjustments, and the increase in
overheads associated with these five adjustments. The assumption was made that hydroelectric
facilities would only be considered for construction in the states of Alaska, California, Colorado,
Connecticut, Idaho, Maine, Missouri, Montana, North Carolina, Ohio, Oregon, South Dakota,
and Washington.


                                                             19-2
Seismic design differences among the various locations were based on U.S. seismic map
information that detailed the various seismic zones throughout the U.S. No cost increases were
associated with seismic Zone 0 and cost step increases were considered for Zones 1, 2, 3 and 4.
The locations with local technical enhancements include California, Colorado, Connecticut, and
Delaware. These are areas where technical enhancements generally need to be made by a project
developer or utility to comply with the applicable permitting/siting requirements.
Remote location issues are related to geographic areas that typically require installation of man
camps, higher craft incentives, and higher per diems are generally required with respect to
construction, due to the fact that such areas are long distances from urban areas, where labor is
generally abundant. Remote location designations were also considered in locations where
higher equipment freight costs are typically incurred, which for example are regions not near
established rail or highway access. The remote location related to the Hydroelectric Facility is
Fairbanks, Alaska.
Labor wage and productivity differences were handled as discussed in Section 2.5.1, taking into
consideration the amount of labor we estimated for the HY Facility.
Location adjustments were made to locations where higher cost of living levels are incurred
and/or where population density generally correlates to higher construction costs for power and
other infrastructure projects. These locations include Alaska, California, Connecticut, Maine,
Ohio, and South Dakota.
Table 19-2 presents the HY Facility capital cost variations for alternative U.S. plant locations.


                                               19-3
TABLE 19-2 – LOCATION-BASED COSTS FOR HY
                                       (OCTOBER 1, 2010 DOLLARS)
                                            Base
                                           Project    Location     Delta Cost   Total Location
                                            Cost      Percent      Difference    Project Cost
           State                City       ($/kW)     Variation      ($/kW)         ($/kW)
Alaska                  Anchorage           3,080       20.1%         619           3,699
Alaska                  Fairbanks           3,080       31.6%         974           4,054
Alabama                 Huntsville            0             0.0%       0              0
Arizona                 Phoenix               0             0.0%       0              0
Arkansas                Little Rock           0             0.0%       0              0
California              Los Angeles         3,080        7.4%         228           3,308
California              Redding             3,080        2.8%          88           3,168
California              Bakersfield         3,080        2.4%          75           3,155
California              Sacramento          3,080        3.7%         113           3,193
California              San Francisco       3,080       13.2%         408           3,488
Colorado                Denver              3,080       -1.3%         (40)          3,040
Connecticut             Hartford            3,080           6.4%      197           3,277
Delaware                Dover                 0             0.0%       0              0
District of Columbia    Washington            0             0.0%       0              0
Florida                 Tallahassee           0             0.0%       0              0
Florida                 Tampa                 0             0.0%       0              0
Georgia                 Atlanta               0             0.0%       0              0
Hawaii                  Honolulu              0             0.0%       0              0
Idaho                   Boise               3,080       -1.6%         (49)          3,031
Illinois                Chicago               0             0.0%       0              0
Indiana                 Indianapolis          0             0.0%       0              0
Iowa                    Davenport             0             0.0%       0              0
Iowa                    Waterloo              0             0.0%       0              0
Kansas                  Wichita               0             0.0%       0              0
Kentucky                Louisville            0             0.0%       0              0
Louisiana               New Orleans           0             0.0%       0              0
Maine                   Portland            3,080       -0.8%         (23)          3,057
Maryland                Baltimore             0             0.0%       0              0
Massachusetts           Boston                0             0.0%       0              0
Michigan                Detroit               0             0.0%       0              0
Michigan                Grand Rapids          0             0.0%       0              0
Minnesota               St. Paul              0             0.0%       0              0
Mississippi             Jackson               0             0.0%       0              0
Missouri                St. Louis           3,080           1.3%       41           3,121
Missouri                Kansas City         3,080           1.4%       42           3,122
Montana                 Great Falls         3,080       -1.2%         (37)          3,043
Nebraska                Omaha                 0             0.0%       0              0
New Hampshire           Concord               0             0.0%       0              0
New Jersey              Newark                0             0.0%       0              0
New Mexico              Albuquerque           0             0.0%       0              0


                                                     19-4
Base
                                       Project    Location        Delta Cost    Total Location
                                        Cost      Percent         Difference     Project Cost
           State           City        ($/kW)     Variation         ($/kW)          ($/kW)
  New York            New York            0             0.0%          0               0
  New York            Syracuse            0             0.0%          0               0
  Nevada              Las Vegas           0             0.0%          0               0
  North Carolina      Charlotte           0             0.0%          20            3,100
  North Dakota        Bismarck            0             0.0%          0               0
  Ohio                Cincinnati        3,080       -1.6%            (49)           3,031
  Oregon              Portland          3,080           4.7%         145            3,225
  Pennsylvania        Philadelphia        0             0.0%          0               0
  Pennsylvania        Wilkes-Barre        0             0.0%          0               0
  Rhode Island        Providence          0             0.0%          0               0
  South Carolina      Spartanburg         0             0.0%          0               0
  South Dakota        Rapid City        3,080       -3.9%            (119)          2,961
  Tennessee           Knoxville           0             0.0%          0               0
  Texas               Houston             0             0.0%          0               0
  Utah                Salt Lake City      0             0.0%          0               0
  Vermont             Burlington          0             0.0%          0               0
  Virginia            Alexandria          0             0.0%          0               0
  Virginia            Lynchburg           0             0.0%          0               0
  Washington          Seattle           3,080        3.5%            109            3,189
  Washington          Spokane           3,080       -1.0%            (31)           3,049
  West Virginia       Charleston          0             0.0%          0               0
  Wisconsin           Green Bay           0             0.0%          0               0
  Wyoming             Cheyenne            0             0.0%          0               0
  Puerto Rico         Cayey               0             0.0%          0               0

19.5 O&M ESTIMATE
In addition to the general items discussed in the section of the report entitled O&M Estimate, the
most significant differentiating O&M expenses for the HY Facility include dam and associated
civil major maintenance and hydro-turbine major maintenance, which are generally conducted
approximately every ten years. Because HY power plants are typically operated when available,
most operators consider a majority of O&M expenses for this technology to be fixed. Table 19-3
presents the O&M expenses for the HY Facility.
                           TABLE 19-3 – O&M EXPENSES FOR HY
                        Technology:                                  HY
                    Fixed O&M Expense                          $13.44/kW-year
                   Variable O&M Expense                           $0/MWh

19.6 ENVIRONMENTAL COMPLIANCE INFORMATION
The HY Facility does not burn a fuel and consequently there are no air emissions from this type
of plant. Table 19-4 presents environmental emissions for the HY Facility.


                                                 19-5
TABLE 19-4 – ENVIRONMENTAL EMISSIONS FOR HY
    Technology:                HY
       NOX                0 lb/MMBtu
        SO2               0 lb/MMBtu
        CO2               0 lb/MMBtu


                   19-6
20. PUMPED STORAGE (PS)

20.1 MECHANICAL EQUIPMENT AND SYSTEMS
The 250 MW Pumped Storage (“PS”) Facility is composed of two 125 MW Francis turbine
generator units. During off-peak hours, water is pumped from a lower reservoir to an upper
reservoir using electricity from the grid. During the generating cycle, water is discharged
through the reversible turbine generators to produce power. Figure 20-1 presents the PS process
flow diagram.
                      FIGURE 20-1 – PS DESIGN CONFIGURATION


20.2 ELECTRICAL AND CONTROL SYSTEMS
The PS Facility has two synchronous electric generators that are also capable of being operated
as motors powered from the grid to provide the pumping function by driving the Francis
hydro-turbines in reverse. The generators are 60 Hz machines rated at approximately 150 MVA
with an output voltage of 13.8 kV to 24 kV. Each electric generator is connected to a high-
voltage bus in the facility switchyard via a dedicated generator circuit breaker, GSU,
high-voltage circuit breaker and a disconnect switch. The GSU increases the voltage from the
electric generator voltage to the interconnected transmission system high voltage.
The PS Facility is controlled using a DCS. The DCS provides centralized control of the facility
by integrating the control systems provided with the hydro-turbine and associated electric
generator and the control of BOP systems and equipment.

20.3 OFF-SITE REQUIREMENTS
Similar to the HY Facility, since the fuel source for the PS Facility is renewable, the most
important off-site requirement is the electrical interconnection to the high-voltage transmission
system of the utility, which can be effectuated through the PS switchyard. Unlike the HY
Facility, which uses the backfeed from the utility transmission system only to run required plant


                                              20-1
loads when the hydro-turbines are not operating, significant volumes of electricity are consumed
in off-peak hours at the PS Facility.

20.4 CAPITAL COST ESTIMATE
The base Cost Estimate for the PS Facility with a nominal capacity of 250 MW is $5,595/kW.
Table 20-1 summarizes the Cost Estimate categories for the PS Facility. However, it should be
noted that the construction costs for future pumped storage power plants are strongly impacted
by the size (e.g., larger plants are most generally lower cost on a $/kW basis) and by the existing
infrastructure that may be leveraged in the development, design, and construction.
        TABLE 20-1 – BASE PLANT SITE CAPITAL COST ESTIMATE FOR PS
                                       Technology: PS
                             Nominal Capacity (ISO): 250,000 kW
                            Nominal Heat Rate (ISO): N/A Btu/kWh-HHV

      Capital Cost Category                                                           (000s) (October 1, 2010$)

      Civil Structural Material and Installation                                                  653,000

      Mechanical Equipment Supply and
      Installation                                                                                152,400

      Electrical / I&C Supply and Installation                                                     73,700

      Project Indirects (1)                                                                       171,100

      EPC Cost before Contingency and Fee                                                        1,050,200

      Fee and Contingency                                                                         115,522

      Total Project EPC                                                                          1,165,722

      Owner Costs (excluding project finance)                                                     233,144

      Total Project Cost (excluding finance)                                                     1,398,866

      Total Project EPC                                                  / kW                       4,663

      Owner Costs 20% (excluding project finance)                        / kW                        933

      Total Project Cost (excluding project finance)                    / kW                        5,595

      (1)   Includes engineering, distributable costs, scaffolding, construction management, and start-up.


For this type of technology and power plant configuration, our regional adjustments took into
consideration the following: seismic design differences, local technical enhancements, remote
location issues, labor wage and productivity differences, location adjustments, and the increase
in overheads associated with these five adjustments listed. While the analysis shown below


                                                             20-2
contemplates cost adjustment factors for each area considered, realistically, there are certain
areas that do not have enough elevation difference to cost effectively produce a pumped storage
plant.
Seismic design differences among the various locations were based on U.S. seismic map
information that detailed the various seismic zones throughout the U.S. No cost increases were
associated with seismic Zone 0 and cost step increases were considered for Zones 1, 2, 3 and 4.
The locations with local technical enhancements include California, Colorado, Connecticut,
Delaware, District of Columbia, Louisiana, Maryland, Massachusetts, New Jersey, New York,
Rhode Island, Vermont, and Virginia. These are areas where noise, visual impacts, and other
technical enhancements generally need to be made by a project developer or utility to comply
with the applicable permitting/siting requirements.
Remote location issues are related to geographic areas that typically require installation of man
camps, higher craft incentives, and higher per diems are generally required with respect to
construction, due to the fact that such areas are long distances from urban areas, where labor is
generally abundant. Remote location designations were also considered in locations where
higher equipment freight costs are typically incurred, which for example are regions not near
established rail or highway access. Remote locations related to the Pumped Storage Facility
include Fairbanks, Alaska; Honolulu, Hawaii; Albuquerque, New Mexico; Cheyenne, Wyoming;
and Cayey, Puerto Rico.
Labor wage and productivity differences were handled as discussed in Section 2.5.1., taking into
consideration the amount of labor we estimated for the PS Facility.
Location adjustments were made to locations where higher cost of living levels are incurred
and/or where population density generally correlates to higher construction costs for power and
other infrastructure projects. These locations include Alaska, California, Connecticut, Delaware,
District of Columbia, Hawaii, Illinois, Maine, Maryland, Massachusetts, Michigan, Minnesota,
New York, Ohio; and Wisconsin.
Table 20-2 presents the PS Facility capital cost variations for alternative U.S. plant locations.


                                                20-3
TABLE 20-2 – LOCATION-BASED COSTS FOR PS
                                      (OCTOBER 1, 2010 DOLLARS)
                                           Base
                                          Project    Location     Delta Cost   Total Location
                                           Cost      Percent      Difference    Project Cost
           State               City       ($/kW)     Variation      ($/kW)         ($/kW)
Alaska                 Anchorage           5,595       17.6%         985           6,580
Alaska                 Fairbanks           5,595       24.7%        1,382          6,977
Alabama                Huntsville          5,595       -7.4%         (413)         5,182
Arizona                Phoenix             5,595       -5.7%         (322)         5,273
Arkansas               Little Rock         5,595       -6.0%         (335)         5,260
California             Los Angeles         5,595       7.1%          398           5,993
California             Redding             5,595       2.5%          141           5,736
California             Bakersfield         5,595       3.0%          166           5,761
California             Sacramento          5,595       7.5%          422           6,017
California             San Francisco       5,595       17.8%         994           6,589
Colorado               Denver              5,595       -5.9%         (329)         5,266
Connecticut            Hartford            5,595           7.0%      392           5,987
Delaware               Dover               5,595           4.3%      243           5,838
District of Columbia   Washington          5,595           2.8%      155           5,750
Florida                Tallahassee           0              0         0              0
Florida                Tampa                 0              0         0              0
Georgia                Atlanta             5,595       -8.0%         (449)         5,146
Hawaii                 Honolulu            5,595       15.8%         883           6,478
Idaho                  Boise               5,595       -4.9%         (273)         5,322
Illinois               Chicago             5,595       16.2%         907           6,502
Indiana                Indianapolis        5,595       -1.1%         (64)          5,531
Iowa                   Davenport           5,595       -1.2%          (66)         5,529
Iowa                   Waterloo            5,595       -8.5%         (476)         5,119
Kansas                 Wichita               0              0         0              0
Kentucky               Louisville          5,595       -6.1%         (341)         5,254
Louisiana              New Orleans         5,595       -9.3%         (519)         5,076
Maine                  Portland            5,595       -5.2%         (290)         5,305
Maryland               Baltimore           5,595       -2.0%         (110)         5,485
Massachusetts          Boston              5,595       15.5%         869           6,464
Michigan               Detroit             5,595       3.5%           196          5,791
Michigan               Grand Rapids        5,595       -7.4%         (413)         5,182
Minnesota              St. Paul            5,595           3.0%      168           5,763
Mississippi            Jackson             5,595       -7.3%         (410)         5,185
Missouri               St. Louis           5,595           4.0%      222           5,817
Missouri               Kansas City         5,595           2.4%      136           5,731
Montana                Great Falls         5,595       -5.1%         (286)         5,309
Nebraska               Omaha               5,595       -3.7%         (209)         5,386
New Hampshire          Concord             5,595       -2.5%         (140)         5,455
New Jersey             Newark              5,595       15.5%         867           6,462
New Mexico             Albuquerque         5,595       -4.4%         (245)         5,350


                                                    20-4
Base
                                       Project    Location        Delta Cost    Total Location
                                        Cost      Percent         Difference     Project Cost
           State           City        ($/kW)     Variation         ($/kW)          ($/kW)
  New York            New York          5,595       34.3%           1,921           7,516
  New York            Syracuse          5,595       -0.2%            (13)           5,582
  Nevada              Las Vegas         5,595           5.8%         326            5,921
  North Carolina      Charlotte         5,595       -10.7%           (599)          4,996
  North Dakota        Bismarck          5,595       -7.1%            (399)          5,196
  Ohio                Cincinnati        5,595       -3.9%            (220)          5,375
  Oregon              Portland          5,595           3.1%         171            5,766
  Pennsylvania        Philadelphia      5,595       11.0%             615           6,210
  Pennsylvania        Wilkes-Barre      5,595       -4.3%            (243)          5,352
  Rhode Island        Providence        5,595           3.7%         209            5,804
  South Carolina      Spartanburg       5,595       -12.2%           (684)          4,911
  South Dakota        Rapid City        5,595       -10.2%           (569)          5,026
  Tennessee           Knoxville         5,595       -9.4%            (526)          5,069
  Texas               Houston           5,595       -9.3%            (523)          5,072
  Utah                Salt Lake City    5,595       -6.2%            (344)          5,251
  Vermont             Burlington        5,595       -5.5%            (309)          5,286
  Virginia            Alexandria        5,595       -2.2%            (121)          5,474
  Virginia            Lynchburg         5,595       -6.5%            (366)          5,229
  Washington          Seattle           5,595        5.4%             305           5,900
  Washington          Spokane           5,595       -3.5%            (197)          5,398
  West Virginia       Charleston        5,595       -2.0%            (114)          5,481
  Wisconsin           Green Bay         5,595       -2.8%            (157)          5,438
  Wyoming             Cheyenne          5,595       -5.8%            (324)          5,271
  Puerto Rico         Cayey             5,595       -1.7%            (95)           5,500

20.5 O&M ESTIMATE
The O&M discussion in Section 17.5, related to the HY Facility at a high-level is applicable to
the PS Facility, including the fact that most operators budget for a given PS facility on a FOM
expense basis only. The additional areas of O&M that are applicable to the PS Facility that are
not applicable to the HY Facility are pump and associated motor maintenance. Table 20-3
presents the O&M expenses for the PS Facility.
                            TABLE 20-3 – O&M EXPENSES FOR PS
                        Technology:                                  PS
                    Fixed O&M Expense                          $13.03/kW-year
                   Variable O&M Expense                           $0/MWh

20.6 ENVIRONMENTAL COMPLIANCE INFORMATION
The PS Facility does not directly burn a fuel and consequently there are no air emissions from
this type of plant. Note that the fuel used to power the off-peak energy market, allowing
off-peak pumping to the reservoir, is not considered in this report. Table 20-4 presents
environmental emissions for the PS Facility.


                                                 20-5
TABLE 20-4 – ENVIRONMENTAL EMISSIONS FOR PS
   Technology:                 PS
      NOX                 0 lb/MMBtu
       SO2                0 lb/MMBtu
       CO2                0 lb/MMBtu


                   20-6
21. ONSHORE WIND (WN)

21.1 MECHANICAL EQUIPMENT AND SYSTEMS
The Onshore Wind (“WN”) Facility is based on 67 wind turbine generators (“WTGs”), each with
a rated capacity of 1.5 MW. The total design capacity is 100 MW.

The turbines are each supported by a conical steel tower, which is widest at the base and tapers
in diameter just below the nacelle. A foundation provides the tower with a firm anchor to the
ground. The nacelle is attached to the top of the tower and contains the main mechanical
components of the wind turbine, which include a variable-speed generator, transmission, and
yaw drive. The rotor hub connects to the transmission through one end of the nacelle, and the
rotor is then connected to the hub. The WTG has a three-bladed rotor with a diameter of
77 meters. The WTG has an active yaw system in the nacelle to keep the rotor facing into the
wind.
Power is generated by the wind turbines, then converted using an onboard transformer to
34.5 kV AC. It is then delivered to a collection system at the base of each turbine. Power from
all turbines will be collected by the underground collection circuit.
The collection system supplies power to a new substation designed to step up the voltage to
115 kV for interconnection with the transmission system. Other facility components include
access roads, an O&M building and electrical interconnection facilities. Figure 21-1 presents a
picture of a typical WN Facility.
                     FIGURE 21-1 – WN DESIGN CONFIGURATION


                                             21-1
21.2 ELECTRICAL AND CONTROL SYSTEMS
The WN Facility has 67 wind turbine-driven electric generators. Each generator is a doubly-fed
induction generator that feeds an AC/DC/AC power converter that provides an output of
three-phase, 60 Hz electrical power. The power output available is approximately 1.75 MVA
with an output voltage of 575 V stepped up to 34.5 kV using a pad-mounted transformer at the
base of the wind turbine. The wind turbine transformers are interconnected on one or more
underground collector circuits that are connected to a collector bus through a circuit breaker for
each circuit. The collector bus is connected to a high-voltage transmission system through the
facility substation, which includes a 34.5 kV switch or circuit breaker, GSU, high-voltage circuit
breaker, and a disconnect switch. The GSU increases the voltage from the electric generator
from 34.5 kV to interconnected transmission system high voltage.
The WN Facility is controlled using a control system generally referred to as the wind farm
supervisory control and data acquisition (“SCADA”) system. The SCADA system provides
centralized control of the facility by integrating the control systems provided with each of the
wind turbines and the control of BOP systems and equipment.

21.3 OFF-SITE REQUIREMENTS
Since wind uses a renewable fuel, the most significant off-site requirements are the construction
of and interconnection to roads and the electrical interconnection to the utility high-voltage
transmission system, as discussed in Section 19.2.

21.4 CAPITAL COST ESTIMATE
The base Cost Estimate for the WN Facility with a nominal capacity of 100 MW is $2,400/kW.
Table 21-1 summarizes the Cost Estimate categories for the WN Facility.


                                              21-2
TABLE 21-1 – LOCATION-BASED COSTS FOR WN
                                      Technology: WN
                            Nominal Capacity (ISO): 100,000 kW
                           Nominal Heat Rate (ISO): N/A Btu/kWh-HHV

      Capital Cost Category                                                          (000s) (October 1, 2010$)

      Civil Structural Material and Installation                                                 25,625

      Mechanical Equipment Supply and
      Installation                                                                              158,585

      Electrical / I&C Supply and Installation                                                   27,753

      Project Indirects (1)                                                                       8,070

      EPC Cost before Contingency and Fee                                                       220,033

      Fee and Contingency                                                                        10,000

      Total Project EPC                                                                         230,033

      Owner Costs (excluding project finance)                                                    13,802

      Total Project Cost (excluding finance)                                                    243,835

      Total Project EPC                                                / kW                       2,300

      Owner Costs 6% (excluding project finance)                       / kW                        138

      Total Project Cost (excluding project finance)                   / kW                       2,438

      (1) Includes engineering, distributable costs, scaffolding, construction management, and start-up.


For this type of technology and power plant configuration, our regional adjustments took into
consideration the following: seismic design differences, remote location issues, labor wage and
productivity differences, location adjustments, and owner cost differences and the increase in
overheads associated with these five adjustments.
Seismic design differences among the various locations were based on U.S. seismic map
information that detailed the various seismic zones throughout the U.S. No cost increases were
associated with seismic Zone 0 and cost step increases were considered for Zones 1, 2, 3 and 4.
Remote location issues are related to geographic areas that typically require installation of man
camps, higher craft incentives, and higher per diems are generally required with respect to
construction, due to the fact that such areas are long distances from urban areas, where labor is
generally abundant. Remote location designations were also considered in locations where
higher equipment freight costs are typically incurred, which for example are regions not near
established rail or highway access. Remote locations related to the WN Facility include


                                                           21-3
Fairbanks, Alaska; Honolulu, Hawaii; Albuquerque, New Mexico; Cheyenne, Wyoming; and
Cayey, Puerto Rico.
Labor wage and productivity differences were handled as discussed in Section 2.5.1, taking into
consideration the amount of labor we estimated for the WN Facility.
Location adjustments were made to locations where higher cost of living levels are incurred
and/or where population density generally correlates to higher construction costs for power and
other infrastructure projects. These locations include Alaska, California, Connecticut, Delaware,
District of Columbia, Hawaii, Illinois, Maine, Maryland, Massachusetts, Michigan, Minnesota,
New York, Ohio, and Wisconsin.
Owner costs were reviewed based on the need for utility upgrades and/or infrastructure costs
such as new facility transmission lines to tie to existing utility transmission substations or
existing transmission lines.
Table 21-2 presents the WN Facility capital cost variations for alternative U.S. plant locations.
                         TABLE 21-2 – LOCATION-BASED COSTS FOR WN
                                         (OCTOBER 1, 2010 DOLLARS)
                                              Base
                                             Project    Location      Delta Cost   Total Location
                                              Cost      Percent       Difference    Project Cost
             State                City       ($/kW)     Variation       ($/kW)         ($/kW)
  Alaska                  Anchorage           2,440           25.2%      615           3,055
  Alaska                  Fairbanks           2,440           45.0%     1,099          3,539
  Alabama                 Huntsville          2,440           -3.5%      (86)          2,354
  Arizona                 Phoenix             2,440           -2.4%      (58)          2,382
  Arkansas                Little Rock         2,440           -2.5%      (61)          2,379
  California              Los Angeles         2,440           12.4%      304           2,744
  California              Redding             2,440            8.2%      200           2,640
  California              Bakersfield         2,440           10.0%      243           2,683
  California              Sacramento          2,440           10.5%      257           2,697
  California              San Francisco       2,440           18.6%      453           2,893
  Colorado                Denver              2,440           2.2%        54           2,494
  Connecticut             Hartford            2,440           6.6%       162           2,602
  Delaware                Dover               2,440           4.6%       111           2,551
  District of Columbia    Washington          2,440           7.4%       182           2,622
  Florida                 Tallahassee         2,440           -5.3%      (128)         2,312
  Florida                 Tampa               2,440           -2.2%       (53)         2,387
  Georgia                 Atlanta             2,440           -3.9%      (94)          2,346
  Hawaii                  Honolulu            2,440           27.4%      668           3,108
  Idaho                   Boise               2,440           3.4%        83           2,523
  Illinois                Chicago             2,440           14.2%      346           2,786
  Indiana                 Indianapolis        2,440           0.3%        8            2,448
  Iowa                    Davenport           2,440           4.5%       111           2,551
  Iowa                    Waterloo            2,440           0.7%        18           2,458
  Kansas                  Wichita             2,440           1.9%        46           2,486
  Kentucky                Louisville          2,440           -2.9%      (70)          2,370


                                                       21-4
Base
                                      Project    Location      Delta Cost      Total Location
                                       Cost      Percent       Difference       Project Cost
           State           City       ($/kW)     Variation       ($/kW)            ($/kW)
  Louisiana          New Orleans       2,440           -5.4%      (132)             2,308
  Maine              Portland          2,440           6.4%       155               2,595
  Maryland           Baltimore         2,440           1.7%        41               2,481
  Massachusetts      Boston            2,440           11.1%      270               2,710
  Michigan           Detroit           2,440            2.7%       67               2,507
  Michigan           Grand Rapids      2,440           -3.2%      (78)              2,362
  Minnesota          St. Paul          2,440           7.5%       183               2,623
  Mississippi        Jackson           2,440           -3.5%      (85)              2,355
  Missouri           St. Louis         2,440           3.6%        88               2,528
  Missouri           Kansas City       2,440           1.7%        41               2,481
  Montana            Great Falls       2,440           3.9%        95               2,535
  Nebraska           Omaha             2,440           3.5%        86               2,526
  New Hampshire      Concord           2,440           5.3%       128               2,568
  New Jersey         Newark            2,440           10.5%      257               2,697
  New Mexico         Albuquerque       2,440           3.8%        93               2,533
  New York           New York          2,440           24.6%      600               3,040
  New York           Syracuse          2,440            0.8%      20                2,460
  Nevada             Las Vegas         2,440           9.0%       219               2,659
  North Carolina     Charlotte         2,440           -4.9%      (120)             2,320
  North Dakota       Bismarck          2,440           2.1%        50               2,490
  Ohio               Cincinnati        2,440           -1.9%      (47)              2,393
  Oregon             Portland          2,440           8.0%       196               2,636
  Pennsylvania       Philadelphia      2,440            6.1%      150               2,590
  Pennsylvania       Wilkes-Barre      2,440           -1.8%      (44)              2,396
  Rhode Island       Providence        2,440           2.1%        51               2,491
  South Carolina     Spartanburg       2,440           -5.7%      (140)             2,300
  South Dakota       Rapid City        2,440           0.7%        17               2,457
  Tennessee          Knoxville         2,440           -4.6%      (111)             2,329
  Texas              Houston           2,440           -4.8%      (118)             2,322
  Utah               Salt Lake City    2,440           3.7%        90               2,530
  Vermont            Burlington        2,440           3.4%        83               2,523
  Virginia           Alexandria        2,440            1.9%       46               2,486
  Virginia           Lynchburg         2,440           -3.1%      (75)              2,365
  Washington         Seattle           2,440           4.4%       107               2,547
  Washington         Spokane           2,440           4.9%       120               2,560
  West Virginia      Charleston        2,440           -0.1%       (3)              2,437
  Wisconsin          Green Bay         2,440           -1.0%      (25)              2,415
  Wyoming            Cheyenne          2,440           4.3%       105               2,545
  Puerto Rico        Cayey             2,440           6.9%       167               2,607

21.5 O&M ESTIMATE
In addition to the general items discussed in the section of the report entitled O&M Estimate, the
major areas for O&M for an Onshore Wind Facility include periodic gearbox, WTG, electric


                                                21-5
generator, and associated electric conversion (e.g., GSU) technology repairs and replacement.
These devices typically undergo major maintenance every five to seven years. Table 21-3
presents the O&M expenses for the WN Facility.
                        TABLE 21-3 – O&M EXPENSES FOR WN
                     Technology:                              WN
                 Fixed O&M Expense                      $28.07/kW-year
                Variable O&M Expense                       $0/MWh

21.6 ENVIRONMENTAL COMPLIANCE INFORMATION
Since wind utilizes a renewable fuel and no additional fuel is combusted to make power from an
Onshore Wind Facility, air emissions are not created. Table 21-4 presents environmental
emissions for the WN Facility.
                TABLE 21-4 – ENVIRONMENTAL EMISSIONS FOR WN
                      Technology:                      WN
                         NOX                       0 lb/MMBtu
                          SO2                      0 lb/MMBtu
                          CO2                      0 lb/MMBtu


                                            21-6
22. OFFSHORE WIND (WF)

22.1 MECHANICAL EQUIPMENT AND SYSTEMS
The Offshore Wind (“WF”) Facility is based on 80 offshore WTGs, each with a rated capacity of
5.0 MW. The total design capacity is 400 MW.

The turbines are each supported by a conical steel tower, which is widest at the base and tapers
in diameter just below the nacelle. A foundation provides the tower with a firm anchor to the
ground. The nacelle is attached to the top of the tower and contains the main mechanical
components of the wind turbine, which include a variable-speed generator, transmission, and
yaw drive. The rotor hub connects to the transmission through one end of the nacelle, and the
rotor is then connected to the hub. The WTG has a three-bladed rotor with a diameter of
approximately 125 meters. The WTG has an active yaw system in the nacelle to keep the rotor
facing into the wind. The WF WTG is designed to withstand the conditions of the high seas,
including additional redundancy of key components to enhance availability, corrosion protection
and permanent monitoring.
Power is generated by the wind turbines, then converted using an onboard transformer to
34.5 kV AC. It is then delivered to a collection system at the base of each turbine. Power from
all turbines is collected by the underground collection circuit.
The collection system supplies power to a new substation designed to step up the voltage to
115 kV for interconnection with the transmission system. Figure 22-1 presents a picture of a
currently operating WF Facility.


                                             22-1
FIGURE 22-1 – WF DESIGN CONFIGURATION


22.2 ELECTRICAL AND CONTROL SYSTEMS
The WF Facility has 80 wind turbine-driven electric generators. Each generator is a doubly-fed
induction generator that feeds an AC/DC/AC power converter that provides an output of three-
phase, 60 Hz electrical power. The power output available is approximately 5.5 MVA with an
output voltage of 690 V stepped up to 34.5 kV using a transformer installed in the wind turbine
pylon. The wind turbine transformers are interconnected on one or more underwater collector
circuits trenched into the seabed that are connected to a collector bus (or several collector busses)
through a circuit breaker for each circuit. The collector bus is connected to a high-voltage
transmission system through the facility substation that includes a 34.5 kV switch or circuit
breaker, GSU, high-voltage circuit breaker and a disconnect switch. If there are multiple
collector busses this arrangement may be replicated for each bus. The GSU increases the voltage
from the electric generator from 34.5 kV to interconnected transmission system high voltage.
The WF Facility is controlled using a SCADA system. The SCADA system provides centralized
control of the facility by integrating the control systems provided with each of the wind turbines
and the control of BOP systems and equipment.

22.3 OFF-SITE REQUIREMENTS
Similar to the WF Facility, the most significant off-site requirement for the WF Facility is the
electrical interconnection to the utility transmission system, as discussed directly above.


                                                22-2
22.4 CAPITAL COST ESTIMATE
The base Cost Estimate for the WF Facility with a nominal capacity of 400 MW is $5,975/kW.
Table 22-1 summarizes the Cost Estimate categories for the WF Facility.
       TABLE 22-1 – BASE PLANT SITE CAPITAL COST ESTIMATE FOR WF
                                      Technology: WF
                            Nominal Capacity (ISO): 400,000 kW
                           Nominal Heat Rate (ISO): N/A Btu/kWh-HHV

      Capital Cost Category                                                          (000s) (October 1, 2010$)

      Civil Structural Material and Installation                                                252,000

      Mechanical Equipment Supply and
      Installation                                                                              835,328

      Electrical / I&C Supply and Installation                                                  148,302

      Project Indirects (1)                                                                     463,856

      EPC Cost before Contingency and Fee                                                      1,699,486

      Fee and Contingency                                                                       212,436

      Total Project EPC                                                                        1,911,922

      Owner Costs (excluding project finance)                                                   477,981

      Total Project Cost (excluding finance)                                                   2,389,903

      Total Project EPC                                                / kW                       4,780

      Owner Costs 25% (excluding project finance)                      / kW                       1,195

      Total Project Cost (excluding project finance)                   / kW                       5,975

      (1) Includes engineering, distributable costs, scaffolding, construction management, and start-up.


For this type of technology and power plant configuration, our regional adjustments took into
consideration the following: seismic design differences, remote location issues, labor wage and
productivity differences, location adjustments, owner cost differences, and the increase in
overheads associated with these five location adjustments. The assumption was made that
offshore wind projects would only be constructed offshore of the following states (where
significant offshore wind resource is available): Alaska, California, Connecticut, Delaware,
District of Columbia, Georgia, Hawaii, Illinois, Indiana, Maine, Maryland, Massachusetts,
Michigan, Minnesota, New Jersey, New York, North Carolina, Oregon, Rhode Island, South
Carolina, Texas, Virginia, Washington, Wisconsin and Puerto Rico.


                                                           22-3
Seismic design differences among the various locations were based on U.S. seismic map
information that detailed the various seismic zones throughout the U.S. No cost increases were
associated with seismic Zone 0 and cost step increases were considered for Zones 1, 2, 3 and 4.
Remote locations issues are related to geographic areas that typically require installation of man
camps, higher craft incentives, and higher per diems for construction, because such areas are
long distances from urban areas, where labor is generally abundant. Remote location
designations were also considered in locations where higher equipment freight costs are typically
incurred, which for example are regions not near established rail or highway access. Remote
locations related to the Offshore Wind Facility include Fairbanks, Alaska; Honolulu, Hawaii; and
Cayey, Puerto Rico.
Labor wage and productivity differences were handled as discussed in Section 2.5.1, taking into
consideration the amount of labor we estimated for the WF Facility.
Location adjustments were made to locations where higher cost of living levels are incurred
and/or where population density generally correlates to higher construction costs for power and
other infrastructure projects. These locations include Alaska, California, Connecticut, Delaware,
District of Columbia, Hawaii, Maine, Maryland, Massachusetts, New York, and Wisconsin.
Owner costs were reviewed based on the need for utility upgrades and/or infrastructure costs
such as new facility transmission lines to tie to existing utility transmission substations or
existing transmission lines.
Table 22-2 presents the WF Facility capital cost variations for alternative U.S. plant locations.


                                               22-4
TABLE 22-2 – LOCATION-BASED COSTS FOR WF
                                       (OCTOBER 1, 2010 DOLLARS)
                                            Base
                                           Project    Location      Delta Cost   Total Location
                                            Cost      Percent       Difference    Project Cost
           State                City       ($/kW)     Variation       ($/kW)         ($/kW)
Alaska                  Anchorage           5,975       15.9%          952           6,927
Alaska                  Fairbanks             0          0.0%
Alabama                 Huntsville            0             0.0%
Arizona                 Phoenix               0             0.0%
Arkansas                Little Rock           0             0.0%
California              Los Angeles         5,975        7.7%          460           6,435
California              Redding               0          0.0%
California              Bakersfield           0          0.0%
California              Sacramento            0          0.0%
California              San Francisco       5,975       16.6%          993           6,968
Colorado                Denver                0             0.0%
Connecticut             Hartford            5,975           5.7%       342           6,317
Delaware                Dover               5,975           3.1%       184           6,159
District of Columbia    Washington          5,975           1.8%       110           6,085
Florida                 Tallahassee           0             0.0%
Florida                 Tampa                 0             0.0%
Georgia                 Atlanta             5,975           -7.0%      (418)         5,557
Hawaii                  Honolulu            5,975       14.5%          864           6,839
Idaho                   Boise                 0             0.0%
Illinois                Chicago             5,975       16.0%          958           6,933
Indiana                 Indianapolis        5,975           -1.0%      (58)          5,917
Iowa                    Davenport             0             0.0%
Iowa                    Waterloo              0             0.0%
Kansas                  Wichita               0             0.0%
Kentucky                Louisville            0             0.0%
Louisiana               New Orleans           0             0.0%
Maine                   Portland            5,975           -2.6%      (156)         5,819
Maryland                Baltimore           5,975           -2.1%      (126)         5,849
Massachusetts           Boston              5,975       13.2%          787           6,762
Michigan                Detroit             5,975            2.8%       165          6,140
Michigan                Grand Rapids        5,975           -6.7%      (403)         5,572
Minnesota               St. Paul            5,975           4.8%       288           6,263
Mississippi             Jackson               0             0.0%
Missouri                St. Louis             0             0.0%
Missouri                Kansas City           0             0.0%
Montana                 Great Falls           0             0.0%
Nebraska                Omaha                 0             0.0%
New Hampshire           Concord               0             0.0%
New Jersey              Newark              5,975       12.7%          761           6,736
New Mexico              Albuquerque           0             0.0%


                                                     22-5
Base
                                       Project    Location         Delta Cost    Total Location
                                        Cost      Percent          Difference     Project Cost
           State           City        ($/kW)     Variation          ($/kW)          ($/kW)
  New York            New York          5,975       29.4%             759            7,734
  New York            Syracuse          5,975       -1.2%             (69)           5,906
  Nevada              Las Vegas           0             0.0%
  North Carolina      Charlotte         5,975           -9.3%         (557)          5,418
  North Dakota        Bismarck            0             0.0%
  Ohio                Cincinnati          0             0.0%
  Oregon              Portland          5,975           5.1%          302            6,277
  Pennsylvania        Philadelphia        0             0.0%
  Pennsylvania        Wilkes-Barre        0             0.0%
  Rhode Island        Providence        5,975           2.5%           48            6,123
  South Carolina      Spartanburg       5,975           -6.6%         (391)          5,584
  South Dakota        Rapid City          0             0.0%
  Tennessee           Knoxville           0             0.0%
  Texas               Houston           5,975           -8.2%         (487)          5,488
  Utah                Salt Lake City      0             0.0%
  Vermont             Burlington          0             0.0%
  Virginia            Alexandria        5,975       -2.7%             (161)          5,814
  Virginia            Lynchburg         5,975       -5.7%             (340)          5,635
  Washington          Seattle           5,975           4.8%          287            6,262
  Washington          Spokane             0             0.0%
  West Virginia       Charleston          0             0.0%
  Wisconsin           Green Bay         5,975           -2.7%         (164)          5,811
  Wyoming             Cheyenne            0             0.0%
  Puerto Rico         Cayey             5,975           -1.2%         (72)           5,903

22.5 O&M ESTIMATE
The types of maintenance performed on the WF Facility are materially similar to the WN
Facility, discussed in Section 19.5; however, the expenses are higher because maintaining
offshore parts is considerably more complicated, due to staging on ships and with helicopters.
Table 22-3 presents the FOM and VOM expenses for the WF Facility.
                           TABLE 22-3 – O&M EXPENSES FOR WF
                        Technology:                                   WF
                    Fixed O&M Expense                           $53.33/kW-year
                   Variable O&M Expense                            $0/MWh

22.6 ENVIRONMENTAL COMPLIANCE INFORMATION
Since the WF Facility uses a renewable fuel and no additional fuel is combusted, there are no air
emissions. Table 22-4 presents environmental emissions for the WF Facility.


                                                 22-6
TABLE 22-4 – ENVIRONMENTAL EMISSIONS FOR WF
    Technology:                WF
       NOX                0 lb/MMBtu
        SO2               0 lb/MMBtu
        CO2               0 lb/MMBtu


                   22-7
23. SOLAR THERMAL - CENTRAL STATION (SO)

23.1 MECHANICAL EQUIPMENT AND SYSTEMS
The 100 MW Solar Thermal (“SO”) Facility uses a solar concentrating thermal process based on
direct steam, power towers, and heliostat mirror technology. The SO Facility incorporates a
Rankine-cycle reheat ST which receives steam from a solar steam generator and a solar
superheater and reheated steam from a solar reheater. The solar steam generator, solar
superheater, and solar reheater are all installed at the top of a tower adjacent to a power block
located at grade. The tower and power block are generally in the center of a heliostat solar field.
The solar energy heats water in the steam generator, superheater and reheat boiler to make steam
that runs the ST. The solar field and power generation equipment are started up each morning
after sunrise and insolation (or light intensity) build-up, and are shut down in the evening when
insolation drops below the level required for keeping the ST online.
A partial load natural gas-fired boiler is used for thermal input to the ST during the morning
start-up cycle. The boiler is also generally operated during transient cloudy conditions, in order
to keep the ST online and ready to resume production from solar thermal input, after the clouds
clear. After the cloud passes and solar-to-thermal input resumes, the ST will be returned to full
solar production and the gas-fired boiler is shut down. While permitting SO facilities with
respect to water usage continues to be a challenge, our base assumption is that the SO Facility
uses wet cooling technology.
The power block consists of one solar power tower and an ST with a reheat cycle, and it uses
typical auxiliary components for heat rejection, water treatment, water disposal, and
interconnection to the grid. Figure 23-1 presents a picture of a typical SO Facility.


                                               23-1
FIGURE 23-1 – SO DESIGN CONFIGURATION


23.2 ELECTRICAL AND CONTROL SYSTEMS
The SO Facility has one ST electric generator. The generator is a 60 Hz machine rated at
approximately 120 MVA with an output voltage of 13.8 kV. The ST electric generator is
connected to a high-voltage bus in the facility switchyard via a dedicated generator circuit
breaker, GSU, high-voltage circuit breaker and a disconnect switch. The GSU increases the
voltage from the electric generator from 13.8 kV to interconnected transmission system high
voltage.


                                           23-2
The SO Facility is controlled using a DCS. The DCS provides centralized control of the facility
by integrating the control systems provided with the solar steam generator/superheater/reheater
system, ST and associated electric generator, and the control of BOP systems and equipment.

23.3 OFF-SITE REQUIREMENTS
Natural gas is delivered to the facility through a lateral connected to the local natural gas trunk
line. Water for all processes at the SO Facility is obtained from a one of several available water
sources (e.g., municipal water supply); however, due to the remote location of most solar thermal
power plants, water is often sourced through on-site wells. The SO Facility uses a water
treatment system and a high-efficiency reverse osmosis system to reduce the dissolved solids
from the cooling water and to provide distilled water for HRSG make-up. Processed wastewater
is sent to a municipal wastewater system, re-injected on-site, or an on-site ZLD system. Further,
the electrical interconnection from the SO Facility on-site switchyard is effectuated by a
connection to an adjacent utility substation.

23.4 CAPITAL COST ESTIMATE
The base Cost Estimate for the SO Facility with a nominal capacity of 100 MW is $4,692/kW.
Table 23-1 summarizes the Cost Estimate categories for the SO Facility.


                                               23-3
TABLE 23-1 – BASE PLANT SITE CAPITAL COST ESTIMATE FOR SO
                                       Technology: SO
                             Nominal Capacity (ISO): 100,000 kW
                            Nominal Heat Rate (ISO): N/A Btu/kWh-HHV (2)

      Capital Cost Category                                                          (000s) (October 1, 2010$)

      Civil Structural Material and Installation                                                  48,475

      Mechanical Equipment Supply and
      Installation                                                                               254,250

      Electrical / I&C Supply and Installation                                                    40,750

      Project Indirects (1)                                                                       39,500

      EPC Cost before Contingency and Fee                                                        382,975

      Fee and Contingency                                                                         25,000

      Total Project EPC                                                                          407,975

      Owner Costs (excluding project finance)                                                     61,196

      Total Project Cost (excluding finance)                                                     469,171

      Total Project EPC                                                 / kW                       4,080

      Owner Costs 15% (excluding project finance)                       / kW                        612

      Total Project Cost (excluding project finance)                    / kW                       4,692

      (1)   Includes engineering, distributable costs, scaffolding, construction management, and start-up.
      (2)   Does not include natural gas firing, as such usage is sporadic and highly dependent on time of year and
            method of operation.


For this type of technology and power plant configuration, our regional adjustments took into
consideration the following: seismic design differences, remote location issues, labor wage and
productivity differences, location adjustments, owner cost differences, and the increase in
overheads associated with the previous five location adjustments.
Seismic design differences among the various locations were based on U.S. seismic map
information that detailed the various seismic zones throughout the U.S. No cost increases were
associated with seismic Zone 0 and cost step increases were considered for Zones 1, 2, 3 and 4.
Remote location issues are related to geographic areas that typically require installation of man
camps, higher craft incentives, and higher per diems are generally required with respect to
construction, due to the fact that such areas are long distances from urban areas, where labor is
generally abundant. Remote location designations were also considered in locations where
higher equipment freight costs are typically incurred, which for example are regions not near


                                                            23-4
established rail or highway access. Remote locations related to the Solar Thermal Facility
include Honolulu, Hawaii; Albuquerque, New Mexico; Cheyenne, Wyoming; and Cayey, Puerto
Rico.
Labor wage and productivity differences were handled as discussed in Section 2.5.1, taking into
consideration the amount of labor we estimated for the SO Facility.
Location adjustments were made to locations where higher cost of living levels are incurred
and/or where population density generally correlates to higher construction costs for power and
other infrastructure projects. These locations include Alaska, California, Connecticut, Delaware,
District of Columbia, Hawaii, Illinois, Maine, Maryland, Massachusetts, Michigan, Minnesota,
New York, Ohio, and Wisconsin.
Owner costs were reviewed based on the need for utility upgrades and/or infrastructure costs
such as new facility transmission lines to tie to existing utility transmission substations or
existing transmission lines.
Table 23-2 presents the SO Facility capital cost variations for alternative U.S. plant locations.


                                                23-5
TABLE 23-2 – LOCATION-BASED COSTS FOR SO
                                      (OCTOBER 1, 2010 DOLLARS)
                                           Base
                                          Project    Location      Delta Cost   Total Location
                                           Cost      Percent       Difference    Project Cost
           State               City       ($/kW)     Variation       ($/kW)         ($/kW)
Alaska                 Anchorage           4,700       23.8%         1,119          5,819
Alaska                 Fairbanks           4,700       35.4%         1,662          6,362
Alabama                Huntsville          4,700       -11.3%         (532)         4,168
Arizona                Phoenix             4,700           -8.9%      (417)         4,283
Arkansas               Little Rock         4,700           -9.3%      (435)         4,265
California             Los Angeles         4,700       11.4%          538           5,238
California             Redding             4,700        6.3%          297           4,997
California             Bakersfield         4,700        6.7%          316           5,016
California             Sacramento          4,700       13.3%          623           5,323
California             San Francisco       4,700       26.8%         1,261          5,961
Colorado               Denver              4,700           -7.3%      (344)         4,356
Connecticut            Hartford            4,700           9.2%       431           5,131
Delaware               Dover               4,700           4.7%       220           4,920
District of Columbia   Washington          4,700           1.6%        74           4,774
Florida                Tallahassee         4,700       -15.5%         (727)         3,973
Florida                Tampa               4,700        -6.4%         (300)         4,400
Georgia                Atlanta             4,700       -12.3%         (578)         4,122
Hawaii                 Honolulu            4,700       39.8%         1,871          6,571
Idaho                  Boise               4,700           -4.8%      (225)         4,475
Illinois               Chicago             4,700       26.8%         1,262          5,962
Indiana                Indianapolis        4,700           -1.9%      (90)          4,610
Iowa                   Davenport           4,700         0.4%           20          4,720
Iowa                   Waterloo            4,700       -10.8%         (505)         4,195
Kansas                 Wichita             4,700           -8.3%      (392)         4,308
Kentucky               Louisville          4,700           -9.4%      (440)         4,260
Louisiana              New Orleans         4,700       -15.9%         (748)         3,952
Maine                  Portland            4,700           -5.9%      (278)         4,422
Maryland               Baltimore           4,700           -4.4%      (209)         4,491
Massachusetts          Boston              4,700       22.2%         1,043          5,743
Michigan               Detroit             4,700         4.8%          224          4,924
Michigan               Grand Rapids        4,700       -11.8%         (554)         4,146
Minnesota              St. Paul            4,700           7.2%       340           5,040
Mississippi            Jackson             4,700       -11.2%         (528)         4,172
Missouri               St. Louis           4,700           5.7%       270           4,970
Missouri               Kansas City         4,700           3.1%       144           4,844
Montana                Great Falls         4,700           -5.3%      (248)         4,452
Nebraska               Omaha               4,700           -3.5%      (165)         4,535
New Hampshire          Concord             4,700           -1.7%      (80)          4,620
New Jersey             Newark              4,700       22.2%         1,042          5,742
New Mexico             Albuquerque         4,700           -4.6%      (217)         4,483


                                                    23-6
Base
                                       Project    Location         Delta Cost    Total Location
                                        Cost      Percent          Difference     Project Cost
           State           City        ($/kW)     Variation          ($/kW)          ($/kW)
  New York            New York          4,700       50.1%            2,355           7,055
  New York            Syracuse          4,700       -2.4%            (114)           4,586
  Nevada              Las Vegas         4,700       11.5%             542            5,242
  North Carolina      Charlotte         4,700       -16.4%            (772)          3,928
  North Dakota        Bismarck          4,700           -8.8%         (412)          4,288
  Ohio                Cincinnati        4,700           -6.6%         (310)          4,390
  Oregon              Portland          4,700           5.9%          277            4,977
  Pennsylvania        Philadelphia      4,700       16.1%              758           5,458
  Pennsylvania        Wilkes-Barre      4,700       -7.3%             (341)          4,359
  Rhode Island        Providence        4,700           4.2%          196            4,896
  South Carolina      Spartanburg       4,700       -18.8%            (882)          3,818
  South Dakota        Rapid City        4,700       -12.8%            (604)          4,096
  Tennessee           Knoxville         4,700       -14.4%            (677)          4,023
  Texas               Houston           4,700       -14.2%            (670)          4,030
  Utah                Salt Lake City    4,700           -6.9%         (325)          4,375
  Vermont             Burlington        4,700           -7.2%         (338)          4,362
  Virginia            Alexandria        4,700        -4.8%            (225)          4,475
  Virginia            Lynchburg         4,700       -10.0%            (471)          4,229
  Washington          Seattle           4,700            8.0%          377           5,077
  Washington          Spokane           4,700           -2.7%         (127)          4,573
  West Virginia       Charleston        4,700           -3.3%         (155)          4,545
  Wisconsin           Green Bay         4,700           -4.9%         (232)          4,468
  Wyoming             Cheyenne          4,700           -7.0%         (320)          4,371
  Puerto Rico         Cayey             4,700           -4.0%         (190)          4,510

23.5 O&M ESTIMATE
The typical O&M expenses for the SO Facility include mirror cleaning, repair, and replacement;
thermal tube replacements; and BOP major maintenance. The BOP major maintenance is similar
to that which is performed on a combined-cycle plant: HRSG, ST, and electric generator major
maintenance, typically performed approximately every seven years. Additionally, most thermal
solar operators do not treat O&M on a variable basis, and consequently, all O&M expenses are
shown below on a fixed basis. Table 23-3 presents the O&M expenses for the SO Facility.
                           TABLE 23-3 – O&M EXPENSES FOR SO
                        Technology:                                   SO
                    Fixed O&M Expense                           $64.00/kW-year
                   Variable O&M Expense                            $0/MWh

23.6 ENVIRONMENTAL COMPLIANCE INFORMATION
Table 23-4 presents environmental emissions for the SO Facility.


                                                 23-7
TABLE 23-4 – ENVIRONMENTAL EMISSIONS FOR SO
   Technology:                 SO
      NOX                 0 lb/MMBtu
       SO2                0 lb/MMBtu
       CO2                0 lb/MMBtu


                   23-8
24. PHOTOVOLTAIC (CENTRAL STATION) FACILITY (PV)

24.1 MECHANICAL EQUIPMENT AND SYSTEMS
The following describes a nominally 7 MW Photovoltaic (“PV”) Facility. An analysis is also
provided for a nominally 150 MW PV Facility, which is essentially a significant expansion of the
7 MW Facility; however, a detailed technical description (due to the similarities with the 7 MW
Facility and the technology associated therewith) is not provided herein. The PV Facility uses
several ground-mounted, fixed-tilt semiconductor panels in an array to directly convert incident
solar radiation in the form of photons into DC electricity, which can then be inverted to AC.
Additional BOP components include metal racks and foundations to support fixed panels and
keep them aligned at the correct angle, a DC-to-AC inverter, AC and DC wiring, combiner boxes
where individual strings of panels are connected prior to being fed into the inverter, and a control
system to control and monitor output by adjusting the balance of voltage and current to yield
maximum power. Figure 22-1 presents a picture of a typical PV Facility.
                      FIGURE 24-1 – PV DESIGN CONFIGURATION


24.2 ELECTRICAL AND CONTROL SYSTEMS
The PV Facility is comprised of 20 half-megawatt building blocks, each block consisting of
groups of PV cells connected to a 500 kW inverter module. Groups of PV cells, or modules, are
connected in parallel to a combiner box which contains a fuse for each module. The PV cells
create DC electricity. The cables are routed from the modules to a combiner box and a number


                                               24-1
of combiner boxes are connected to the input of a 500 kW inverter module, which converts the
aggregate power from DC to three-phase AC electricity at an output voltage of 265 V. The
output voltage of the inverter modules is stepped up to a level of 13.8 kV through a series of
GSUs connected to the modules. Two modules are combined on each of transformer, each of
which is rated 1 MVA. The transformers are connected in groups to form circuits on an
underground collection system. The circuits are connected to a 13.8 kV circuit breaker and then
to the local utility distribution grid.
Each inverter module has its own integral control system. The aggregate of all the modules are
controlled through a SCADA system, typically provided by the inverter manufacturer.

24.3 OFF-SITE REQUIREMENTS
Unlike other power technologies discussed in this report, the essential off-site requirement for
which provisions must be made on a PV Facility are water supply (generally in limited
quantities) and an electrical interconnection between the PV Facility switchyard and the local
utility distribution system.

24.4 CAPITAL COST ESTIMATE
The base Cost Estimate for the PV Facility with a nominal capacity of 7 MW is 6,050/kW and
with a nominal capacity of 150 MW is $4,755/kW. Table 24-1 and Table 24-2 summarize the
Cost Estimate categories for the PV Facility.


                                             24-2
TABLE 24-1 – BASE PLANT SITE CAPITAL COST ESTIMATE FOR PV
                                Technology: PV
                      Nominal Capacity (ISO): 7,000 kW
                     Nominal Heat Rate (ISO): N/A Btu/kWh-HHV

Capital Cost Category                                                          (000s) (October 1, 2010$)

Civil Structural Material and Installation                                                  6,100

Mechanical Equipment Supply and
Installation                                                                               20,500

Electrical / I&C Supply and Installation                                                    3,550

Project Indirects (1)                                                                       3,665

EPC Cost before Contingency and Fee                                                        33,815

Fee and Contingency                                                                         4,000

Total Project EPC                                                                          37,815

Owner Costs (excluding project finance)                                                     4,538

Total Project Cost (excluding finance)                                                     42,353

Total Project EPC                                                / kW                       5,402

Owner Costs 12% (excluding project finance)                      / kW                        648

Total Project Cost (excluding project finance)                   / kW                       6,050

(1) Includes engineering, distributable costs, scaffolding, construction management, and start-up.


                                                     24-3
TABLE 24-2 – BASE PLANT SITE CAPITAL COST ESTIMATE FOR PV
                                      Technology: PV
                            Nominal Capacity (ISO): 150,000 kW
                           Nominal Heat Rate (ISO): N/A Btu/kWh-HHV

      Capital Cost Category                                                          (000s) (October 1, 2010$)

      Civil Structural Material and Installation                                                 65,000

      Mechanical Equipment Supply and
      Installation                                                                              391,583

      Electrical / I&C Supply and Installation                                                   64,350

      Project Indirects (1)                                                                      52,762

      EPC Cost before Contingency and Fee                                                       573,695

      Fee and Contingency                                                                        68,843

      Total Project EPC                                                                         642,538

      Owner Costs (excluding project finance)                                                    70,679

      Total Project Cost (excluding finance)                                                    713,217

      Total Project EPC                                                / kW                       4,283

      Owner Costs 12% (excluding project finance)                      / kW                        471

      Total Project Cost (excluding project finance)                   / kW                       4,755

      (1) Includes engineering, distributable costs, scaffolding, construction management, and start-up.


For this type of technology and power plant configuration, our regional adjustments took into
consideration the following: seismic design differences, remote location issues, labor wage and
productivity differences, location adjustments, owner cost differences, and the increase in
overheads associated with these five location adjustments.
Seismic design differences among the various locations were based on U.S. seismic map
information that detailed the various seismic zones throughout the U.S. No cost increases were
associated with seismic Zone 0 and cost step increases were considered for Zones 1, 2, 3 and 4.
Remote location issues are related to geographic areas that typically require installation of man
camps, higher craft incentives, and higher per diems are generally required with respect to
construction, due to the fact that such areas are long distances from urban areas, where labor is
generally abundant. Remote location designations were also considered in locations where
higher equipment freight costs are typically incurred, which for example are regions not near
established rail or highway access. Remote locations related to the Photovoltaic Facility include


                                                           24-4
Fairbanks, Alaska; Honolulu, Hawaii; Albuquerque, New Mexico; Cheyenne, Wyoming; and
Cayey, Puerto Rico.
Labor wage and productivity differences were handled as discussed in Section 2.5.1, taking into
consideration the amount of labor we estimated for the PV Facility.
Location adjustments were made to locations where higher cost of living levels are incurred
and/or where population density generally correlates to higher construction costs for power and
other infrastructure projects. These locations include Alaska, California, Connecticut, Delaware,
District of Columbia, Hawaii, Illinois, Maine, Maryland, Massachusetts, Michigan, Minnesota,
New York, Ohio, and Wisconsin.
Owner costs were reviewed based on the need for utility upgrades and/or infrastructure costs
such as new facility transmission lines to tie to existing utility transmission substations or
existing transmission lines.
Table 24-3 and Table 24-4 present the PV Facility capital cost variations for alternative U.S.
plant locations.


                                              24-5
TABLE 24-3 – LOCATION-BASED COSTS FOR PV (7 MW)
                                      (OCTOBER 1, 2010 DOLLARS)
                                           Base
                                          Project    Location      Delta Cost   Total Location
                                           Cost      Percent       Difference    Project Cost
           State               City       ($/kW)     Variation       ($/kW)         ($/kW)
Alaska                 Anchorage           6,050       16.8%         1,016          7,066
Alaska                 Fairbanks           6,050       25.6%         1,548          7,598
Alabama                Huntsville          6,050           -7.3%      (441)         5,609
Arizona                Phoenix             6,050           -5.7%      (344)         5,706
Arkansas               Little Rock         6,050           -5.9%      (359)         5,691
California             Los Angeles         6,050        8.1%          490           6,540
California             Redding             6,050        4.6%          277           6,327
California             Bakersfield         6,050        5.0%          301           6,351
California             Sacramento          6,050        9.1%          549           6,599
California             San Francisco       6,050       18.1%         1,096          7,146
Colorado               Denver              6,050           -4.3%      (263)         5,787
Connecticut            Hartford            6,050           6.2%       376           6,426
Delaware               Dover               6,050           3.3%       198           6,248
District of Columbia   Washington          6,050           1.6%        96           6,146
Florida                Tallahassee         6,050       -10.0%         (605)         5,445
Florida                Tampa               6,050        -4.1%         (250)         5,800
Georgia                Atlanta             6,050           -7.9%      (480)         5,570
Hawaii                 Honolulu            6,050       29.9%         1,812          7,862
Idaho                  Boise               6,050           -2.7%      (162)         5,888
Illinois               Chicago             6,050       17.8%         1,075          7,125
Indiana                Indianapolis        6,050           -1.2%      (70)          5,980
Iowa                   Davenport           6,050            0.6%        38          6,088
Iowa                   Waterloo            6,050           -6.6%      (399)         5,651
Kansas                 Wichita             6,050           -5.0%      (303)         5,747
Kentucky               Louisville          6,050           -6.0%      (364)         5,686
Louisiana              New Orleans         6,050       -10.3%         (622)         5,428
Maine                  Portland            6,050           -3.4%      (203)         5,847
Maryland               Baltimore           6,050           -2.6%      (158)         5,892
Massachusetts          Boston              6,050       14.6%          885           6,935
Michigan               Detroit             6,050            3.1%       188          6,238
Michigan               Grand Rapids        6,050           -7.6%      (461)         5,589
Minnesota              St. Paul            6,050           5.1%       308           6,358
Mississippi            Jackson             6,050           -7.2%      (438)         5,612
Missouri               St. Louis           6,050           3.9%       233           6,283
Missouri               Kansas City         6,050           2.0%       123           6,173
Montana                Great Falls         6,050           -2.9%      (178)         5,872
Nebraska               Omaha               6,050           -1.9%      (114)         5,936
New Hampshire          Concord             6,050           -0.7%      (42)          6,008
New Jersey             Newark              6,050       14.4%          869           6,919
New Mexico             Albuquerque         6,050           -2.5%      (154)         5,896


                                                    24-6
Base
                                  Project    Location      Delta Cost   Total Location
                                   Cost      Percent       Difference    Project Cost
         State        City        ($/kW)     Variation       ($/kW)         ($/kW)
New York         New York          6,050       32.9%         1,988          8,038
New York         Syracuse          6,050       -1.4%          (86)          5,964
Nevada           Las Vegas         6,050           7.9%       476           6,526
North Carolina   Charlotte         6,050       -10.6%         (640)         5,410
North Dakota     Bismarck          6,050           -5.3%      (318)         5,732
Ohio             Cincinnati        6,050           -4.2%      (256)         5,794
Oregon           Portland          6,050           4.3%       260           6,310
Pennsylvania     Philadelphia      6,050       10.5%           634          6,684
Pennsylvania     Wilkes-Barre      6,050       -4.6%          (281)         5,769
Rhode Island     Providence        6,050           2.7%       166           6,216
South Carolina   Spartanburg       6,050       -12.1%         (731)         5,319
South Dakota     Rapid City        6,050           -7.9%      (477)         5,573
Tennessee        Knoxville         6,050           -9.3%      (562)         5,488
Texas            Houston           6,050           -9.2%      (557)         5,493
Utah             Salt Lake City    6,050           -4.0%      (240)         5,810
Vermont          Burlington        6,050           -4.2%      (256)         5,794
Virginia         Alexandria        6,050           -3.1%      (185)         5,865
Virginia         Lynchburg         6,050           -6.5%      (391)         5,659
Washington       Seattle           6,050            5.3%      322           6,372
Washington       Spokane           6,050           -1.3%      (81)          5,969
West Virginia    Charleston        6,050           -2.0%      (124)         5,926
Wisconsin        Green Bay         6,050           -3.1%      (190)         5,860
Wyoming          Cheyenne          6,050           -4.0%      (240)         5,810
Puerto Rico      Cayey             6,050           -1.9%      (117)         5,933


                                            24-7
TABLE 24-4 – LOCATION-BASED COSTS FOR PV (150 MW)
                                       (OCTOBER 1, 2010 DOLLARS)
                                            Base
                                           Project    Location     Delta Cost   Total Location
                                            Cost      Percent      Difference    Project Cost
           State                City       ($/kW)     Variation      ($/kW)         ($/kW)
Alaska                  Anchorage           4,755       19.9%         947           5,702
Alaska                  Fairbanks           4,755       30.9%        1,470          6,225
Alabama                 Huntsville          4,755        -8.0%        (379)         4,376
Arizona                 Phoenix             4,755        -6.2%        (294)         4,461
Arkansas                Little Rock         4,755        -6.5%        (307)         4,448
California              Los Angeles         4,755        9.6%         458           5,213
California              Redding             4,755        5.5%         263           5,018
California              Bakersfield         4,755        6.1%         291           5,046
California              Sacramento          4,755       10.5%         498           5,253
California              San Francisco       4,755       20.7%         985           5,740
Colorado                Denver              4,755        -4.4%        (208)         4,547
Connecticut             Hartford            4,755           7.1%      339           5,094
Delaware                Dover               4,755           3.8%      183           4,938
District of Columbia    Washington          4,755           2.3%      111           4,866
Florida                 Tallahassee         4,755       -11.0%        (522)         4,233
Florida                 Tampa               4,755        -4.5%        (216)         4,539
Georgia                 Atlanta             4,755        -8.7%        (413)         4,342
Hawaii                  Honolulu            4,755       37.2%        1,771          6,526
Idaho                   Boise               4,755        -2.5%        (119)         4,636
Illinois                Chicago             4,755       19.9%         949           5,704
Indiana                 Indianapolis        4,755        -1.2%        (57)          4,698
Iowa                    Davenport           4,755         1.1%          51          4,806
Iowa                    Waterloo            4,755        -6.9%        (327)         4,428
Kansas                  Wichita             4,755        -5.1%        (242)         4,513
Kentucky                Louisville          4,755        -6.6%        (313)         4,442
Louisiana               New Orleans         4,755       -11.3%        (537)         4,218
Maine                   Portland            4,755        -3.2%        (152)         4,603
Maryland                Baltimore           4,755        -2.6%        (124)         4,631
Massachusetts           Boston              4,755       16.4%         778           5,533
Michigan                Detroit             4,755         3.4%         163          4,918
Michigan                Grand Rapids        4,755        -8.4%        (398)         4,357
Minnesota               St. Paul            4,755           6.0%      286           5,041
Mississippi             Jackson             4,755        -7.9%        (377)         4,378
Missouri                St. Louis           4,755           4.4%      208           4,963
Missouri                Kansas City         4,755           2.3%      109           4,864
Montana                 Great Falls         4,755        -2.7%        (130)         4,625
Nebraska                Omaha               4,755        -1.7%        (79)          4,676
New Hampshire           Concord             4,755        -0.3%        (15)          4,740
New Jersey              Newark              4,755       15.8%         751           5,506
New Mexico              Albuquerque         4,755        -2.3%        (111)         4,644


                                                     24-8
Base
                                         Project    Location        Delta Cost    Total Location
                                          Cost      Percent         Difference     Project Cost
           State             City        ($/kW)     Variation         ($/kW)          ($/kW)
  New York              New York          4,755       36.6%           1,739           6,494
  New York              Syracuse          4,755       -1.4%            (68)           4,687
  Nevada                Las Vegas         4,755           9.1%         432            5,187
  North Carolina        Charlotte         4,755       -11.6%           (549)          4,206
  North Dakota          Bismarck          4,755        -5.3%           (254)          4,501
  Ohio                  Cincinnati        4,755        -4.6%           (220)          4,535
  Oregon                Portland          4,755           5.2%         249            5,004
  Pennsylvania          Philadelphia      4,755       11.6%             550           5,305
  Pennsylvania          Wilkes-Barre      4,755       -5.0%            (240)          4,515
  Rhode Island          Providence        4,755           3.1%         146            4,901
  South Carolina        Spartanburg       4,755       -13.2%           (628)          4,127
  South Dakota          Rapid City        4,755        -8.2%           (392)          4,363
  Tennessee             Knoxville         4,755       -10.2%           (483)          4,272
  Texas                 Houston           4,755       -10.1%           (481)          4,274
  Utah                  Salt Lake City    4,755        -3.8%           (183)          4,572
  Vermont               Burlington        4,755        -4.2%           (201)          4,554
  Virginia              Alexandria        4,755        -3.3%           (159)          4,596
  Virginia              Lynchburg         4,755        -7.1%           (336)          4,419
  Washington            Seattle           4,755         6.0%           284            5,039
  Washington            Spokane           4,755        -1.0%           (49)           4,706
  West Virginia         Charleston        4,755        -2.2%           (103)          4,652
  Wisconsin             Green Bay         4,755        -3.4%           (161)          4,594
  Wyoming               Cheyenne          4,755        -3.8%           (180)          4,575
  Puerto Rico           Cayey             4,755        -1.4%           (68)           4,687

24.5 O&M ESTIMATE
The significant O&M items for a PV Facility include periodic inverter maintenance and periodic
panel water washing. Additionally, most thermal solar operators do not treat O&M on a variable
basis, and consequently, all O&M expenses are shown below on a fixed basis. Table 24-5 and
Table 24-6 present the O&M expenses for the PV Facility.
                   TABLE 24-5 – O&M EXPENSES FOR PV FACILITY (7 MW)
                          Technology:                                  PV
                      Fixed O&M Expense                          $26.40/kW-year
                     Variable O&M Expense                           $0/MWh
                   TABLE 24-6 – O&M EXPENSES FOR PV FACILITY (150 MW)
                          Technology:                                  PV
                      Fixed O&M Expense                          $16.70/kW-year
                     Variable O&M Expense                           $0/MWh


                                                   24-9
24.6 ENVIRONMENTAL COMPLIANCE INFORMATION
Table 24-7 presents environmental emissions for the PV Facility.
                TABLE 24-7 – ENVIRONMENTAL EMISSIONS FOR PV
                      Technology:                   Photovoltaic
                         NOX                         0 lb/MMBtu
                          SO2                        0 lb/MMBtu
                          CO2                        0 lb/MMBtu


                                            24-10

Updated plant costs 2010

  • 1.
    Updated Capital CostEstimates for Electricity Generation Plants November 2010 U. S. Energy Information Administration Office of Energy Analysis U.S. Department of Energy Washington, DC 20585 This report was prepared by the U.S. Energy Information Administration (EIA), the statistical and analytical agency within the U.S. Department of Energy. By law, EIA’s data, analyses, and forecasts are independent of approval by any other officer or employee of the United States Government. The views in this report therefore should not be construed as representing those of the Department of Energy or other Federal agencies.
  • 2.
    The current andfuture projected cost of new electricity generation capacity is a critical input into the development of energy projections and analyses. The cost of new generating plants plays an important role in determining the mix of capacity additions that will serve growing loads in the future. New plant costs also help to determine how new capacity competes against existing capacity, and the response of the electricity generators to the imposition of environmental controls on conventional pollutants or any limitations on greenhouse gas emissions. The current and projected future costs of energy-related capital projects, including but not limited to new electric generating plants, have been subject to considerable change in recent years. EIA updates its cost and performance assumptions annually, as part of the development cycle for the Annual Energy Outlook (AEO). For the AEO2011 cycle, EIA commissioned an external consultant to develop current cost estimates for utility-scale electric generating plants.1 This paper briefly summarizes the design of the project and provides a summary of its main findings, including a comparison of the new estimates to those used in AEO2010. The final section discusses how EIA uses information on cost and other factors in modeling technology choice in the electric power sector. Developing Updated Estimates: Key Design Considerations In order to maximize its value to EIA and external energy analysts, the project focused on gathering current information regarding the “overnight”2 cost for a wide range of generation technologies, while taking care to use a common boundary in the costing exercise across those technologies. The cost estimates for each technology were developed for a generic facility of a specific size and configuration, and assuming a location without unusual constraints or infrastructure needs. Current information is particularly important during a period when actual and estimated costs have been evolving rapidly, since the use of up-to-date cost estimates for some technologies in conjunction with estimates that are two, three, or even five years old for others can significantly skew the results of modeling and analysis. Where possible, costs estimates were based on information regarding actual or planned projects available to the consultant. When this information was not available, project costs were estimated by using costing models that account for current labor and material rates that would be necessary to complete the construction of a generic facility. The use of a common boundary for costing is also very important. From experience in reviewing many costing studies for individual technologies, EIA is well aware that differences in practices regarding the inclusion or exclusion of various components of costs can have a large impact on overall cost estimates. This includes the categories of civil and structural costs (e.g., allowance 1 EIA’s electricity modeling includes both combined heat and power (CHP) technologies as well as a variety of distributed generation technologies, but those technologies were not addressed in the study, which focused on technologies within the electric power sector. 2 “Overnight cost” is an estimate of the cost at which a plant could be constructed assuming that the entire process from planning through completion could be accomplished in a single day. This concept is useful to avoid any impact of financing issues and assumptions on estimated costs. Starting from overnight cost estimates, EIA’s electricity modeling explicitly takes account of the time required to bring each generation technology online and the costs of financing construction in the period before a plant becomes operational. 2
  • 3.
    for site preparation,drainage, underground utilities, and buildings), project indirect costs (e.g., a construction contingency), and owners costs (e.g., development costs, preliminary feasibility and engineering studies, environmental studies and permitting, legal fees, insurance costs, property taxes during construction, and the electrical interconnection costs, including a plant switchyard and tie-in to nearby transmission). Summary of updated overnight capital costs estimates and comparison to information used in AEO2010 Table 1 summarizes the updated cost estimates for the generic utility-scale generation plants represented in EIA’s model, including 7 powered by coal, 6 by natural gas, 3 by solar energy, 2 each by wind, hydro, biomass, and geothermal power, and 1 each by uranium and municipal solid waste. For some plant types there are several options shown to better represent the range of plants that might be built and their costs. For example, both single unit and dual unit advanced pulverized coal plants are shown, because many plants include multiple units and the costs associated with the dual unit configuration might better reflect the costs of most plants built. Similarly, solar photovoltaic technologies include a relatively small 7 MW system and a much larger 150 MW system, because there is such variance in the sizes of the facilities being considered. The nominal capacity of the generic plants ranges from a 7 megawatt (MW) solar plant to a 2,236 MW advanced dual-unit nuclear plant, reflecting the significant variation in the scale of utility applications. Each technology is characterized by its overnight capital costs, heat rate (where applicable), non-fuel operations and maintenance costs, and, though not shown in Table 1, its environmental characteristics. Table 2 compares the updated overnight cost estimates to those used as inputs to the AEO2010. To facilitate comparisons, both are shown in real year 2010 dollars. Notable changes between the updated estimates and the AEO2010 values include:  Coal & Nuclear: The updated overnight capital cost estimates for coal and nuclear power plants are 25 to 37 percent above those in AEO2010. The higher cost estimates reflect many factors including the overall trend of rising costs of capital intensive technology in the power sector, higher global commodity prices, and the fact that there are relatively few construction firms with the ability to complete complex engineering projects such as a new nuclear or advanced coal power plant. The study assumes cost- sharing agreements between the project owner and the project construction contractors are reflective of those recently observed in the marketplace. As shown in Table 1, dual unit coal and nuclear plants generally have lower overnight costs per kilowatt than single- unit plants, reflecting their ability to take advantage of redundancies and scale economies in onsite infrastructure such as wastewater management and environmental controls to reduce the estimated total per-kilowatt cost of the project.  Natural Gas: The updated cost estimates for natural gas combined cycle and combustion turbines generally remained similar to those of AEO2010.  Solar: The overnight capital costs for solar thermal and photovoltaic technologies dropped by 10 percent and 25 percent, respectively. The decrease in the cost of photovoltaics was due to the assumption of larger plant capacity and falling component costs. 3
  • 4.
    Onshore Wind: Overnight costs for onshore wind increased by about 21 percent relative to AEO 2010 assumptions. This is based on a specification for a new, stand-alone wind plant including all owners’ costs and may differ from other reported costs in the literature, which are not fully characterized and may include sites that are built along side existing plants (and are thus able to avoid some amount of infrastructure costs).  Offshore Wind: While offshore wind plants have been built in Europe, there have only been proposals in the United States, with final permitting only recently issued on the first of these proposals. The updated costs, some 50 percent higher than AEO 2010 estimates, are consistent with substantial first-of-a-kind costs that would likely be encountered when building projects in the United States, which largely lacks the unique infrastructure, needed to support this type of construction.  Geothermal: Geothermal costs are highly site-specific, and are represented as such in the AEO estimates. The updated cost estimate is over 50 percent higher than the same site in AEO 2010.  Biomass: Biomass capital costs are largely unchanged from AEO2010. However, the technology represented by the costs has changed significantly. Prior estimates were for a highly efficient plant employing gasification and a combined cycle generator; the new estimate is for a significantly less efficient direct combustion boiler. The lower operating efficiency (and therefore higher operating cost) for the biomass plant considered in the updated cost estimate implies a reduced attractiveness of investment in new biomass generation at an overnight cost similar to that for the more efficient biomass plant characterized in AEO2010. While estimates of the current cost of generic electric generation capacity of various types are one key input to EIA’s analysis of electricity markets, the evolution of the electricity mix in each of the 22 regions to be modeled in AEO20113 is also sensitive to many other factors, including the projected evolution of capital costs over the modeling horizon, projected fuel costs, whether wholesale power markets are regulated or competitive, the existing generation mix, additional costs associated with environmental control requirements, load growth, and the load shape. Almost all of these factors can vary by region, as do capacity factors for renewable generation, operations and maintenance costs associated with individual plants, and cost multipliers applied to the generic estimates of overnight capital costs outlined in Tables 1 and 2. The next section provides a brief overview of some of the relevant issues, which are described in more detail in the description of the Electric Market Module included in the 2010 edition of the documentation for EIA’s National Energy Modeling System. EIA’s Analysis of Technology Choice in the Electric Power Sector Estimates of the overnight capital cost of generic generating technologies are only the starting point for consideration of the cost of new generating capacity in EIA modeling analyses. EIA also considers regional variation in construction costs, the structure of wholesale power markets that affect financing costs, the length of time required to bring each type of plant into service, and the capacity availability factors for solar and wind generation plants. EIA also accounts for 3 In AEO2010 and prior editions, the continental U.S., excluding Alaska, was divided in 13 regions for purposes of electricity modeling. The 22 region model that will be used starting with AEO2011 will allow for better representation of policy boundaries and market structure at the State level. 4
  • 5.
    three distinct dynamicforces that drive changes in plant cost over time. One is the projected relationship between rate of inflation for key drivers of plant costs, such as materials and construction costs, and the overall economy-wide rate of inflation. A projected economy–wide inflation rate that exceeds projected inflation for key plant cost drivers results in a projected decline in real (inflation-adjusted) capital costs. Projected capital costs also reflect projected technology progress over time. Learning-by-doing, which allows for additional reductions in projected capital costs as a function of cumulative additions new technologies, has a further effect on technology costs. See the AEO2010 assumptions and model documentation for more details.4 Levelized cost is often cited as a convenient summary measure of the overall competiveness of different generating technologies. Levelized cost represents the present value of the total cost of building and operating a generating plant over an assumed economic life, converted to equal annual payments and expressed in terms of real dollars to remove the impact of inflation. Levelized costs, which reflect overnight capital cost, fuel cost, fixed and variable O&M cost, are a useful indicator of the competitiveness of different generation technologies. For technologies such as solar and wind generation that have no fuel costs and relatively small O&M costs, levelized cost changes in rough proportion to the estimated overnight capital cost of generation capacity. For technologies with significant fuel cost, both fuel cost and overnight cost estimates significantly affect levelized cost. Thus, while Table 2 shows little change between the updated capital cost estimates for natural gas combined cycle plants and those used in AEO2010, improved supply prospects for natural gas that will be incorporated in AEO2011 result in lower projected prices that in turn lower the levelized cost of gas-fired generation and improve the attractiveness of operating and adding gas-fired generation technologies. It is important to note, however, that actual investment decisions are affected by numerous factors other than levelized costs. The projected utilization rate, which depends on the load shape and the existing resource mix in an area where additional capacity is needed, is one such factor. The existing resource mix in a region can directly affect the economic viability of a new investment through its effect on the economics surrounding the displacement of existing resources. For example, a wind resource that would primarily back out existing natural gas generation will generally have a higher value than one that would back out existing coal generation under fuel price conditions where the variable cost of operating existing gas-fired plants exceeds that of operating existing coal-fired plants. A related factor is the capacity value, which depends on both the existing capacity mix and load characteristics in a region. Since load must be balanced on a continuous basis, units whose output can be varied to follow demand generally have more value to a system than less flexible units or those whose operation is tied to the availability of an intermittent resource. Policy- related factors, such as investment or production tax credits for specified generation sources, can also impact investment decisions. Finally, although levelized cost calculations are generally made using an assumed set of capital and operating costs, the inherent uncertainty about future fuel prices and future policies, may cause plant owners or investors who finance plants to place a 4 Assumptions and model documentation for the 2010 Annual Energy Outlook are available at http://www.eia.doe.gov/oiaf/aeo/index.html. 5
  • 6.
    value on portfoliodiversification. EIA considers all of these factors in its analyses of technology choice in the electricity sector. In sum, while overnight cost estimates are important inputs for EIA modelers and other analysts, they are not the sole driver of the choice among electric generation technologies. Users interested in additional details regarding these updated cost estimates should review the consultant study prepared by R.W. Beck for EIA in Appendix A. 6
  • 7.
    Table 1. UpdatedEstimates of Power Plant Capital and Operating Costs Plant Characteristics Plant Costs Variable Overnight O&M Nominal Capital Fixed O&M Cost Capacity Heat Rate Cost (2010 Cost (2010 (kilowatts) (Btu/kWh) $/kW) (2010$/kW) $/MWh) Coal Single Unit Advanced PC 650,000 8,800 $3,167 $35.97 $4.25 Dual Unit Advanced PC 1,300,000 8,800 $2,844 $29.67 $4.25 Single Unit Advanced PC with CCS 650,000 12,000 $5,099 $76.62 $9.05 Dual Unit Advanced PC with CCS 1,300,000 12,000 $4,579 $63.21 $9.05 Single Unit IGCC 600,000 8,700 $3,565 $59.23 $6.87 Dual Unit IGCC 1,200,000 8,700 $3,221 $48.90 $6.87 Single Unit IGCC with CCS 520,000 10,700 $5,348 $69.30 $8.04 Natural Gas Conventional NGCC 540,000 7,050 $978 $14.39 $3.43 Advanced NGCC 400,000 6,430 $1,003 $14.62 $3.11 Advanced NGCC with CCS 340,000 7,525 $2,060 $30.25 $6.45 Conventional CT 85,000 10,850 $974 $6.98 $14.70 Advanced CT 210,000 9,750 $665 $6.70 $9.87 Fuel Cells 10,000 9,500 $6,835 $350 $0.00 Uranium Dual Unit Nuclear 2,236,000 N/A $5,335 $88.75 $2.04 Biomass Biomass CC 20,000 12,350 $7,894 $338.79 $16.64 Biomass BFB 50,000 13,500 $3,860 $100.50 $5.00 Wind Onshore Wind 100,000 N/A $2,438 $28.07 $0.00 Offshore Wind 400,000 N/A $5,975 $53.33 $0.00 Solar Solar Thermal 100,000 N/A $4,692 $64.00 $0.00 Small Photovoltaic 7,000 N/A $6,050 $26.04 $0.00 Large Photovoltaic 150,000 N/A $4,755 $16.7 $0.00 Geothermal Geothermal – Dual Flash 50,000 N/A $5,578 $84.27 $9.64 Geothermal – Binary 50,000 NA $4,141 $84.27 $9.64 MSW MSW 50,000 18,000 $8,232 $373.76 $8.33 Hydro Hydro-electric 500,000 N/A $3,076 $13.44 $0.00 Pumped Storage 250,000 N/A $5,595 $13.03 $0.00 7
  • 8.
    Table 2. Comparisonof Updated Plant Costs to AEO2010 Plant Costs Table II Overnight Capital Cost ($/kW) Nominal Capacity KW's1 AEO AEO % AEO AEO 2010 2011 2010 Change 2011 Coal Advanced PC w/o CCS $2,844 $2,271 25% 1,300,000 600,000 IGCC w/o CCS $3,221 $2,624 23% 1,200,000 550,000 IGCC CCS $5,348 $3,857 39% 600,000 380,000 Natural Gas Conventional NGCC $978 $1,005 -3% 540,000 250,000 Advanced NGCC $1,003 $989 1% 400,000 400,000 Advanced NGCC with $2,060 $1,973 4% 340,000 400,000 CCS Conventional CT $974 $700 39% 85,000 160,000 Advanced CT $665 $662 0% 210,000 230,000 Fuel Cells $6,835 $5,595 22% 10,000 10,000 Nuclear Nuclear $5,339 $3,902 37% 2,236,000 1,350,000 Renewables Biomass $3,860 $3,931 -2% 50,000 80,000 Geothermal $4,141 $1,786 132% 50,000 50,000 MSW - Landfill Gas $8,232 $2,655 210% 50,000 30,000 Conventional $3,078 $2,340 53% 500,000 500,000 Hydropower Wind $2,438 $2,007 21% 100,000 50,000 Wind Offshore $5,975 $4,021 49% 400,000 100,000 Solar Thermal $4,692 $5,242 -10% 100,000 100,000 Photovoltaic $4,755 $6,303 -25% 150,000 5,000 1 Higher plant capacity reflects the assumption that plants would install multiple units per site and that savings could could be gained by eliminating redundancies and combining services. 8
  • 9.
  • 10.
    EOP III TASK1606, SUBTASK 3 – REVIEW OF POWER PLANT COST AND PERFORMANCE ASSUMPTIONS FOR NEMS Technology Documentation Report R. W. Beck, Inc. Science Applications International Corporation (SAIC) Prepared by: Vincent Hahn, R. W. Beck John Fix, R. W. Beck John Schmalz, R. W. Beck Michael Wennen, R. W. Beck Evis Couppis, Ph.D., R. W. Beck Prepared in Coordination with: Jay Ratafia-Brown, SAIC Prepared For: Energy Information Administration Office of Integrated Analysis and Forecasting Alan Beamon Michael Leff October 2010
  • 11.
    Disclaimer Certain statements includedin this report constitute forward-looking statements. The achievement of certain results or other expectations contained in such forward-looking statements involve known and unknown risks, uncertainties and other factors which may cause actual results, performance or achievements described in the report to be materially different from any future results, performance or achievements expressed or implied by such forward-looking statements. We do not plan to issue any updates or revisions to the forward-looking statements if or when our expectations or events, conditions, or circumstances on which such statements are based occur.
  • 12.
    TABLE OF CONTENTS 1.  Introduction ................................................................................................................. 1-1  1.1  Technologies Assessed .......................................................................................... 1-1  2.  General Basis for Technology Evaluation Basis ...................................................... 2-1  2.1  R. W. Beck Background ........................................................................................ 2-1  2.2  Base Fuel Characteristics ...................................................................................... 2-1  2.3  Environmental Compliance Basis ......................................................................... 2-4  2.4  Local Capacity Adjustments ................................................................................. 2-4  2.5  Technology Specifications .................................................................................... 2-6  2.6  Cost Estimation Methodology ............................................................................... 2-6  2.6.1  Capital Cost ............................................................................................................ 2-6  2.6.1.1  Costing Scope .................................................................................................. 2-6  2.6.2  Operation and Maintenance (O&M) Expenses ...................................................... 2-7  2.6.2.1  Fixed O&M (FOM).......................................................................................... 2-8  2.6.2.2  Variable O&M (VOM) .................................................................................... 2-8  2.6.2.3  Major Maintenance .......................................................................................... 2-8  3.  Advanced Pulverized Coal (APC) ............................................................................. 3-1  3.1  Mechanical Equipment and Systems ..................................................................... 3-1  3.2  Electrical and Control Systems ............................................................................. 3-2  3.3  Off-Site Requirements ........................................................................................... 3-2  3.4  Capital Cost Estimate ............................................................................................ 3-3  3.5  O&M Estimate ...................................................................................................... 3-8  3.6  Environmental Compliance Information ............................................................... 3-8  4.  Advanced Pulverized Coal With CCS (APC/CCS).................................................. 4-1  4.1  Mechanical Equipment and Systems ..................................................................... 4-1  4.2  Electrical and Control Systems ............................................................................. 4-2  4.3  Off-Site Requirements ........................................................................................... 4-2  4.4  Capital Cost Estimate ............................................................................................ 4-2  4.5  O&M Estimate ...................................................................................................... 4-7  4.6  Environmental Compliance Information ............................................................... 4-8  i
  • 13.
    5.  Conventional Natural Gas Combined Cycle (NGCC) ............................................. 5-1  5.1  Mechanical Equipment and Systems ..................................................................... 5-1  5.2  Electrical and Control Systems ............................................................................. 5-2  5.3  Off-Site Requirements ........................................................................................... 5-2  5.4  Capital Cost Estimate ............................................................................................ 5-3  5.5  O&M Estimate ...................................................................................................... 5-6  5.6  Environmental Compliance Information ............................................................... 5-7  6.  Advanced Generation Natural Gas Combined Cycle (AG-NGCC) ....................... 6-1  6.1  Mechanical Equipment and Systems ..................................................................... 6-1  6.2  Electrical and Control Systems ............................................................................. 6-1  6.3  Off-Site Requirements ........................................................................................... 6-1  6.4  Capital Cost Estimate ............................................................................................ 6-1  6.5  O&M Estimate ...................................................................................................... 6-4  6.6  Environmental Compliance Information ............................................................... 6-4  7.  Advanced Generation Natural Gas Combined Cycle With CCS (AG-NGCC/CCS)........................................................................................................ 7-1  7.1  Mechanical Equipment and Systems ..................................................................... 7-1  7.2  Electrical and Control Systems ............................................................................. 7-1  7.3  Off-Site Requirements ........................................................................................... 7-1  7.4  Capital Cost Estimate ............................................................................................ 7-1  7.5  O&M Estimate ...................................................................................................... 7-4  7.6  Environmental Compliance Information ............................................................... 7-4  8.  Conventional Combustion Turbine (CT).................................................................. 8-1  8.1  Mechanical Equipment and Systems ..................................................................... 8-1  8.2  Electrical and Control Systems ............................................................................. 8-1  8.3  Off-Site Requirements ........................................................................................... 8-1  8.4  Capital Cost Estimate ............................................................................................ 8-2  8.5  O&M Estimate ...................................................................................................... 8-5  8.6  Environmental Compliance Information ............................................................... 8-6  9.  Advanced Combustion Turbine (ACT) .................................................................... 9-1  9.1  Mechanical Equipment and Systems ..................................................................... 9-1  9.2  Electrical and Control Systems ............................................................................. 9-1  ii
  • 14.
    9.3  Off-Site Requirements ........................................................................................... 9-1  9.4  Capital Cost Estimate ............................................................................................ 9-1  9.5  O&M Estimate ...................................................................................................... 9-4  9.6  Environmental Compliance Information ............................................................... 9-4  10.  Integrated Gasification Combined Cycle (IGCC) ................................................. 10-1  10.1  Mechanical Equipment and Systems ................................................................... 10-1  10.2  Electrical and Control Systems ........................................................................... 10-3  10.3  Off-Site Requirements ......................................................................................... 10-3  10.4  Capital Cost Estimate .......................................................................................... 10-4  10.5  O&M Estimate .................................................................................................. 10-10  10.6  Environmental Compliance Information ........................................................... 10-11  11.  Integrated Gasification Combined Cycle With CCS (IGCC/CCS) ...................... 11-1  11.1  Mechanical Equipment and Systems ................................................................... 11-1  11.2  Electrical and Control Systems ........................................................................... 11-1  11.3  Off-Site Requirements ......................................................................................... 11-1  11.4  Capital Cost Estimate .......................................................................................... 11-1  11.5  O&M Estimate .................................................................................................... 11-4  11.6  Environmental Compliance Information ............................................................. 11-4  12.  Advanced Nuclear (AN) ........................................................................................... 12-1  12.1  Mechanical Equipment and Systems ................................................................... 12-1  12.2  Electrical and Control Systems ........................................................................... 12-2  12.3  Off-Site Requirements ......................................................................................... 12-3  12.4  Capital Cost Estimate .......................................................................................... 12-3  12.5  O&M Estimate .................................................................................................... 12-7  12.6  Environmental Compliance Information ............................................................. 12-7  13.  Biomass Combined Cycle (BCC) ............................................................................. 13-1  13.1  Mechanical Equipment and Systems ................................................................... 13-1  13.2  Electrical and Control Systems ........................................................................... 13-2  13.3  Off-Site Requirements ......................................................................................... 13-3  iii
  • 15.
    13.4  Capital Cost Estimate .......................................................................................... 13-3  13.5  O&M Estimate .................................................................................................... 13-7  13.6  Environmental Compliance Information ............................................................. 13-8  14.  Biomass Bubbling Fluized Bed (BBFB) .................................................................. 14-1  14.1  Mechanical Equipment and Systems ................................................................... 14-1  14.2  Electrical and Control Systems ........................................................................... 14-2  14.3  Off-Site Requirements ......................................................................................... 14-2  14.4  Capital Cost Estimate .......................................................................................... 14-2  14.5  O&M Estimate .................................................................................................... 14-6  14.6  Environmental Compliance Information ............................................................. 14-7  15.  Fuel Cell (FC) Mechanical Equipment and Systems ............................................. 15-1  15.1  Electrical and Control Systems ........................................................................... 15-1  15.2  Off-Site Requirements ......................................................................................... 15-1  15.3  Capital Cost Estimate .......................................................................................... 15-2  15.4  O&M Estimate .................................................................................................... 15-5  15.5  Environmental Compliance Information ............................................................. 15-6  16.  Geothermal Dual Flash (GT) ................................................................................... 16-1  16.1  Mechanical Equipment and Systems ................................................................... 16-1  16.2  Electrical and Control Systems ........................................................................... 16-2  16.3  Off-Site Requirements ......................................................................................... 16-2  16.4  Capital Cost Estimate .......................................................................................... 16-3  16.5  O&M Estimate .................................................................................................... 16-6  16.6  Environmental Compliance Information ............................................................. 16-6  17.  Geothermal Binary (Binary) .................................................................................... 17-1  17.1  Mechanical Equipment and Systems ................................................................... 17-1  17.2  Electrical and Control Systems ........................................................................... 17-1  17.3  Off-Site Requirements ......................................................................................... 17-2  17.4  Capital Cost Estimate .......................................................................................... 17-2  17.5  O&M Estimate .................................................................................................... 17-5  17.6  Environmental Compliance Information ............................................................. 17-6  iv
  • 16.
    18.  Municipal Solid Waste (MSW) ................................................................................ 18-1  18.1  Mechanical Equipment and Systems ................................................................... 18-1  18.2  Electrical and Control Systems ........................................................................... 18-2  18.3  Off-Site Requirements ......................................................................................... 18-2  18.4  Capital Cost Estimate .......................................................................................... 18-2  18.5  O&M Estimate .................................................................................................... 18-5  18.6  Environmental Compliance Information ............................................................. 18-6  19.  Hydroelectric (HY) ................................................................................................... 19-1  19.1  Mechanical Equipment and Systems ................................................................... 19-1  19.2  Electrical and Control Systems ........................................................................... 19-1  19.3  Off-Site Requirements ......................................................................................... 19-1  19.4  Capital Cost Estimate .......................................................................................... 19-2  19.5  O&M Estimate .................................................................................................... 19-5  19.6  Environmental Compliance Information ............................................................. 19-5  20.  Pumped Storage (PS) ................................................................................................ 20-1  20.1  Mechanical Equipment and Systems ................................................................... 20-1  20.2  Electrical and Control Systems ........................................................................... 20-1  20.3  Off-Site Requirements ......................................................................................... 20-1  20.4  Capital Cost Estimate .......................................................................................... 20-2  20.5  O&M Estimate .................................................................................................... 20-5  20.6  Environmental Compliance Information ............................................................. 20-5  21.  Onshore Wind (WN) ................................................................................................. 21-1  21.1  Mechanical Equipment and Systems ................................................................... 21-1  21.2  Electrical and Control Systems ........................................................................... 21-2  21.3  Off-Site Requirements ......................................................................................... 21-2  21.4  Capital Cost Estimate .......................................................................................... 21-2  21.5  O&M Estimate .................................................................................................... 21-5  21.6  Environmental Compliance Information ............................................................. 21-6  22.  Offshore Wind (WF) ................................................................................................. 22-1  22.1  Mechanical Equipment and Systems ................................................................... 22-1  22.2  Electrical and Control Systems ........................................................................... 22-2  v
  • 17.
    22.3  Off-Site Requirements ......................................................................................... 22-2  22.4  Capital Cost Estimate .......................................................................................... 22-3  22.5  O&M Estimate .................................................................................................... 22-6  22.6  Environmental Compliance Information ............................................................. 22-6  23.  Solar Thermal - Central Station (SO) ..................................................................... 23-1  23.1  Mechanical Equipment and Systems ................................................................... 23-1  23.2  Electrical and Control Systems ........................................................................... 23-2  23.3  Off-Site Requirements ......................................................................................... 23-3  23.4  Capital Cost Estimate .......................................................................................... 23-3  23.5  O&M Estimate .................................................................................................... 23-7  23.6  Environmental Compliance Information ............................................................. 23-7  24.  Photovoltaic (Central Station) Facility (PV) .......................................................... 24-1  24.1  Mechanical Equipment and Systems ................................................................... 24-1  24.2  Electrical and Control Systems ........................................................................... 24-1  24.3  Off-Site Requirements ......................................................................................... 24-2  24.4  Capital Cost Estimate .......................................................................................... 24-2  24.5  O&M Estimate .................................................................................................... 24-9  24.6  Environmental Compliance Information ........................................................... 24-10  vi
  • 18.
    LIST OF FIGURES Figure3-1 – Advanced Pulverized Coal Design Configuration .................................................. 3-2  Figure 4-1 – APC Facility Diagram ............................................................................................. 4-1  Figure 5-1 – Conventional NGCC Design Configuration ........................................................... 5-2  Figure 6-1 – AG-NGCC Design Configuration ........................................................................... 6-1  Figure 7-1 – AG-NGCC With CCS Design Configuration ......................................................... 7-1  Figure 8-1 – Conventional CT Design Configuration ................................................................. 8-1  Figure 9-1 – Advanced CT Design Configuration ....................................................................... 9-1  Figure 10-1 – IGCC Design Configuration ............................................................................... 10-3  Figure 11-1 – IGCC/CCS Design Configuration ....................................................................... 11-1  Figure 12-1 – AN Design Configuration ................................................................................... 12-2  Figure 13-1 – BCC Design Configuration ................................................................................. 13-2  Figure 14-1 – BCC Design Configuration ................................................................................. 14-1  Figure 15-1 – FC Design Configuration .................................................................................... 15-1  Figure 16-1 – GT Design Configuration .................................................................................... 16-2  Figure 17-1 – GT Design Configuration .................................................................................... 17-1  Figure 19-1 – HY Design Configuration ................................................................................... 19-1  Figure 20-1 – PS Design Configuration..................................................................................... 20-1  Figure 21-1 – WN Design Configuration .................................................................................. 21-1  Figure 22-1 – WF Design Configuration ................................................................................... 22-2  Figure 23-1 – SO Design Configuration .................................................................................... 23-2  Figure 24-1 – PV Design Configuration .................................................................................... 24-1  vii
  • 19.
    LIST OF TABLES Table1-1 – List of Technologies For Review ............................................................................. 1-2  Table 2-1 – Reference Coal Specification ................................................................................... 2-2  Table 2-2 – Natural Gas Specification ......................................................................................... 2-3  Table 2-3 – Wood-Biomass Specification ................................................................................... 2-3  Table 2-4 – CT Capacity Adjustments......................................................................................... 2-5  Table 2-5 – Technology Performance Specifications ................................................................ 2-10  Table 3-1 – Base Plant Site Capital Cost Estimate for APC........................................................ 3-3  Table 3-2 – Base Plant Site Capital Cost Estimate for APC........................................................ 3-4  Table 3-3 – Location-Based Costs for APC (650,000 kW) ......................................................... 3-5  Table 3-4 – Location-Based Costs for APC (1,300,000 kW) ...................................................... 3-7  Table 3-5 – O&M Expenses for APC (650,000 kW)................................................................... 3-8  Table 3-6 – O&M Expenses for APC (1,300,000 kW)................................................................ 3-8  Table 3-7 – Environmental Emissions for APC .......................................................................... 3-9  Table 4-1 – Base Plant Site Capital Cost Estimate for APC/CCS ............................................... 4-3  Table 4-2 – Base Plant Site Capital Cost Estimate for APC/CCS ............................................... 4-3  Table 4-3– Location-Based Costs for APC/CCS Facility (650,000 kW) .................................... 4-4  Table 4-4 – Location-Based Costs for APC/CCS Facility (1,300,000 kW) ................................ 4-6  Table 4-5 – O&M Expenses for APC/CCS (650,000 kW) .......................................................... 4-7  Table 4-6 – O&M Expenses for APC/CCS (1,300,000 kW) ....................................................... 4-8  Table 4-7 – Environmental Emissions for APC/CCS .................................................................. 4-8  Table 5-1 – Base Plant Site Capital Cost Estimate for Conventional NGCC .............................. 5-3  Table 5-2 – Location-Based Costs for Conventional NGCC....................................................... 5-5  Table 5-3 – O&M Expenses for Conventional NGCC ................................................................ 5-7  Table 5-4 – Environmental Emissions for Conventional NGCC................................................. 5-7  Table 6-1 – Base Plant Site Capital Cost Estimate for AG-NGCC ............................................. 6-2  Table 6-2 – Location-Based Costs for AG-NGCC ...................................................................... 6-3  Table 6-3 – O&M Expenses for AG-NGCC................................................................................ 6-4  Table 6-4 – Environmental Emissions for AG-NGCC ................................................................ 6-5  Table 7-1 – Base Plant Site Capital Cost Estimate for AG-NGCC/CCS Cost ............................ 7-2  Table 7-2 – Location-Based Costs for AG-NGCC/CCS ............................................................. 7-3  viii
  • 20.
    Table 7-3 –O&M Expenses for AG-NGCC With CCS .............................................................. 7-4  Table 7-4 – Environmental Emissions for AG-NGCC/CCS ....................................................... 7-5  Table 8-1 – Base Plant Site Capital Cost Estimate for Conventional CT.................................... 8-2  Table 8-2 – Location-Based Costs for Conventional CT............................................................. 8-4  Table 8-3 – O&M Expenses for Conventional CT ...................................................................... 8-6  Table 8-4 – Environmental Emissions for Conventional CT....................................................... 8-6  Table 9-1 – Base Plant Site Capital Cost Estimate for Advanced CT ......................................... 9-2  Table 9-2 – Location-Based Costs for Advanced CT .................................................................. 9-3  Table 9-3 – O&M Expenses for Advanced CT ........................................................................... 9-4  Table 9-4 – Environmental Emissions for Advanced CT ............................................................ 9-5  Table 10-1 – Base Plant Site Capital Cost Estimate for IGCC .................................................. 10-4  Table 10-2 – Base Plant Site Capital Cost Estimate for IGCC .................................................. 10-5  Table 10-3 – Location-Based Costs for IGCC (600,000 kW) ................................................... 10-7  Table 10-4 – Location-Based Costs for IGCC (1,200,000 kW) ................................................ 10-9  Table 10-5 – O&M Expenses for IGCC (600,000 kW) ........................................................... 10-10  Table 10-6 – O&M Expenses for IGCC (1,200,000 kW) ........................................................ 10-11  Table 10-7 – Environmental Emissions for IGCC ................................................................... 10-11  Table 11-1 – Base Plant Site Capital Cost Estimate for IGCC/CCS ......................................... 11-2  Table 11-2 – Location-Based Costs for IGCC/CCS .................................................................. 11-3  Table 11-3 – O&M Expenses for IGCC/CCS............................................................................ 11-4  Table 11-4 – Environmental Emissions for IGCC/CCS ............................................................ 11-5  Table 12-1 – Base Plant Site Capital Cost Estimate for AN...................................................... 12-4  Table 12-2 – Location-Based Costs for AN .............................................................................. 12-5  Table 12-3 – O&M Expenses for AN ........................................................................................ 12-7  Table 12-4 – Environmental Emissions for AN ........................................................................ 12-7  Table 13-1 – Base Plant Site Capital Cost Estimate for BCC ................................................... 13-4  Table 13-2 – Location-Based Costs for BCC ............................................................................ 13-6  Table 13-3 – O&M Expenses for BCC ...................................................................................... 13-7  Table 13-4 – Environmental Emissions for BCC ...................................................................... 13-8  Table 14-1 – Base Plant Site Capital Cost Estimate for BBFB ................................................. 14-3  Table 14-2– Location-Based Costs for BBFB ........................................................................... 14-5  Table 14-3 – O&M Expenses for BCC ...................................................................................... 14-6  Table 14-4 – Environmental Emissions for BBFB .................................................................... 14-7  ix
  • 21.
    Table 15-1 –Base Plant Site Capital Cost Estimate for FC ...................................................... 15-2  Table 15-2 – Location-Based Costs for FC ............................................................................... 15-4  Table 15-3 – O&M Expenses for FC ......................................................................................... 15-5  Table 15-4 – Environmental Emissions for FC ......................................................................... 15-6  Table 16-1 – Base Plant Site Capital Cost Estimate for GT ...................................................... 16-3  Table 16-2 – Location-Based Costs for GT ............................................................................... 16-5  Table 16-3 – O&M Expenses for GT ........................................................................................ 16-6  Table 16-4 – Environmental Emissions for GT ......................................................................... 16-7  Table 17-1 – Base Plant Site Capital Cost Estimate for GT ...................................................... 17-2  Table 17-2 – Location-Based Costs for GT ............................................................................... 17-4  Table 17-3 – O&M Expenses for Binary ................................................................................... 17-5  Table 17-4 – Environmental Emissions for Binary ................................................................... 17-6  Table 18-1 – Base Plant Site Capital Cost Estimate for MSW .................................................. 18-3  Table 18-2 – Location-Based Costs for MSW ........................................................................... 18-4  Table 18-3 – O&M Expenses for MSW .................................................................................... 18-6  Table 18-4 – Environmental Emissions for MSW ..................................................................... 18-6  Table 19-1 – Base Plant Site Capital Cost Estimate for HY...................................................... 19-2  Table 19-2 – Location-Based Costs for HY .............................................................................. 19-4  Table 19-3 – O&M Expenses for HY ........................................................................................ 19-5  Table 19-4 – Environmental Emissions for HY ........................................................................ 19-6  Table 20-1 – Base Plant Site Capital Cost Estimate for PS ....................................................... 20-2  Table 20-2 – Location-Based Costs for PS ................................................................................ 20-4  Table 20-3 – O&M Expenses for PS ......................................................................................... 20-5  Table 20-4 – Environmental Emissions for PS .......................................................................... 20-6  Table 21-1 – Location-Based Costs for WN.............................................................................. 21-3  Table 21-2 – Location-Based Costs for WN.............................................................................. 21-4  Table 21-3 – O&M Expenses for WN ....................................................................................... 21-6  Table 21-4 – Environmental Emissions for WN........................................................................ 21-6  Table 22-1 – Base Plant Site Capital Cost Estimate for WF ..................................................... 22-3  Table 22-2 – Location-Based Costs for WF .............................................................................. 22-5  Table 23-1 – Base Plant Site Capital Cost Estimate for SO ...................................................... 23-4  Table 23-2 – Location-Based Costs for SO ............................................................................... 23-6  Table 23-3 – O&M Expenses for SO ......................................................................................... 23-7  x
  • 22.
    Table 23-4 –Environmental Emissions for SO ......................................................................... 23-8  Table 24-1 – Base Plant Site Capital Cost Estimate for PV ...................................................... 24-3  Table 24-2 – Base Plant Site Capital Cost Estimate for PV ...................................................... 24-4  Table 24-3 – Location-Based Costs for PV (7 MW) ................................................................. 24-6  Table 24-4 – Location-Based Costs for PV (150 MW) ............................................................. 24-8  Table 24-5 – O&M Expenses for PV Facility (7 MW) ............................................................. 24-9  Table 24-6 – O&M Expenses for PV Facility (150 MW) ......................................................... 24-9  Table 24-7 – Environmental Emissions for PV ....................................................................... 24-10  xi
  • 23.
    LIST OF ACRONYMSAND ABBREVIATIONS AC Alternating Current AG Advanced Generation AG Advanced Generation AG-NGCC Advanced Generation Natural Gas Combined Cycle AG-NGCC/CCS Advanced Generation Natural Gas Combined Cycle with CCS AGR Acid Gas Removal AN Advanced Nuclear APC Advanced Pulverized Coal Facility APC/CCS Advanced Pulverized Coal with CCS ASU Air Separation Unit BACT Best Available Control Technology BCC Biomass Combined Cycle BBFB Biomass Bubbling Fluidized Bed BFB Bubbling Fluidized Bed BOP Balance-of-Plant BPF Brine Processing Facility Btu British Thermal Unit C Carbon CCS Carbon Capture and Sequestration CFB Circulating Fluidized Bed C2H6 Ethane C3H8 Propane C4H10 n-Butane CH4 Methane CO Carbon Monoxide CO2 Carbon Dioxide COS Carbonyl Sulfide CT Combustion Turbine DC Direct Current DCS Distributed Control System DLN Dry Low-NOX Combustion EIA Energy Information Administration EMM Electricity Market Module of NEMS EPC Engineering, Procurement and Construction F Degrees Fahrenheit FC Fuel Cell FGD Flue Gas Desulfurization FOM Fixed O&M Geothermal GT GHG Greenhouse Gas GSU Generator Step-up Transformer GT Geothermal H2S Hydrogen Sulfide xii
  • 24.
    HHV High(er) Heating Value HP High Pressure HRSG Heat Recovery Steam Generator HY Hydroelectric Hz Hertz I&C Instrumentation and Controls IGCC Integrated Gasification Combined Cycle IGCC/CCS Integrated Gasification Combined Cycle Carbon Capture and Sequestration IP Intermediate Pressure kg Kilograms KJ Kilojoules kW Kilowatt kWh Kilowatt-hour kV Kilovolt kVA kilovolt-amperes lb Pound LHV Low(er) Heating Value CLP Low Pressure MEA Monoethanolamine MJ Mega joules MMBtu Million Btu MSW Municipal Solid Waste MW Megawatt MWe Megawatts Electric MWh Megawatt-hour MVA Mega-volt-amperes N2 Nitrogen NEMS National Energy Modeling System NGCC Natural Gas Combined Cycle NH3 Ammonia NOX Oxides of Nitrogen O2 Oxygen O&M Operating and Maintenance NOx Nitrogen Oxides ppmvd Parts per Million Volume Dry PS Pumped Storage psia Pounds per Square Inch Absolute PV Photovoltaic PWR Pressurized Water Reactor RCS Reactor Coolant System S Sulfur SCADA Supervisory Control and Data Acquisition scf Standard Cubic Feet scm Standard Cubic Meters SCR Selective Catalytic Reduction SNCR Selective Non-catalytic Reduction xiii
  • 25.
    SO Solar Thermal SO2 Sulfur Dioxide SRU Sulfur Recovery Unit ST Steam Turbine TGF Turbine Generating Facility U.S. United States V Volt VOM Variable Operating and Maintenance WF Offshore Wind WFGD Wet Flue Gas Desulfurization WN Onshore Wind WTG Wind Turbine Generator ZLD Zero Liquid Discharge xiv
  • 26.
    1. INTRODUCTION This report presents R. W. Beck, Inc.’s (“R. W. Beck”) performance and cost assessment of power generation technologies utilized by the Energy Information Administration (“EIA”) in the Electricity Market Module (“EMM”) of the National Energy Modeling System (“NEMS”). The assessment for each of the technologies considered includes the following:  Overnight construction costs, construction lead times, first year of commercial application, typical unit size, contingencies, fixed and variable operating costs, and efficiency (heat rate). The analysis was conducted to ensure that the overnight cost estimates developed for use in the EMM for electric generating technologies are consistent in scope, accounting for all costs in the planning and development of a power plant including the basic interconnection to the grid at the plant site, but excluding financing costs.  For emission control technologies, the removal rates for pollutants and other assumptions were examined.  Review of the regional multipliers that are used to represent local conditions, such as labor rates that are included in EMM.  Review of assumptions regarding how construction costs decline over time due to technological advancement and “learning by doing.”  Review of the appropriateness of technology-specific project and process contingency assumptions (capturing differences between engineering estimates and realized costs for new technologies).  Where possible, compare the values used by EIA with those for recently built facilities in the United States (“U.S.”) or abroad. Where such actual cost estimates do not exist, an assessment was made between values used by EIA and other analyst estimates, as well as vendor estimates.  The key factors expected to drive each technology’s costs.  Document the source and basis for final recommendations for altering or retaining the various assumptions. 1.1 TECHNOLOGIES ASSESSED The following table lists all technologies to be assessed in this project. 1-1
  • 27.
    TABLE 1-1 –LIST OF TECHNOLOGIES FOR REVIEW TECHNOLOGY DESCRIPTION COMMENTS Advanced Pulverized Coal 650 megawatt-electrical (“MWe”) Greenfield Installation and 1,300 MWe; supercritical; all advanced pollution control technologies Advanced Pulverized Coal with 650 MWe and 1,300 MWe; Greenfield Installation Carbon Capture and supercritical; all advanced Sequestration (“CCS”) pollution control technologies, including CCS technologies Conventional Natural Gas 540 MWe; F-Class system Combined Cycle (“NGCC”) Advanced NGCC 400 MWe; H-Class system Advanced NGCC with CCS 340 MWe; H-Class system Conventional Combustion 85 MWe; E-Class turbine Turbine (“CT”) Advanced CT 210 MWe; F-Class turbine Integrated Gasification 600 MWe and 1,200 MWe; F- Combined Cycle (“IGCC”) Class-syngas system IGCC with CCS 520 MWe; F-Class-syngas system Advanced Nuclear 2,236 megawatt (“MW”); AP1000 Brownfield Installation PWR Basis Biomass Combined Cycle 20 MWe Wood Fuel Biomass Bubbling Fluidized 50 MWe Wood Fuel Bed (“BFB”) Fuel Cells 10 MWe Geothermal 50 MWe Dual Flash and Binary Municipal Solid Waste 50 MWe (“MSW”) Hydroelectric 500 MWe Pumped Storage 250 MWe Wind Farm – Onshore 100 MWe Wind Farm – Offshore 400 MWe Solar Thermal – Central Station 100 MWe Photovoltaic – Central Station 7 MWe and 150 MWe 1-2
  • 28.
    2. GENERAL BASIS FOR TECHNOLOGY EVALUATION BASIS This section specifies the general evaluation basis used for all technologies reviewed herein. 2.1 R. W. BECK BACKGROUND R. W. Beck is an infrastructure consulting firm that has been providing technical and business consulting in the energy industry since 1942. Particularly, R. W. Beck has supported the purchase, sale, financing and Owner’s advisory consulting for tens-of-billions of dollars of power plants across the world in all commercial power generating technologies as well as many emerging technologies. This background has supported R. W. Beck’s acumen with respect to construction costs, operating costs, technology development and evolution, as well as trends in environmental regulation and compliance. 2.2 BASE FUEL CHARACTERISTICS This section provides a general fuel basis for each of the fuel types utilized by the technologies considered in this report and listed in Table 1-1. Each of the technologies that combust a fuel has the ability to operate over a range of fuels; thus Table 2-1, Table 2-2 and Table 2-3 show a typical fuel specification for coal, natural gas, and wood-biomass, respectively. MSW has such a wide range of constituents; a typical analysis is not included here. 2-1
  • 29.
    TABLE 2-1 –REFERENCE COAL SPECIFICATION Rank Bituminous Seam Illinois No. 6 (Herrin) Source Old Ben Mine Proximate Analysis (weight %) (Note A) As Received Dry Moisture 11.12 0.00 Ash 9.70 10.91 Volatile Matter 34.99 39.37 Fixed Carbon 44.19 49.72 Total 100.00 100.00 Sulfur 2.51 2.82 HHV (1), KJ/kg (2) 27,113 30,506 HHV, Btu/lb (3) 11,666 13,126 (4) LHV , KJ/kg 26,151 29,544 LHV, Btu/lb 11,252 12,712 Ultimate Analysis (weight %) As Received Dry Moisture 11.12 0.00 Carbon 63.75 71.72 Hydrogen 4.50 5.06 Nitrogen 1.25 1.41 Chlorine 0.29 0.33 Sulfur 2.51 2.82 Ash 9.70 10.91 Oxygen 6.88 7.75 Total 100.00 100.00 (1) High(er) heating value (“HHV”). (2) Kilojoules per kilogram (“KJ/kg”). (3) British thermal units per pound (“Btu/lb”). (4) Low(er) heating value (“LHV”). 2-2
  • 30.
    TABLE 2-2 –NATURAL GAS SPECIFICATION Component Volume Percentage Methane CH4 93.9 Ethane C2H6 3.2 Propane C3H8 0.7 n-Butane C4H10 0.4 Carbon Dioxide CO2 1.0 Nitrogen N2 0.8 Total 100.0 LHV HHV kJ/kg 47.764 52,970 MJ/scm (1) 35 39 Btu/lb 20,552 22,792 Btu/scf (2) 939 1,040 (1) Mega joules per standard cubic meter (“MJ/scm”). (2) Standard cubic feet (“scf”). TABLE 2-3 – WOOD-BIOMASS SPECIFICATION (1) Component Volume Percentage Moisture 17.27 Carbon C 41.55 Hydrogen H2 4.77 Nitrogen N2 0.37 Sulfur S <0.01 Ash 2.35 Oxygen (2) O2 33.75 Total 100.0 HHV Btu/lb 6,853 (1) As received. (2) Oxygen by Difference. 2-3
  • 31.
    2.3 ENVIRONMENTAL COMPLIANCEBASIS The technology assessments considered the emissions rates after implementation of best available control technology (“BACT”), including sulfur dioxide (“SO2”), oxides of nitrogen (“NOX”), particulate matter, mercury, and carbon dioxide (“CO2”). With respect to CCS technologies, which are not currently considered “proven” or BACT by regulating bodies, R. W. Beck assumed capture and sequestration technologies that are currently in development for large-scale deployment, as discussed herein, and at industry expected rates of CO2 removal (i.e., 90 percent). 2.4 LOCAL CAPACITY ADJUSTMENTS For power plants that use CT technologies, adjustments were made for regional ambient conditions. The adjustments took into consideration that CTs are machines that produce power proportional to mass flow. Since air density is inversely proportional to temperature, ambient temperature has a strong influence on the capacity of a given technology utilizing a CT (e.g., peaking power plant, combined-cycle power plant, and some gasification power plants). Additionally, relative humidity impacts the available capacity of a CT and consequently a CT-based power plant, primarily driven by the base assumption that the CT-based technologies incorporate inlet evaporative cooling. By circulating water across a porous media in the CT compressor inlet (across which the air flows), the inlet evaporative cooling reduces the difference between the ambient dry-bulb temperature (the temperature that is typically reported to the public as a measure of “local temperature”) and the wet-bulb temperature (a measure of relative humidity). Since inlet evaporative cooling is limited by the wet-bulb temperature, the effectiveness of these devices increases in areas of high dry-bulb temperature and low relative humidity. The final adjustment for ambient conditions made for the CT-based plants is ambient pressure, which on average (notwithstanding high or low pressure weather fronts that pass through a region) takes into consideration elevation (average number of feet above sea level). Air density is proportional to ambient pressure. Table 2-4 provides the aggregate capacity adjustment for each location, which provides regional differences related to capital costs against the ISO net capacity for the CT-based power plant technologies. 2-4
  • 32.
    TABLE 2-4 –CT CAPACITY ADJUSTMENTS Conventional CT Advanced CT Conventional NGCC Advanced ‐ NGCC Advanced ‐ NGCC With CCS IGCC IGCC With CCS ISO Capacity Adjusted ISO Capacity Adjusted ISO Capacity Adjusted ISO Capacity Adjusted ISO Capacity Adjusted ISO Capacity Adjusted ISO Capacity Adjusted Capacity Adjustment Capacity Capacity Adjustment Capacity Capacity Adjustment Capacity Capacity Adjustment Capacity Capacity Adjustment Capacity Capacity Adjustment Capacity Capacity Adjustment Capacity State City (MW) (MW) (MW) (MW) (MW) (MW) (MW) (MW) (MW) (MW) (MW) (MW) (MW) (MW) (MW) (MW) (MW) (MW) (MW) (MW) (MW) Alaska Anchorage 85 7.58 92.58 210 18.73 229 540 32.27 572 400 35.67 436 340 30.32 370 600 35.85 636 520 46.38 566 Alaska Fairbanks 85 9.97 94.97 210 24.63 235 540 42.43 582 400 46.91 447 340 39.87 380 600 47.14 647 520 60.98 581 Alabama Huntsville 85 ‐2.12 82.88 210 ‐5.23 205 540 ‐9.01 531 400 ‐9.96 390 340 ‐8.46 332 600 ‐10.01 590 520 ‐12.94 507 Arizona Phoenix 85 ‐8.33 76.67 210 ‐20.59 189 540 ‐35.47 505 400 ‐39.22 361 340 ‐33.34 307 600 ‐39.41 561 520 ‐50.98 469 Arkansas Little Rock 85 ‐1.77 83.23 210 ‐4.37 206 540 ‐7.53 532 400 ‐8.32 392 340 ‐7.07 333 600 ‐8.36 592 520 ‐10.82 509 California Los Angeles 85 ‐1.77 83.23 210 ‐4.37 206 540 ‐7.52 532 400 ‐8.32 392 340 ‐7.07 333 600 ‐8.36 592 520 ‐10.81 509 California Redding 85 ‐2.52 82.48 210 ‐6.21 204 540 ‐10.71 529 400 ‐11.84 388 340 ‐10.06 330 600 ‐11.90 588 520 ‐15.39 505 California Bakersfield 85 ‐3.77 81.23 210 ‐9.30 201 540 ‐16.03 524 400 ‐17.72 382 340 ‐15.06 325 600 ‐17.81 582 520 ‐23.03 497 California Sacramento 85 ‐0.69 84.31 210 ‐1.71 208 540 ‐2.95 537 400 ‐3.26 397 340 ‐2.78 337 600 ‐3.28 597 520 ‐4.24 516 California San Francisco 85 0.83 85.83 210 2.06 212 540 3.54 544 400 3.92 404 340 3.33 343 600 3.94 604 520 5.09 525 Colorado Denver 85 ‐12.30 72.70 210 ‐30.40 180 540 ‐52.37 488 400 ‐57.90 342 340 ‐49.22 291 600 ‐58.19 542 520 ‐75.27 445 Connecticut Hartford 85 2.97 87.97 210 7.33 217 540 12.63 553 400 13.96 414 340 11.87 352 600 14.03 614 520 18.15 538 Delaware Dover 85 1.22 86.22 210 3.00 213 540 5.17 545 400 5.72 406 340 4.86 345 600 5.75 606 520 7.43 527 District of Columbia Washington 85 2.01 87.01 210 4.96 215 540 8.55 549 400 9.46 409 340 8.04 348 600 9.50 610 520 12.29 532 Florida Tallahassee 85 ‐3.00 82.00 210 ‐7.42 203 540 ‐12.79 527 400 ‐14.14 386 340 ‐12.01 328 600 ‐14.21 586 520 ‐18.38 502 Florida Tampa 85 ‐4.78 80.22 210 ‐11.80 198 540 ‐20.34 520 400 ‐22.49 378 340 ‐19.11 321 600 ‐22.60 577 520 ‐29.23 491 Georgia Atlanta 85 ‐3.66 81.34 210 ‐9.05 201 540 ‐15.59 524 400 ‐17.24 383 340 ‐14.65 325 600 ‐17.32 583 520 ‐22.41 498 Hawaii Honolulu 85 ‐6.75 78.25 210 ‐16.66 193 540 ‐28.71 511 400 ‐31.74 368 340 ‐26.98 313 600 ‐31.90 568 520 ‐41.26 479 Idaho Boise 85 ‐5.52 79.48 210 ‐13.64 196 540 ‐23.50 517 400 ‐25.98 374 340 ‐22.08 318 600 ‐26.11 574 520 ‐33.77 486 Illinois Chicago 85 1.76 86.76 210 4.35 214 540 7.49 547 400 8.28 408 340 7.04 347 600 8.33 608 520 10.77 531 Indiana Indianapolis 85 0.20 85.20 210 0.50 211 540 0.87 541 400 0.96 401 340 0.81 341 600 0.96 601 520 1.24 521 Iowa Davenport 85 1.81 86.81 210 4.47 214 540 7.70 548 400 8.51 409 340 7.23 347 600 8.55 609 520 11.06 531 Iowa Waterloo 85 2.02 87.02 210 4.98 215 540 8.58 549 400 9.48 409 340 8.06 348 600 9.53 610 520 12.33 532 Kansas Wichita 85 ‐2.91 82.09 210 ‐7.19 203 540 ‐12.39 528 400 ‐13.70 386 340 ‐11.65 328 600 ‐13.77 586 520 ‐17.81 502 Kentucky Louisville 85 ‐0.20 84.80 210 ‐0.50 210 540 ‐0.86 539 400 ‐0.95 399 340 ‐0.81 339 600 ‐0.96 599 520 ‐1.24 519 Louisiana New Orleans 85 ‐3.26 81.74 210 ‐8.05 202 540 ‐13.87 526 400 ‐15.34 385 340 ‐13.03 327 600 ‐15.41 585 520 ‐19.94 500 Maine Portland 85 4.72 89.72 210 11.66 222 540 20.08 560 400 22.20 422 340 18.87 359 600 22.31 622 520 28.86 549 Maryland Baltimore 85 1.21 86.21 210 2.98 213 540 5.13 545 400 5.67 406 340 4.82 345 600 5.70 606 520 7.38 527 Massachusetts Boston 85 2.92 87.92 210 7.20 217 540 12.41 552 400 13.72 414 340 11.66 352 600 13.79 614 520 17.84 538 Michigan Detroit 85 2.03 87.03 210 5.00 215 540 8.62 549 400 9.53 410 340 8.10 348 600 9.58 610 520 12.39 532 Michigan Grand Rapids 85 1.97 86.97 210 4.87 215 540 8.39 548 400 9.27 409 340 7.88 348 600 9.32 609 520 12.05 532 Minnesota Saint Paul 85 2.00 87.00 210 4.95 215 540 8.52 549 400 9.42 409 340 8.01 348 600 9.47 609 520 12.25 532 Mississippi Jackson 85 ‐2.95 82.05 210 ‐7.30 203 540 ‐12.58 527 400 ‐13.90 386 340 ‐11.82 328 600 ‐13.97 586 520 ‐18.08 502 Missouri St. Louis 85 ‐0.40 84.60 210 ‐0.98 209 540 ‐1.68 538 400 ‐1.86 398 340 ‐1.58 338 600 ‐1.87 598 520 ‐2.42 518 Missouri Kansas City 85 ‐1.23 83.77 210 ‐3.04 207 540 ‐5.23 535 400 ‐5.78 394 340 ‐4.92 335 600 ‐5.81 594 520 ‐7.52 512 Montana Great Falls 85 ‐6.00 79.00 210 ‐14.81 195 540 ‐25.52 514 400 ‐28.21 372 340 ‐23.98 316 600 ‐28.35 572 520 ‐36.68 483 Nebraska Omaha 85 0.15 85.15 210 0.36 210 540 0.62 541 400 0.68 401 340 0.58 341 600 0.69 601 520 0.89 521 New Hampshire Concord 85 4.18 89.18 210 10.33 220 540 17.79 558 400 19.67 420 340 16.72 357 600 19.77 620 520 25.57 546 New Jersey Newark 85 1.69 86.69 210 4.18 214 540 7.21 547 400 7.97 408 340 6.77 347 600 8.01 608 520 10.36 530 New Mexico Albuquerque 85 ‐13.95 71.05 210 ‐34.46 176 540 ‐59.37 481 400 ‐65.64 334 340 ‐55.79 284 600 ‐65.97 534 520 ‐85.33 435 New York New York 85 1.69 86.69 210 4.18 214 540 7.21 547 400 7.97 408 340 6.77 347 600 8.01 608 520 10.36 530 New York Syracuse 85 3.06 88.06 210 7.56 218 540 13.03 553 400 14.41 414 340 12.25 352 600 14.48 614 520 18.73 539 Nevada Las Vegas 85 ‐9.24 75.76 210 ‐22.82 187 540 ‐39.31 501 400 ‐43.46 357 340 ‐36.95 303 600 ‐43.68 556 520 ‐56.50 463 North Carolina Charlotte 85 ‐2.41 82.59 210 ‐5.95 204 540 ‐10.26 530 400 ‐11.34 389 340 ‐9.64 330 600 ‐11.40 589 520 ‐14.74 505 North Dakota Bismarck 85 1.02 86.02 210 2.53 213 540 4.36 544 400 4.82 405 340 4.09 344 600 4.84 605 520 6.26 526 Ohio Cincinnati 85 1.45 86.45 210 3.58 214 540 6.16 546 400 6.81 407 340 5.79 346 600 6.85 607 520 8.85 529 Oregon Portland 85 2.02 87.02 210 5.00 215 540 8.61 549 400 9.51 410 340 8.09 348 600 9.56 610 520 12.37 532 Pennsylvania Philadelphia 85 1.88 86.88 210 4.65 215 540 8.00 548 400 8.85 409 340 7.52 348 600 8.89 609 520 11.50 532 Pennsylvania Wilkes‐Barre 85 1.07 86.07 210 2.64 213 540 4.55 545 400 5.03 405 340 4.27 344 600 5.05 605 520 6.54 527 Rhode Island Providence 85 3.16 88.16 210 7.82 218 540 13.47 553 400 14.89 415 340 12.66 353 600 14.96 615 520 19.36 539 South Carolina Spartanburg 85 ‐2.32 82.68 210 ‐5.73 204 540 ‐9.88 530 400 ‐10.92 389 340 ‐9.28 331 600 ‐10.98 589 520 ‐14.20 506 South Dakota Rapid City 85 ‐5.15 79.85 210 ‐12.72 197 540 ‐21.91 518 400 ‐24.22 376 340 ‐20.59 319 600 ‐24.34 576 520 ‐31.49 489 Tennessee Knoxville 85 ‐2.15 82.85 210 ‐5.32 205 540 ‐9.17 531 400 ‐10.14 390 340 ‐8.62 331 600 ‐10.19 590 520 ‐13.18 507 Texas Houston 85 ‐3.46 81.54 210 ‐8.54 201 540 ‐14.71 525 400 ‐16.27 384 340 ‐13.83 326 600 ‐16.35 584 520 ‐21.15 499 Utah Salt Lake City 85 ‐9.73 75.27 210 ‐24.03 186 540 ‐41.40 499 400 ‐45.77 354 340 ‐38.90 301 600 ‐46.00 554 520 ‐59.50 461 Vermont Burlington 85 4.40 89.40 210 10.86 221 540 18.71 559 400 20.68 421 340 17.58 358 600 20.79 621 520 26.89 547 Virginia Alexandria 85 0.27 85.27 210 0.66 211 540 1.14 541 400 1.26 401 340 1.07 341 600 1.26 601 520 1.63 522 Virginia Lynchburg 85 ‐1.05 83.95 210 ‐2.59 207 540 ‐4.47 536 400 ‐4.94 395 340 ‐4.20 336 600 ‐4.96 595 520 ‐6.42 514 Washington Seattle 85 1.10 86.10 210 2.72 213 540 4.68 545 400 5.18 405 340 4.40 344 600 5.20 605 520 6.73 527 Washington Spokane 85 ‐2.90 82.10 210 ‐7.17 203 540 ‐12.35 528 400 ‐13.66 386 340 ‐11.61 328 600 ‐13.73 586 520 ‐17.75 502 West Virginia Charleston 85 ‐1.21 83.79 210 ‐3.00 207 540 ‐5.16 535 400 ‐5.71 394 340 ‐4.85 335 600 ‐5.74 594 520 ‐7.42 513 Wisconsin Green Bay 85 3.51 88.51 210 8.67 219 540 14.94 555 400 16.52 417 340 14.04 354 600 16.60 617 520 21.47 541 Wyoming Cheyenne 85 ‐13.05 71.95 210 ‐32.24 178 540 ‐55.55 484 400 ‐61.42 339 340 ‐52.21 288 600 ‐61.7 538 520 ‐79.84 440 Puerto Rico Cayey 85 ‐6.00 79.00 210 ‐14.83 195 540 ‐25.56 514 400 ‐28.25 372 340 ‐24.02 316 600 ‐28.40 572 520 ‐36.73 483 2-5
  • 33.
    2.5 TECHNOLOGY SPECIFICATIONS Thissection provides the base performance specifications for each technology. Table 2-5 provides the current technology specifications. 2.6 COST ESTIMATION METHODOLOGY 2.6.1 Capital Cost A summary base capital cost estimate (“Cost Estimate”) was developed for each power plant technology, based on a generic facility of a certain size (capacity) and configuration, and assuming a non-specific U.S. location with no unusual location impacts (e.g., urban construction constraints) or infrastructure needs (e.g., a project-dedicated interconnection upgrade cost). Each Cost Estimate was developed assuming costs in fourth quarter 2010 dollars on an “overnight” capital cost basis. In each Cost Estimate, the total project engineering, procurement and construction (“EPC”) cost was organized into the following categories:  Civil/structural material and installation,  Mechanical equipment supply and installation,  Electrical instrumentation and controls (“I&C”) supply and installation,  Project indirect costs, fees and contingency, and  Owner’s costs (excluding project financing costs). It should be noted that an EPC (turnkey) or equipment supply/balance of plant, as applicable to a given technology, contracting approach was assumed for each of the technologies, which included a risk sharing between the project owner and project construction contractor that, based on our experience, would be required in typical financing markets. This approach does not always result in the lowest cost of construction; however, on average, we believe this approach to result in an achievable cost of construction, given the other considerations discussed herein. In addition to the base Cost Estimate provided for the given technology, specific regional cost differences were determined. Regional costs for 64 unique locations in the U.S. were analyzed. Eleven subcategories were used (depending on the specific technology under review) to estimate the differences in various regions of the U.S. for the each power plant technology. The regional analyses include but are not limited to assessing the cost differences for outdoor installation considerations, air-cooled condensers versus cooling tower issues, seismic design differences, zero-water discharge issues, local enhancements, remote location issues, urban high-density population issues, labor wage and productivity differences, location adjustments, owner cost differences, and the increase in overheads associated with these 10 locations. More detail with respect to regional differences for each given technology is provided in the following sections. 2.6.1.1 Costing Scope The civil and structural costs include allowance for site preparation, such as clearing, roads, drainage, underground utilities installation, concrete for foundations, piling material, structural steel supply and installation, and buildings. The mechanical equipment supply and installation includes major equipment , including but not limited to, boilers, scrubbers, cooling tower, steam turbine (“ST”) generators, solar panels, CTs, 2-6
  • 34.
    as well asauxiliary equipment such as material handling, fly and bottom ash handling, pumps, condensers, and balance of plant (“BOP”) equipment such as fire protection, as applicable to a given technology. The electrical and I&C supply and installation includes electrical transformers, switchgear, motor control centers, switchyards, distributed control systems (“DCS”) and instrumentation, and electrical commodities, such as wire, cable tray, and lighting. While commodities, project equipment, and site assumptions can vary widely from project-to- project for a given technology, the Cost Estimates are based upon a cross section of projects. The project indirect costs include engineering, distributable labor and materials, craft labor overtime and incentives, scaffolding costs, construction management, and start-up and commissioning. The fees and contingency include contractor overhead costs, fees and profit, and construction contingency. Contingency in this category is considered “contractor” contingency, which would be held by a given contractor to mitigate its risk in the construction of a project. The owner’s costs include development costs, preliminary feasibility and engineering studies, environmental studies and permitting, legal fees, project management (including third-party management), insurance costs, infrastructure interconnection costs (e.g., gas, electricity), Owner’s Contingency, and property taxes during construction. The electrical interconnection cost includes an allowance for the plant switchyard and a subsequent interconnection to an “adjacent” (e.g. within a mile) of the plant, but does not include significant transmission system upgrades. 2.6.2 Operation and Maintenance (O&M) Expenses O&M expenses consist of non-fuel O&M costs, owner’s expenses, and fuel-related expenses. In evaluating the non-fuel O&M expenses for use in the EMM of NEMS, we focused on non-fuel O&M costs associated with the direct operation of the given power plant technology, referred to here as the “Production Related Non-Fuel O&M Expenses,” to allow for comparison of O&M costs on the same basis. Production Related Non-Fuel O&M Expenses include the following categories:  Fixed O&M (“FOM”)  Variable O&M (“VOM”)  Major Maintenance Presented below is a brief summary below of the expense categories included within the categories of Fixed O&M, Variable O&M, and Major Maintenance. Further, Sections 3 through 22 provide more specific information related to Production-Related Non-Fuel O&M Expenses for each technology. Owner’s expenses, which are not addressed in this report, include expenses paid by plant owners that are plant specific and can vary significantly between two virtually identical plants in the same geographic region. For example, the owner’s expenses include, but are not limited to, property taxes, asset management fees, energy marketing fees, and insurance. 2-7
  • 35.
    2.6.2.1 Fixed O&M(FOM) FOM expenses are those expenses incurred at a power plant that do not vary significantly with generation and include the following categories:  Staffing and monthly fees under pertinent operating agreements  Typical bonuses paid to the given plant operator  Plant support equipment which consists of equipment rentals and temporary labor  Plant-related general and administrative expenses (postage, telephone, etc.)  Routine preventive and predictive maintenance performed during operations  Maintenance of structures and grounds  Other fees required for a project to participate in the relevant National Electric Reliability Council region and be in good standing with the regulatory bodies. Routine preventive and predictive maintenance expenses do not require an extended plant shutdown and include the following categories:  Maintenance of equipment such as water circuits, feed pumps, main steam piping, and demineralizer systems  Maintenance of electric plant equipment, which includes service water, DCS, condensate system, air filters, and plant electrical  Maintenance of miscellaneous plant equipment such as communication equipment, instrument and service air, and water supply system  Plant support equipment which consists of tools, shop supplies and equipment rental, and safety supplies. 2.6.2.2 Variable O&M (VOM) VOM expenses are production-related costs which vary with electrical generation and include the following categories, as applicable to the given power plant technology:  Raw water  Waste and wastewater disposal expenses  Purchase power (which is incurred inversely to operating hours), demand charges and related utilities  Chemicals, catalysts and gases  Ammonia (“NH3”) for selective catalytic reduction (“SCR”), as applicable  Lubricants  Consumable materials and supplies. 2.6.2.3 Major Maintenance Major maintenance expenses generally require an extended outage, are typically undertaken no more than once per year; and are assumed to vary with electrical generation or the number of 2-8
  • 36.
    plant starts basedon the given technology and specific original equipment manufacturer recommendations and requirements. These major maintenance expenses include the following expense categories:  Scheduled major overhaul expenses for maintaining the prime mover equipment at a power plant  Major maintenance labor  Major maintenance spares parts costs  BOP major maintenance, which is major maintenance on the equipment at the given plant that cannot be accomplished as part of routine maintenance or while the unit is in commercial operation. 2-9
  • 37.
    TABLE 2-5 –TECHNOLOGY PERFORMANCE SPECIFICATIONS Nominal Nominal Capital Variable Capacity Heat Rate Cost Fixed O&M O&M SO2 (lb/ NOX CO2 Technology Fuel (kW) (1) (Btu/kWh) (2) ($/kW) (3) ($/kW-yr) (4) ($/MWh) (5) MMBtu (6) (lb/MMBtu) (lb/MMBtu) Advanced Pulverized Coal Coal 650,000 8,800 3,167 35.97 4.25 0.1 (6) 0.06 206 (7) Advanced Pulverized Coal Coal 1,300,000 8,800 2,844 29.67 4.25 0.1 (6) 0.06 206 (7) Advanced Pulverized Coal with 0.02 (8) 0.06 20.6 (9) CCS Coal 650,000 12,000 5,099 76.62 9.05 Advanced Pulverized Coal with 0.02 (8) 0.06 20.6 (9) CCS Coal 1,300,000 12,000 4,579 63.21 9.05 NGCC Gas 540,000 7,050 978 14.39 3.43 0.001 0.0075 (13) 117 (14) AG-NGCC Gas 400,000 6,430 1,003 14.62 3.11 0.001 0.0075 (13) 117 (14) Advanced NGCC with CCS Gas 340,000 7,525 2,060 30.25 6.45 0.001 0.0075 (13) 12 (15) Conventional CT Gas 85,000 10,850 974 6.98 14.70 0.001 0.03 (12) 117 (14) Advanced CT Gas 210,000 9,750 665 6.70 9.87 0.001 0.03 (13) 117 (14) IGCC Coal 600,000 8,700 3,565 59.23 6.87 0.025 (10) 0.0075 (12) 206 (14) IGCC Coal 1,200,000 8,700 3,221 48.90 6.87 0.025 (10) 0.0075 (12) 206 (14) IGCC with CCS Coal 520,000 10,700 5,348 69.30 8.04 0.015 (11) 0.0075 (12) 20.6 (14) Advanced Nuclear Uranium 2,236,000 N/A 5,339 88.75 2.04 0 0 0 Biomass Combined Cycle Biomass 20,000 12,350 7,894 338.79 16.64 0 0.054 195 (14) Biomass BFB Biomass 50,000 13,500 3,860 100.50 5.00 0 0.08 195 (14) Fuel Cells Gas 10,000 9,500 6,835 350 0 0.00013 0.013 130 Geothermal – Dual Flash Geothermal 50,000 N/A 5,578 84.27 9.64 0.2 (16) 0 120 (17) Geothermal – Binary Geothermal 50,000 N/A 4,141 84.27 9.64 0.2 (16) 0 120 (17) MSW MSW 50,000 18,000 8,232 373.76 8.33 0.07 (18) 0.27 (19) 200 Hydroelectric Hydro 500,000 N/A 3,076 13.44 0 0 0 0 Pumped Storage Hydro 250,000 N/A 5,595 13.03 0 0 0 0 Onshore Wind Wind 100,000 N/A 2,438 28.07 0 0 0 0 Offshore Wind Wind 400,000 N/A 5,975 53.33 0 0 0 0 Solar Thermal Solar 100,000 N/A 4,692 64.00 0 0 0 0 Photovoltaic Solar 7,000 N/A 6,050 26.04 0 0 0 0 Photovoltaic Solar 150,000 N/A 4,755 16.70 0 0 0 0 Footnotes are listed on the next page. 2-10
  • 38.
    (1) Capacity is net of auxiliary loads. (2) Heat Rate is on a HHV basis for British thermal units per kilowatt-hour (“Btu/kWh”). (3) Capital Cost excludes financing-related costs (e.g., fees, interest during construction). (4) FOM expenses exclude owner's costs (e.g., insurance, property taxes, and asset management fees). (5) VOM expenses include major maintenance. (6) Million Btu (“MMBtu”). (7) Based on high sulfur bituminous fuel. Emission rate could be lower for sub-bituminous fuel. (8) From greenhouse gas (“GHG”) Reporting Rule for Bituminous Coal. (9) SO2 emission rates are lower than in the non-capture case to avoid reagent contamination. (10) Assuming 90 percent capture. (11) Assuming 3 percent sulfur coal at 12,000 British thermal units per pound (“Btu/lb”) and a 99.5 percent sulfur removal rate. (12) Assuming 3 percent sulfur coal at 12,000 Btu/lb and a 99.7 percent sulfur removal rate. (13) Assuming 9 parts per million volume dry (“ppmvd”) corrected to 15 percent O2; simple-cycle E-Class or F-Class engine. (14) Assuming 2 ppmvd corrected to 15 percent O2 for F-Class engine. Assumes development of SCR for IGCC with CCS. (15) From GHG Reporting Rule for Pipeline Natural Gas. (16) Assuming 90 percent capture. (17) Reported as pounds per MWh and as H2S – actual will vary with resource. (18) Reported as pounds per MWh – actual will vary with resource. (19) Based on 30 ppmvd at 7 percent O2 – 5,000 Btu/lb HHV of MSW. (20) Based on 150 ppmvd at 7 percent O2 - 5,000 Btu/lb HHV of MSW. 2-11
  • 39.
    3. ADVANCED PULVERIZED COAL (APC) 3.1 MECHANICAL EQUIPMENT AND SYSTEMS The following describes the Advanced Pulverized Coal Facility, which is a nominal 650 MW coal-fired supercritical steam-electric generating unit built in a Greenfield location. An analysis is also provided for a nominally 1,300 MW coal-fired supercritical steam-electric generating unit built in a Greenfield location, which is essentially a dual-unit configuration, based on doubling the single-unit description provided below; however, a detailed technical description (due to the similarities/duplication with the single unit) is not provided herein. This unit employs a supercritical Rankine power cycle in which coal is burned to produce steam in a boiler, which is expanded through a ST to produce electric power. The steam is then condensed to water and pumped back to the boiler to be converted to steam once again to complete the cycle. The unit will operate at steam conditions of up to 3,700 pounds per square inch-absolute (“psia”) and 1,050 degrees Fahrenheit (“ºF”) at the ST inlet. The superheated steam produced in the boiler is supplied to the ST, which drives an electric generator. After leaving the high-pressure (“HP”) ST, the steam is reheated and fed to the intermediate-pressure (“IP”) ST. In the low-pressure (“LP”) ST, the steam admitted directly from the IP ST expands to condenser pressure and is condensed in the condenser. Cooling tower water is used for the condensing process. Condensate collected in the condenser hotwell is discharged by the main condensate pumps and returned to the deaerator/feedwater storage tank via the LP feedwater heaters. The feedwater pumps discharge feedwater from the feedwater storage tank to the boiler via the HP feedwater heaters. In the boiler, the supercritical fluid is heated for return to the ST. The combustion air and flue gas systems are designed for balanced draft and starts with the ambient air drawn in by the forced draft fans. This air is heated by steam preheaters and the regenerative air heaters. Some of the air is passed through the primary air fans for use in drying and conveying the pulverized coal to the boiler. The air and coal combust in the boiler furnace and the flue gas passes through the furnace and back passes of the boiler, giving up heat to the supercritical fluid in the boiler tubes. The flue gas exiting the boiler economizer enters the SCR equipment for NOX reduction and into the regenerative air heaters where it transfers heat to the incoming air. From the regenerative air heaters, the flue gas is treated with an injection of hydrated lime, enters a pulse-jet fabric filter (baghouse) for the collection of particulate material, and then flows to the induced draft fans. From the fans, gas enters the Wet Flue Gas Desulfurization (“WFGD”) absorber. From the absorber, the flue gas discharges into the stack. Figure 3-1 presents the Advanced Pulverized Coal process flow diagram. 3-1
  • 40.
    FIGURE 3-1 –ADVANCED PULVERIZED COAL DESIGN CONFIGURATION 3.2 ELECTRICAL AND CONTROL SYSTEMS The Advanced Pulverized Coal Facility has one ST electric generator. The generator is a 60 Hertz (“Hz”) machine rated at approximately 800 mega-volt-amperes (“MVA”) with an output voltage of 24 kilovolts (“kV”). The ST electric generator is directly connected to generator step-up transformer (“GSU”), which in turn is connected between two circuit breakers in the high-voltage bus in the Advanced Pulverized Coal Facility switchyard through a disconnect switch. The GSU increases the voltage from the electric generator from 24 kV to interconnected transmission system high voltage. The Advanced Pulverized Coal Facility is controlled using a DCS. The DCS provides centralized control of the plant by integrating the control systems provided with the boiler, ST and associated electric generator and the control of BOP systems and equipment. 3.3 OFF-SITE REQUIREMENTS Coal is delivered to the facility via rail, truck or barge. Water for all processes at the Advanced Pulverized Coal Facility can be obtained from one of a variety of sources; however, water is typically sourced from an adjacent river, when possible. The Advanced Pulverized Coal Facility uses a water treatment system and a high-efficiency reverse osmosis system to reduce the dissolved solids from the cooling water and to provide distilled water for boiler makeup. Wastewater is sent to an adjacent river or other approved alternative. Further, the electrical interconnection from the Advanced Pulverized Coal on-site switchyard is effectuated by a connection to an adjacent utility substation, assumed to be no more than 1 mile from the Advanced Pulverized Coal Facility. 3-2
  • 41.
    3.4 CAPITAL COSTESTIMATE The base Cost Estimate for the Advanced Pulverized Coal Facility (“APC”) with a nominal capacity of 650 MW is $3,167/kilowatt (“kW”) and with a nominal capacity of 1,300 MW is $2,844/kW. Table 3-1 and Table 3-2 summarize the Cost Estimate categories for the APC Facility. TABLE 3-1 – BASE PLANT SITE CAPITAL COST ESTIMATE FOR APC Technology: APC Nominal Capacity (ISO): 650,000 kW Nominal Heat Rate (ISO): 8,800 Btu/kWh-HHV Capital Cost Category (000s) (October 1, 2010$) Civil Structural Material and Installation 224,000 Mechanical Equipment Supply and Installation 838,500 Electrical / I&C Supply and Installation 123,000 Project Indirects (1) 350,000 EPC Cost before Contingency and Fee 1,535,500 Fee and Contingency 180,000 Total Project EPC 1,715,500 Owner's Costs (excluding project finance) 343,100 Total Project Cost (excluding finance) 2,058,600 Total Project EPC $ / kW 2,639 Owner Costs 20% (excluding project finance) $ / kW 528 Total Project Cost (excluding project finance) $ / kW 3,167 (1) Includes engineering, distributable costs, scaffolding, construction management, and start-up. 3-3
  • 42.
    TABLE 3-2 –BASE PLANT SITE CAPITAL COST ESTIMATE FOR APC Technology: APC Nominal Capacity (ISO): 1,300,000 kW Nominal Heat Rate (ISO): 8,800 Btu/kWh-HHV Capital Cost Category (000s) (October 1, 2010$) Civil Structural Material and Installation 397,250 Mechanical Equipment Supply and Installation 1,596,100 Electrical / I&C Supply and Installation 235,000 Project Indirects (1) 584,750 EPC Cost before Contingency and Fee 2,813,100 Fee and Contingency 320,000 Total Project EPC 3,133,100 Owner Costs (excluding project finance) 563,958 Total Project Cost (excluding finance) 3,697,058 Total Project EPC $ / kW 2,410 Owner Costs 18% (excluding project finance) $ / kW 434 Total Project Cost (excluding project finance) $ / kW 2,844 (1) Includes engineering, distributable costs, scaffolding, construction management, and start-up. For this type of technology and power plant configuration, our regional adjustments took into consideration the following: outdoor installation considerations, seismic design differences, remote location issues, labor wage and productivity differences, location adjustments, owner cost differences, and the increase in overheads associated with these six adjustment criteria. Outdoor installation locations are considered in geographic areas where enclosed structures for the boilers would not be required due to the low probability of freezing. The locations that were included in outdoor installation are Alabama, Arizona, Arkansas, Florida, Georgia, Hawaii, Louisiana, Mississippi, New Mexico, South Carolina, and Puerto Rico. Seismic design differences among the various locations were based on U.S. seismic map information that detailed the various seismic zones throughout the U.S. No cost increases were associated with seismic Zone 0 and cost step increases were considered for Zones 1, 2, 3 and 4. 3-4
  • 43.
    Remote location issuesare related to geographic areas that typically require installation of man camps, higher craft incentives, and higher per diems are generally required with respect to construction, due to the fact that such areas are long distances from urban areas, where labor is generally abundant. Remote location designations were also considered in locations where higher equipment freight costs are typically incurred, which for example are regions not near established rail or highway access. Remote locations related to the APC Facility include Fairbanks, Alaska; Honolulu, Hawaii; Albuquerque, New Mexico; Cheyenne, Wyoming; and Cayey, Puerto Rico. Labor wage and productivity differences were handled as discussed in Section 1.5.1, taking into consideration the amount of labor we estimated for the APC Facility. Location adjustments were made to locations where higher cost of living levels are incurred and/or where population density generally correlates to higher construction costs for power and other infrastructure projects. These locations include Alaska, California, Connecticut, Delaware, District of Columbia, Hawaii, Illinois, Maine, Maryland, Massachusetts, Michigan, Minnesota, New York, Ohio; and Wisconsin. Owner costs were reviewed based on the need for utility upgrades and/or infrastructure costs such as new facility transmission lines to tie to existing utility transmission substations or existing transmission lines. Table 3-3 and Table 3-4 show the APC capital cost variations for alternative U.S. plant locations, including the difference between the given location and the average location specified for the Cost Estimate. TABLE 3-3 – LOCATION-BASED COSTS FOR APC (650,000 KW) (OCTOBER 1, 2010 DOLLARS) Base Project Location Delta Cost Total Location Cost Percent Difference Project Cost State City ($/kW) Variation ($/kW) ($/kW) Alaska Anchorage 3,200 33.1% 1,058 4,258 Alaska Fairbanks 3,200 32.0% 1,026 4,226 Alabama Huntsville 3,200 -7.5% (239) 2,961 Arizona Phoenix 3,200 -5.2% (166) 3,034 Arkansas Little Rock 3,200 -6.2% (200) 3,000 California Los Angeles 3,200 20.3% 649 3,849 California Redding 3,200 9.8% 314 3,514 California Bakersfield 3,200 9.4% 300 3,500 California Sacramento 3,200 14.4% 462 3,662 California San Francisco 3,200 42.4% 1,356 4,556 Colorado Denver 3,200 -6.1% (194) 3,006 Connecticut Hartford 3,200 26.6% 851 4,051 Delaware Dover 3,200 23.0% 736 3,936 District of Columbia Washington 3,200 39.6% 1,267 4,467 Florida Tallahassee 3,200 -10.9% (349) 2,851 Florida Tampa 3,200 -4.9% (156) 3,044 Georgia Atlanta 3,200 -8.1% (260) 2,940 Hawaii Honolulu 3,200 69.0% 2,210 5,410 Idaho Boise 3,200 -3.7% (118) 3,082 Illinois Chicago 3,200 19.8% 635 3,835 Indiana Indianapolis 3,200 3.2% 102 3,302 3-5
  • 44.
    Base Project Location Delta Cost Total Location Cost Percent Difference Project Cost State City ($/kW) Variation ($/kW) ($/kW) Iowa Davenport 3,200 -1.6% (50) 3,150 Iowa Waterloo 3,200 -9.0% (288) 2,912 Kansas Wichita 3,200 -7.5% (241) 2,959 Kentucky Louisville 3,200 -5.6% (178) 3,022 Louisiana New Orleans 3,200 -11.2% (359) 2,841 Maine Portland 3,200 -1.5% (47) 3,153 Maryland Baltimore 3,200 4.6% 148 3,348 Massachusetts Boston 3,200 35.3% 1,128 4,328 Michigan Detroit 3,200 3.8% 123 3,323 Michigan Grand Rapids 3,200 -7.9% (251) 2,949 Minnesota St. Paul 3,200 3.9% 125 3,325 Mississippi Jackson 3,200 -7.4% (238) 2,962 Missouri St. Louis 3,200 7.2% 231 3,431 Missouri Kansas City 3,200 3.4% 109 3,309 Montana Great Falls 3,200 -4.3% (137) 3,063 Nebraska Omaha 3,200 -3.5% (113) 3,087 New Hampshire Concord 3,200 -1.6% (52) 3,148 New Jersey Newark 3,200 15.5% 495 3,695 New Mexico Albuquerque 3,200 -3.9% (125) 3,075 New York New York 3,200 32.6% 1,044 4,244 New York Syracuse 3,200 10.7% 342 3,542 Nevada Las Vegas 3,200 9.2% 295 3,495 North Carolina Charlotte 3,200 -11.2% (360) 2,840 North Dakota Bismarck 3,200 -8.0% (255) 2,945 Ohio Cincinnati 3,200 0.3% 11 3,211 Oregon Portland 3,200 9.5% 305 3,505 Pennsylvania Philadelphia 3,200 12.1% 387 3,587 Pennsylvania Wilkes-Barre 3,200 -3.5% (112) 3,088 Rhode Island Providence 3,200 4.1% 132 3,332 South Carolina Spartanburg 3,200 -11.8% (377) 2,823 South Dakota Rapid City 3,200 -10.7% (342) 2,858 Tennessee Knoxville 3,200 -8.9% (286) 2,914 Texas Houston 3,200 -9.5% (304) 2,896 Utah Salt Lake City 3,200 -3.1% (98) 3,102 Vermont Burlington 3,200 -5.3% (169) 3,031 Virginia Alexandria 3,200 9.7% 310 3,510 Virginia Lynchburg 3,200 -2.0% (62) 3,138 Washington Seattle 3,200 12.8% 409 3,609 Washington Spokane 3,200 -2.3% (74) 3,126 West Virginia Charleston 3,200 -1.8% (58) 3,142 Wisconsin Green Bay 3,200 0.5% 16 3,216 Wyoming Cheyenne 3,200 3.9% 125 3,325 Puerto Rico Cayey 0 0 0 0 3-6
  • 45.
    TABLE 3-4 –LOCATION-BASED COSTS FOR APC (1,300,000 KW) (OCTOBER 1, 2010 DOLLARS) Base Project Location Delta Cost Total Location Cost Percent Difference Project Cost State City ($/kW) Variation ($/kW) ($/kW) Alaska Anchorage 2,850 36.5% 1,040 3,890 Alaska Fairbanks 2,850 35.3% 1,006 3,856 Alabama Huntsville 2,850 -8.2% (233) 2,617 Arizona Phoenix 2,850 -5.7% (161) 2,689 Arkansas Little Rock 2,850 -5.9% (169) 2,681 California Los Angeles 2,850 22.4% 638 3,488 California Redding 2,850 10.7% 306 3,156 California Bakersfield 2,850 10.3% 293 3,143 California Sacramento 2,850 15.7% 447 3,297 California San Francisco 2,850 46.7% 1,330 4,180 Colorado Denver 2,850 -6.6% (188) 2,662 Connecticut Hartford 2,850 29.4% 838 3,688 Delaware Dover 2,850 25.5% 728 3,578 District of Columbia Washington 2,850 44.4% 1,265 4,115 Florida Tallahassee 2,850 -11.9% (339) 2,511 Florida Tampa 2,850 -5.4% (154) 2,696 Georgia Atlanta 2,850 -8.9% (253) 2,597 Hawaii Honolulu 0 0 0 0 Idaho Boise 2,850 -4.0% (115) 2,735 Illinois Chicago 2,850 21.3% 606 3,456 Indiana Indianapolis 2,850 3.5% 99 2,949 Iowa Davenport 2,850 -1.8% (53) 2,797 Iowa Waterloo 2,850 -9.8% (280) 2,570 Kansas Wichita 2,850 -7.3% (209) 2,641 Kentucky Louisville 2,850 -6.1% (173) 2,677 Louisiana New Orleans 2,850 -12.2% (348) 2,502 Maine Portland 2,850 -0.6% (16) 2,834 Maryland Baltimore 2,850 5.3% 150 3,000 Massachusetts Boston 2,850 38.7% 1,103 3,953 Michigan Detroit 2,850 4.0% 114 2,964 Michigan Grand Rapids 2,850 -8.6% (244) 2,606 Minnesota St. Paul 2,850 4.1% 116 2,966 Mississippi Jackson 2,850 -8.1% (231) 2,619 Missouri St. Louis 2,850 7.7% 221 3,071 Missouri Kansas City 2,850 3.5% 101 2,951 Montana Great Falls 2,850 -4.7% (133) 2,717 Nebraska Omaha 2,850 -3.9% (111) 2,739 New Hampshire Concord 2,850 -1.8% (52) 2,798 New Jersey Newark 2,850 16.4% 467 3,317 New Mexico Albuquerque 2,850 -4.3% (122) 2,728 New York New York 2,850 34.8% 992 3,842 New York Syracuse 2,850 12.0% 341 3,191 Nevada Las Vegas 2,850 9.9% 282 3,132 North Carolina Charlotte 2,850 -10.4% (296) 2,554 North Dakota Bismarck 2,850 -8.7% (248) 2,602 Ohio Cincinnati 2,850 0.5% 13 2,863 Oregon Portland 2,850 10.4% 297 3,147 Pennsylvania Philadelphia 2,850 12.9% 366 3,216 Pennsylvania Wilkes-Barre 2,850 -3.8% (109) 2,741 3-7
  • 46.
    Base Project Location Delta Cost Total Location Cost Percent Difference Project Cost State City ($/kW) Variation ($/kW) ($/kW) Rhode Island Providence 2,850 4.3% 123 2,973 South Carolina Spartanburg 2,850 -12.7% (363) 2,487 South Dakota Rapid City 2,850 -11.6% (331) 2,519 Tennessee Knoxville 2,850 -9.7% (276) 2,574 Texas Houston 2,850 -10.3% (295) 2,555 Utah Salt Lake City 2,850 -3.3% (93) 2,757 Vermont Burlington 2,850 -5.8% (164) 2,686 Virginia Alexandria 2,850 10.9% 310 3,160 Virginia Lynchburg 2,850 -2.0% (57) 2,793 Washington Seattle 2,850 13.9% 397 3,247 Washington Spokane 2,850 -2.6% (73) 2,777 West Virginia Charleston 2,850 -2.1% (59) 2,791 Wisconsin Green Bay 2,850 0.6% 16 2,866 Wyoming Cheyenne 2,850 4.6% 131 2,981 Puerto Rico Cayey 0 0 0 0 3.5 O&M ESTIMATE In addition to the general O&M items discussed in Section 2.5.2., the APC Facility includes the major maintenance for boiler, ST, associated generator, BOP, and emissions reduction catalysts. These major maintenance expenses are included with the VOM expense for this technology and are given on an average basis across the megawatt-hours (“MWh”) incurred. Typically, significant overhauls on an APC Facility occur no less frequently than six or seven years. Table 3-5 presents the FOM and VOM expenses for the APC Facility. Table 3-5 and Table 3-6 present the O&M expenses for the APC Facility. TABLE 3-5 – O&M EXPENSES FOR APC (650,000 KW) Technology: APC Fixed O&M Expense $35.97/kW-year Variable O&M Expense $4.25/MWh TABLE 3-6 – O&M EXPENSES FOR APC (1,300,000 KW) Technology: APC Fixed O&M Expense $29.67/kW-year Variable O&M Expense $4.25/MWh 3.6 ENVIRONMENTAL COMPLIANCE INFORMATION As mentioned in Section 3.1, the APC Facility is assumed to include low NOX combustion burners in the boiler, SCR, and a flue gas desulfurization (“FGD”) to further control the emissions of NOX and SO2, respectively. Table 3-7 presents the environmental emissions for the APC Facility. 3-8
  • 47.
    TABLE 3-7 –ENVIRONMENTAL EMISSIONS FOR APC Technology: APC NOX 0.06 lb/MMBtu SO2 0.1 lb/MMBtu CO2 206 lb/MMBtu 3-9
  • 48.
    4. ADVANCED PULVERIZED COAL WITH CCS (APC/CCS) 4.1 MECHANICAL EQUIPMENT AND SYSTEMS The plant configuration for the APC with CCS Facility (“APC/CCS”) is the same as the APC case with two exceptions: (1) an amine scrubbing system, utilizing monoethanolamine (“MEA”) as a solvent, to capture CO2 from the flue gas, and (2) the scaling of the boiler to a larger size, as described below. The captured CO2 is compressed to approximately 2,000 psia for injection into a pipeline at the plant fence line as a supercritical fluid. The net output of the APC/CCS Facility case is 650 MW (and 1,300 MW for the two unit configuration), and since the CCS system requires about one-third of the given facility’s gross capacity in auxiliary load, the APC/CCS Facility assumes that the boiler is increased by approximately one-third (i.e., it is approximately 133 percent the size of the boiler in the APC Facility), which provides the necessary steam to facilitate the capture process and to run a steam-driven compressor for compressing the CO2 for sequestration. Figure 4-1 presents a diagram of the APC and Figure 4-2 presents a diagram of the APC/CCS Facility. FIGURE 4-1 – APC FACILITY DIAGRAM 4-1
  • 49.
    FIGURE 4-2 –APC/CCS FACILITY DIAGRAM 4.2 ELECTRICAL AND CONTROL SYSTEMS The electrical and control systems for the APC/CCS Facility are materially similar to the APC Facility. 4.3 OFF-SITE REQUIREMENTS The off-site requirements for the APC/CCS Facility are materially similar to the APC Facility, except that the CO2 needs sequestering in one of the following geologic formations: (1) exhausted gas storage location, (2) unminable coal seam, (3) enhanced oil recovery, or (4) saline aquifer. To the extent that a sequestration site is not near the given facility being analyzed, transportation for a viable sequestration site has the potential to materially affect the capital cost estimates discussed below. 4.4 CAPITAL COST ESTIMATE The base Cost Estimate for the APC/CCS Facility with a nominal capacity of 650 MW is $5,099/kW and with a nominal capacity of 1,300,000 MW is $4,579/kW. The capital cost estimate was based on the advanced pulverized APC Facility (without CCS) and the base Cost Estimate was increased to include the expected costs of CCS. Since there are currently no full- scale pulverized coal facilities operating with CCS in the world, our estimate is based on industry research. Our team tested the veracity of this research against assumptions for implementing the additional equipment necessary to effectuate CCS on an advanced coal facility. Table 4-1 and Table 4-2 summarize the Cost Estimate categories for the APC/CCS Facility. 4-2
  • 50.
    TABLE 4-1 –BASE PLANT SITE CAPITAL COST ESTIMATE FOR APC/CCS Technology: APC/CCS Nominal Capacity (ISO): 650,000 kW Nominal Heat Rate (ISO): 12,000 Btu/kWh-HHV Capital Cost Category (000s) (October 1, 2010$) Total Project EPC 2,761,958 Owner Costs (excluding project finance) 552,391 Total Project Cost (excluding finance) 3,314,350 Total Project EPC / kW 4,249 Owner Costs 20% (excluding project finance) / kW 850 Total Project Cost (excluding project finance) / kW 5,099 (1) Includes engineering, distributable costs, scaffolding, construction management, and start-up. TABLE 4-2 – BASE PLANT SITE CAPITAL COST ESTIMATE FOR APC/CCS Technology: APC/CCS Nominal Capacity (ISO): 1,300,000 kW Nominal Heat Rate (ISO): 12,000 Btu/kWh-HHV Capital Cost Category (000s) (October 1, 2010$) Total Project EPC 5,045,763 Owner Costs (excluding project finance) 908,237 Total Project Cost (excluding finance) 5,954,000 Total Project EPC / kW 3,881 Owner Costs 18% (excluding project finance) / kW 699 Total Project Cost (excluding project finance) / kW 4,579 (1) Includes engineering, distributable costs, scaffolding, construction management, and start-up. For this type of technology and power plant configuration, our regional adjustments took into consideration the following: outdoor installation considerations, seismic design differences, remote location issues, labor wage and productivity differences, location adjustments, owner cost differences, and the increase in overheads associated with these six adjustment criteria. The 4-3
  • 51.
    methodology used forthe APC/CCS Facility is the same as that discussed in Section 3.4 for the APC Facility (without CCS). Table 4-3 and Table 4-4 show the APC capital cost variations for alternative U.S. plant locations, including the difference between the given location and the average location specified for the Cost Estimate. TABLE 4-3– LOCATION-BASED COSTS FOR APC/CCS FACILITY (650,000 KW) (OCTOBER 1, 2010 DOLLARS) Base Project Location Delta Cost Total Location Cost Percent Difference Project Cost State City ($/kW) Variation ($/kW) ($/kW) Alaska Anchorage 5,100 32.2% 1,643 6,743 Alaska Fairbanks 5,100 31.4% 1,602 6,702 Alabama Huntsville 5,100 -8.0% (409) 4,691 Arizona Phoenix 5,100 -5.7% (289) 4,811 Arkansas Little Rock 5,100 -6.7% (342) 4,797 California Los Angeles 5,100 19.6% 1,000 6,100 California Redding 5,100 9.4% 481 5,581 California Bakersfield 5,100 9.0% 458 5,558 California Sacramento 5,100 14.4% 734 5,834 California San Francisco 5,100 41.6% 2,124 7,224 Colorado Denver 5,100 -6.6% (335) 4,765 Connecticut Hartford 5,100 25.6% 1,306 6,406 Delaware Dover 5,100 21.9% 1,116 6,216 District of Columbia Washington 5,100 37.0% 1,888 6,988 Florida Tallahassee 5,100 -11.6% (591) 4,509 Florida Tampa 5,100 -5.1% (262) 4,838 Georgia Atlanta 5,100 -8.7% (445) 4,655 Hawaii Honolulu 5,100 65.6% 3,347 8,447 Idaho Boise 5,100 -4.1% (211) 4,889 Illinois Chicago 5,100 20.7% 1,055 6,155 Indiana Indianapolis 5,100 2.8% 141 5,241 Iowa Davenport 5,100 -1.7% (85) 5,015 Iowa Waterloo 5,100 -9.6% (491) 4,609 Kansas Wichita 5,100 -8.1% (411) 4,728 Kentucky Louisville 5,100 -6.1% (309) 4,791 Louisiana New Orleans 5,100 -11.9% (608) 4,492 Maine Portland 5,100 -2.2% (111) 5,028 Maryland Baltimore 5,100 3.8% 195 5,295 Massachusetts Boston 5,100 34.9% 1,779 6,879 Michigan Detroit 5,100 4.0% 204 5,304 Michigan Grand Rapids 5,100 -8.4% (428) 4,672 Minnesota St. Paul 5,100 4.0% 206 5,306 Mississippi Jackson 5,100 -8.0% (406) 4,694 Missouri St. Louis 5,100 7.2% 366 5,466 4-4
  • 52.
    Base Project Location Delta Cost Total Location Cost Percent Difference Project Cost State City ($/kW) Variation ($/kW) ($/kW) Missouri Kansas City 5,100 3.4% 174 5,274 Montana Great Falls 5,100 -4.8% (244) 4,856 Nebraska Omaha 5,100 -3.9% (197) 4,903 New Hampshire Concord 5,100 -2.0% (100) 5,000 New Jersey Newark 5,100 16.4% 837 5,937 New Mexico Albuquerque 5,100 -4.4% (222) 4,878 New York New York 5,100 34.7% 1,768 6,868 New York Syracuse 5,100 8.5% 433 5,533 Nevada Las Vegas 5,100 7.5% 382 5,482 North Carolina Charlotte 5,100 -12.0% (612) 4,566 North Dakota Bismarck 5,100 -8.5% (434) 4,666 Ohio Cincinnati 5,100 -0.3% (13) 5,087 Oregon Portland 5,100 9.1% 466 5,566 Pennsylvania Philadelphia 5,100 12.7% 649 5,749 Pennsylvania Wilkes-Barre 5,100 -3.9% (201) 4,899 Rhode Island Providence 5,100 4.2% 214 5,314 South Carolina Spartanburg 5,100 -12.7% (649) 4,451 South Dakota Rapid City 5,100 -11.4% (583) 4,517 Tennessee Knoxville 5,100 -9.6% (492) 4,608 Texas Houston 5,100 -10.2% (518) 4,582 Utah Salt Lake City 5,100 -3.8% (194) 4,906 Vermont Burlington 5,100 -5.9% (299) 4,801 Virginia Alexandria 5,100 8.7% 443 5,543 Virginia Lynchburg 5,100 -2.7% (138) 4,962 Washington Seattle 5,100 12.6% 644 5,744 Washington Spokane 5,100 -2.7% (136) 4,964 West Virginia Charleston 5,100 -2.0% (103) 4,997 Wisconsin Green Bay 5,100 0.0% 0 5,100 Wyoming Cheyenne 5,100 1.4% 74 5,174 Puerto Rico Cayey 0 0 0 0 4-5
  • 53.
    TABLE 4-4 –LOCATION-BASED COSTS FOR APC/CCS FACILITY (1,300,000 KW) (OCTOBER 1, 2010 DOLLARS) Base Project Location Delta Cost Total Location Cost Percent Difference Project Cost State City ($/kW) Variation ($/kW) ($/kW) Alaska Anchorage 4,580 35.2% 1,610 6,190 Alaska Fairbanks 4,580 34.2% 1,565 6,145 Alabama Huntsville 4,580 -8.3% (380) 4,200 Arizona Phoenix 4,580 -5.8% (266) 4,314 Arkansas Little Rock 4,580 -6.1% (278) 4,302 California Los Angeles 4,580 21.5% 985 5,565 California Redding 4,580 10.4% 475 5,055 California Bakersfield 4,580 9.9% 453 5,033 California Sacramento 4,580 15.5% 710 5,290 California San Francisco 4,580 45.2% 2,071 6,651 Colorado Denver 4,580 -6.7% (309) 4,271 Connecticut Hartford 4,580 28.1% 1,288 5,868 Delaware Dover 4,580 24.2% 1,109 5,689 District of Columbia Washington 4,580 41.4% 1,895 6,475 Florida Tallahassee 4,580 -12.1% (552) 4,028 Florida Tampa 4,580 -5.4% (245) 4,335 Georgia Atlanta 4,580 -9.0% (413) 4,167 Hawaii Honolulu 0 0 0 0 Idaho Boise 4,580 -4.2% (191) 4,389 Illinois Chicago 4,580 21.7% 995 5,575 Indiana Indianapolis 4,580 3.2% 148 4,728 Iowa Davenport 4,580 -1.7% (79) 4,501 Iowa Waterloo 4,580 -10.0% (457) 4,123 Kansas Wichita 4,580 -7.5% (343) 4,237 Kentucky Louisville 4,580 -6.2% (284) 4,296 Louisiana New Orleans 4,580 -12.4% (567) 4,013 Maine Portland 4,580 -1.1% (48) 4,532 Maryland Baltimore 4,580 4.6% 211 4,791 Massachusetts Boston 4,580 37.7% 1,728 6,308 Michigan Detroit 4,580 4.2% 193 4,773 Michigan Grand Rapids 4,580 -8.7% (398) 4,182 Minnesota St. Paul 4,580 4.3% 195 4,775 Mississippi Jackson 4,580 -8.2% (377) 4,203 Missouri St. Louis 4,580 7.7% 354 4,934 Missouri Kansas City 4,580 3.7% 168 4,748 Montana Great Falls 4,580 -4.8% (222) 4,358 Nebraska Omaha 4,580 -3.9% (180) 4,400 New Hampshire Concord 4,580 -1.9% (87) 4,493 New Jersey Newark 4,580 17.1% 781 5,361 4-6
  • 54.
    Base Project Location Delta Cost Total Location Cost Percent Difference Project Cost State City ($/kW) Variation ($/kW) ($/kW) New Mexico Albuquerque 4,580 -4.4% (202) 4,378 New York New York 4,580 36.0% 1,650 6,230 New York Syracuse 4,580 9.7% 442 5,022 Nevada Las Vegas 4,580 7.9% 361 4,941 North Carolina Charlotte 4,580 -10.7% (492) 4,088 North Dakota Bismarck 4,580 -8.8% (404) 4,176 Ohio Cincinnati 4,580 0.1% 4 4,584 Oregon Portland 4,580 10.1% 461 5,041 Pennsylvania Philadelphia 4,580 13.3% 609 5,189 Pennsylvania Wilkes-Barre 4,580 -4.0% (182) 4,398 Rhode Island Providence 4,580 4.5% 205 4,785 South Carolina Spartanburg 4,580 -13.1% (600) 3,980 South Dakota Rapid City 4,580 -11.8% (542) 4,038 Tennessee Knoxville 4,580 -9.9% (455) 4,125 Texas Houston 4,580 -10.5% (482) 4,098 Utah Salt Lake City 4,580 -3.6% (167) 4,413 Vermont Burlington 4,580 -6.0% (273) 4,307 Virginia Alexandria 4,580 9.9% 455 5,035 Virginia Lynchburg 4,580 -2.4% (112) 4,468 Washington Seattle 4,580 13.7% 626 5,206 Washington Spokane 4,580 -2.6% (121) 4,459 West Virginia Charleston 4,580 -2.0% (93) 4,487 Wisconsin Green Bay 4,580 0.3% 14 4,594 Wyoming Cheyenne 4,580 2.2% 102 4,682 Puerto Rico Cayey 0 0 0 0 4.5 O&M ESTIMATE The O&M items for the APC/CCS Facility are the same as those discussed in Section 3.5 for the APC Facility (without CCS), except that adders are included to both FOM and VOM to accommodate the expenses associated with compressor maintenance, sequestration maintenance, and the associated additional labor required to manage, operate, and maintain the additional equipment. Table 4-5 and Table 4-6 present the FOM and VOM expenses for the APC/CCS Facility. TABLE 4-5 – O&M EXPENSES FOR APC/CCS (650,000 KW) Technology: APC/CCS Fixed O&M Expense $76.62/kW-year Variable O&M Expense $9.05/MWh 4-7
  • 55.
    TABLE 4-6 –O&M EXPENSES FOR APC/CCS (1,300,000 KW) Technology: APC/CCS Fixed O&M Expense $63.21/kW-year Variable O&M Expense $9.05/MWh 4.6 ENVIRONMENTAL COMPLIANCE INFORMATION In addition to the equipment utilized for environmental compliance in the APC Facility, the APC/CCS Facility includes an amine scrubber that is intended to remove 90 percent of the CO2 produced in the combustion process, wherein the captured CO2 is later compressed to HP and sequestered, as discussed above. Table 4-7 presents the environmental emissions for the APC/CCS Facility. TABLE 4-7 – ENVIRONMENTAL EMISSIONS FOR APC/CCS Technology: APC/CCS NOX 0.06 lb/MMBtu SO2 0.02 lb/MMBtu CO2 20.6 lb/MMBtu 4-8
  • 56.
    5. CONVENTIONAL NATURAL GAS COMBINED CYCLE (NGCC) 5.1 MECHANICAL EQUIPMENT AND SYSTEMS The Conventional NGCC produces 540 MW of net electricity. The facility utilizes two natural gas-fueled F-class CTs and associated electric generators, two supplemental-fired heat recovery steam generators (“HRSG”), and one condensing ST and associated electric generator operating in combined-cycle mode. Each CT is designed to produce nominally 172 MW and includes a dry-low NOX (“DLN”) combustion system and a hydrogen-cooled electric generator. The two triple-pressure HRSGs include integrated deaerators, SCRs, oxidation catalyst for the control of carbon monoxide (“CO”), and supplemental duct firing with associated combustion management. The ST is a single-reheat condensing ST designed for variable pressure operation, designed to produce an additional 210 MW. The ST exhaust is cooled in a closed-loop condenser system with a mechanical draft cooling tower. The CTs are equipped with inlet evaporative coolers to reduce the temperature of the turbine inlet air to increase summer output. The Conventional NGCC plant also includes a raw water treatment system consisting of clarifiers and filters and a turbine hall, in which the CTs, ST, and HRSGs are enclosed to avoid freezing during periods of cold ambient temperatures. Figure 5-1 presents the Conventional NGCC process flow diagram. 5-1
  • 57.
    FIGURE 5-1 –CONVENTIONAL NGCC DESIGN CONFIGURATION 5.2 ELECTRICAL AND CONTROL SYSTEMS The Conventional NGCC has two CT electric generators and one ST electric generator. The generators for the CTs are 60 Hz and rated at approximately 215 MVA with an output voltage of 18 kV. The ST electric generator is 60 Hz and rated at approximately 310 MVA with an output voltage of 18 kV. Each CT and ST electric generator is connected to a high-voltage bus in the Conventional NGCC via a dedicated generator circuit breaker, generator GSU, and a disconnect switch. The GSUs increase the voltage from the electric generators from 18 kV to interconnected high voltage. The Conventional NGCC is controlled using a DCS. The DCS provides centralized control of the facility by integrating the control systems provided with each individual CT and associated electric generator, ST and associated electric generator, and the control of BOP systems and equipment. 5.3 OFF-SITE REQUIREMENTS Natural gas is delivered to the facility through a lateral connected to the local natural gas trunk line. Water for all processes at the Conventional NGCC Facility is obtained from a one of several available water sources (e.g., municipal water supply). The Conventional NGCC Facility 5-2
  • 58.
    uses a watertreatment system and a high-efficiency reverse osmosis system to reduce the dissolved solids from the cooling water and to provide distilled water for HRSG makeup. Wastewater is sent to a municipal wastewater system. Further, the electrical interconnection from the Conventional NGCC on-site switchyard is effectuated by a connection to an adjacent utility substation. 5.4 CAPITAL COST ESTIMATE The base Cost Estimate for the Conventional NGCC Facility with a nominal capacity of 540 MW is $980/kW. Table 5-1 summarizes the Cost Estimate categories for the Conventional NGCC Facility. TABLE 5-1 – BASE PLANT SITE CAPITAL COST ESTIMATE FOR CONVENTIONAL NGCC Technology: Conventional NGCC Nominal Capacity (ISO): 540,000 kW Nominal Heat Rate (ISO): 7,050 Btu/kWh-HHV Capital Cost Category (000s) (October 1, 2010$) Civil Structural Material and Installation 40,100 Mechanical Equipment Supply and Installation 221,500 Electrical / I&C Supply and Installation 35,000 Project Indirects (1) 88,400 EPC Cost before Contingency and Fee 385,000 Fee and Contingency 55,000 Total Project EPC 440,000 Owner Costs (excluding project finance) 88,000 Total Project Cost (excluding finance) 528,000 Total Project EPC / kW 815 Owner Costs 20% (excluding project finance) / kW 163 Total Project Cost (excluding project finance) / kW 978 (1) Includes engineering, distributable costs, scaffolding, construction management, and start-up. 5-3
  • 59.
    For this typeof technology and power plant configuration, our regional adjustments took into consideration the following: outdoor installation considerations, air-cooled condensers compared to cooling towers, seismic design differences, zero-water discharge issues, local technical enhancements (e.g., additional noise remediation that is generally required in urban siting), remote location issues, urban – high density population issues, labor wage and productivity differences, location adjustments, owner cost differences, and the increase in overheads associated with these 10 adjustments. Outdoor installation locations are considered in geographic areas where enclosed structures for the boilers would not be required due to the low probability of freezing. The locations that were included in outdoor installation are Alabama, Arizona, Arkansas, Florida, Georgia, Hawaii, Louisiana, Mississippi, New Mexico, South Carolina, and Puerto Rico. The potential locations relating to the use of air-cooled condensers in place of mechanical draft wet cooling towers were identified as Arizona, California, Connecticut, Delaware, District of Columbia, Maryland, Massachusetts, New Hampshire, New York, Oregon, Pennsylvania, Rhode Island, Virginia, and Puerto Rico. These locations are identified as those where conservation of water, notwithstanding supply, has been and/or is becoming a significant issue in plant permitting/siting. Seismic design differences among the various locations were based on U.S. seismic map information that detailed the various seismic zones throughout the U.S. No cost increases were associated with seismic Zone 0 and cost step increases were considered for Zones 1, 2, 3 and 4. The potential locations relating to the need of zero-water discharge were identified as Arizona, California, Colorado, Connecticut, Delaware, District of Columbia, Maryland, Massachusetts, New Hampshire, New York, Rhode Island, Virginia, and Puerto Rico. Similar to water usage discussed above in this section on Conventional NGCC, wastewater treatment and disposal is considered a critical permitting/siting issue in these areas. The locations with local technical enhancements include California, Colorado, Connecticut, Delaware, District of Columbia, Louisiana, Maryland, Massachusetts, New Jersey, New York, Rhode Island, Vermont, and Virginia. These areas are places where noise, visual impacts, and other technical enhancements generally need to be made by a project developer or utility to comply with the applicable permitting/siting requirements. Remote location issues are related to geographic areas that typically require installation of man camps, higher craft incentives, and higher per diems are generally required with respect to construction, due to the fact that such areas are long distances from urban areas, where labor is generally abundant. Remote location designations were also considered in locations where higher equipment freight costs are typically incurred, which for example are regions not near established rail or highway access. Remote locations related to the Conventional NGCC include Fairbanks, Alaska; Honolulu, Hawaii; Albuquerque, New Mexico; Cheyenne, Wyoming; and Cayey, Puerto Rico. Labor wage and productivity differences were handled as discussed in Section 2.5.1., taking into consideration the amount of labor we estimated for the Conventional NGCC Facility. Location adjustments were made to locations where higher cost of living levels are incurred and/or where population density generally correlates to higher construction costs for power and other infrastructure projects. These locations include Alaska, California, Connecticut, Delaware, 5-4
  • 60.
    District of Columbia,Hawaii, Illinois, Maine, Maryland, Massachusetts, Michigan, Minnesota, New York, Ohio, and Wisconsin. Owner costs were reviewed based on the need for utility upgrades and/or infrastructure costs such as new facility transmission lines to tie to existing utility transmission substations or existing transmission lines. Table 5-2 presents the Conventional NGCC capital cost variations for alternative U.S. plant locations, including the difference between the given location and the average location specified for the Cost Estimate. TABLE 5-2 – LOCATION-BASED COSTS FOR CONVENTIONAL NGCC (OCTOBER 1, 2010 DOLLARS) Base Project Location Delta Cost Total Location Cost Percent Difference Project Cost State City ($/kW) Variation ($/kW) ($/kW) Alaska Anchorage 980 33.3% 326 1,306 Alaska Fairbanks 980 38.2% 374 1,354 Alabama Huntsville 980 -8.6% (84) 896 Arizona Phoenix 980 2.6% 25 1,005 Arkansas Little Rock 980 -7.5% (73) 912 California Los Angeles 980 29.0% 284 1,264 California Redding 980 13.5% 132 1,112 California Bakersfield 980 15.8% 154 1,134 California Sacramento 980 20.5% 200 1,180 California San Francisco 980 46.1% 452 1,432 Colorado Denver 980 2.1% 21 1,001 Connecticut Hartford 980 27.9% 274 1,254 Delaware Dover 980 26.2% 256 1,236 District of Columbia Washington 980 33.3% 326 1,306 Florida Tallahassee 980 -11.6% (113) 867 Florida Tampa 980 -6.0% (58) 922 Georgia Atlanta 980 -6.6% (64) 916 Hawaii Honolulu 980 50.2% 492 1,472 Idaho Boise 980 -3.9% (38) 942 Illinois Chicago 980 16.7% 163 1,143 Indiana Indianapolis 980 0.9% 9 989 Iowa Davenport 980 0.5% 5 985 Iowa Waterloo 980 -6.4% (63) 917 Kansas Wichita 980 -5.0% (49) 936 Kentucky Louisville 980 -5.4% (53) 927 Louisiana New Orleans 980 -5.2% (51) 929 Maine Portland 980 -3.4% (33) 952 Maryland Baltimore 980 20.4% 200 1,180 Massachusetts Boston 980 40.0% 392 1,372 Michigan Detroit 980 5.3% 52 1,032 5-5
  • 61.
    Base Project Location Delta Cost Total Location Cost Percent Difference Project Cost State City ($/kW) Variation ($/kW) ($/kW) Michigan Grand Rapids 980 -5.3% (52) 928 Minnesota St. Paul 980 4.5% 44 1,024 Mississippi Jackson 980 -8.6% (84) 896 Missouri St. Louis 980 5.6% 55 1,035 Missouri Kansas City 980 2.7% 27 1,007 Montana Great Falls 980 -2.4% (24) 956 Nebraska Omaha 980 -1.5% (15) 965 New Hampshire Concord 980 7.3% 72 1,052 New Jersey Newark 980 22.1% 217 1,197 New Mexico Albuquerque 980 -2.4% (24) 956 New York New York 980 68.4% 670 1,650 New York Syracuse 980 16.3% 160 1,140 Nevada Las Vegas 980 6.2% 61 1,041 North Carolina Charlotte 980 -10.5% (102) 888 North Dakota Bismarck 980 -5.4% (53) 927 Ohio Cincinnati 980 -1.7% (17) 963 Oregon Portland 980 13.2% 130 1,110 Pennsylvania Philadelphia 980 26.1% 255 1,235 Pennsylvania Wilkes-Barre 980 -1.7% (17) 963 Rhode Island Providence 980 22.0% 215 1,195 South Carolina Spartanburg 980 -12.8% (126) 854 South Dakota Rapid City 980 -8.0% (78) 902 Tennessee Knoxville 980 -8.5% (84) 896 Texas Houston 980 -8.8% (87) 893 Utah Salt Lake City 980 -4.0% (39) 941 Vermont Burlington 980 -0.1% (1) 979 Virginia Alexandria 980 16.0% 157 1,137 Virginia Lynchburg 980 -5.8% (57) 923 Washington Seattle 980 7.0% 68 1,048 Washington Spokane 980 -2.6% (25) 955 West Virginia Charleston 980 0.1% 1 981 Wisconsin Green Bay 980 -1.3% (13) 967 Wyoming Cheyenne 980 -0.5% (4) 976 Puerto Rico Cayey 980 10.9% 106 1,086 5.5 O&M ESTIMATE In addition to the general O&M items discussed in Section 2.5.2., the Conventional NGCC Facility includes the major maintenance for the CTs, as well as the BOP, including the ST, associated electric generators, HRSGs, and emissions reduction catalysts. These major maintenance expenses are included with the VOM expense for this technology and are given on an average basis across the MWhs incurred. Typically, significant overhauls on a Conventional 5-6
  • 62.
    NGCC Facility occurno less frequently than 24,000 operating hour intervals. Table 5-3 presents the O&M expenses for the Conventional NGCC Facility. TABLE 5-3 – O&M EXPENSES FOR CONVENTIONAL NGCC Technology: Conventional NGCC Fixed O&M Expense $14.39/kW-year Variable O&M Expense $3.43/MWh 5.6 ENVIRONMENTAL COMPLIANCE INFORMATION The Conventional NGCC utilizes DLN combustion systems in the primary combustion zone of the CT and best available burner technology with respect to the duct burners in the HRSGs to manage the production of NOX and CO. Additional control of NOX and CO is accomplished through an SCR and an oxidization catalyst, respectively. Oxides of sulfur in the Conventional NGCC are managed through the natural gas fuel quality, which is generally very low in sulfur U.S. domestic pipeline quality natural gas, and consequently the low sulfur content translates into SO2 after combustion. The Conventional NGCC does not include any control devices for CO2, which is proportional the heat rate (inversely proportional to the efficiency) of the technology. Water, wastewater, and solid waste compliance are achieved through traditional on- site and off-site methods, and the costs for such compliance are included in the O&M estimate for the Conventional NGCC Facility. Table 5-4 presents environmental emissions for the Conventional NGCC Facility. TABLE 5-4 – ENVIRONMENTAL EMISSIONS FOR CONVENTIONAL NGCC Technology: Conventional NGCC NOX 0.0075 lb/MMBtu SO2 0.001 lb/MMBtu CO2 117 lb/MMBtu 5-7
  • 63.
    6. ADVANCED GENERATION NATURAL GAS COMBINED CYCLE (AG-NGCC) 6.1 MECHANICAL EQUIPMENT AND SYSTEMS The Advanced Generation (“AG”)-NGCC design is the same as the Conventional NGCC, except an H-class CT is utilized in lieu of F-class, and there is only one CT/HRSG supporting the ST included. Since the H-class CT design employees steam cooling of both stationary and rotational hot parts, the HRSG systems and the ST are both considered “advanced” designs, as compared to the Conventional NGCC. The net output of the AG-NGCC is 400 MW. Figure 6-1 presents the AG-NGCC process flow diagram. FIGURE 6-1 – AG-NGCC DESIGN CONFIGURATION 6.2 ELECTRICAL AND CONTROL SYSTEMS The AG-NGCC electrical and control systems are similar to the Conventional NGCC Facility, except that the sizing of the generators and transformers are larger to support the larger CT and ST equipment utilized in the AG-NGCC. 6.3 OFF-SITE REQUIREMENTS The off-site requirements for the AG-NGCC Facility are the same as the Conventional NGCC. Refer to Section 5.3 for the description of the Conventional NGCC off-site requirements. 6.4 CAPITAL COST ESTIMATE The base Cost Estimate for the AG-NGCC Facility with a nominal capacity of 400 MW is $1,003/kW. Table 6-1 summarizes the Cost Estimate categories for the Conventional NGCC Facility. 6-1
  • 64.
    TABLE 6-1 –BASE PLANT SITE CAPITAL COST ESTIMATE FOR AG-NGCC Technology: AG-NGCC Nominal Capacity (ISO): 400,000 kW Nominal Heat Rate (ISO): 6,430 Btu/kWh-HHV Capital Cost Category (000s) (October 1, 2010$) Civil Structural Material and Installation 20,610 Mechanical Equipment Supply and Installation 178,650 Electrical / I&C Supply and Installation 24,800 Project Indirects (1) 68,300 EPC Cost before Contingency and Fee 292,360 Fee and Contingency 42,000 Total Project EPC 334,360 Owner Costs (excluding project finance) 66,872 Total Project Cost (excluding finance) 401,232 Total Project EPC / kW 836 Owner Costs 20% (excluding project finance) / kW 167 Total Project Cost (excluding project finance) / kW 1,003 (1) Includes engineering, distributable costs, scaffolding, construction management, and start-up. The locational adjustments for the AG-NGCC Facility similar to those made for the Conventional NGCC Facility. Table 6-2 presents the AG-NGCC Facility capital cost variations for alternative U.S. plant locations, including the difference between the given location and the average location specified for the Cost Estimate. 6-2
  • 65.
    TABLE 6-2 –LOCATION-BASED COSTS FOR AG-NGCC (OCTOBER 1, 2010 DOLLARS) Base Project Location Delta Cost Total Location Cost Percent Difference Project Cost State City ($/kW) Variation ($/kW) ($/kW) Alaska Anchorage 1,005 32.4% 325 1,330 Alaska Fairbanks 1,005 37.2% 374 1,379 Alabama Huntsville 1,005 -8.3% (84) 921 Arizona Phoenix 1,005 2.6% 26 1,031 Arkansas Little Rock 1,005 -6.7% (67) 938 California Los Angeles 1,005 28.2% 283 1,288 California Redding 1,005 13.1% 132 1,137 California Bakersfield 1,005 15.4% 154 1,159 California Sacramento 1,005 19.9% 200 1,205 California San Francisco 1,005 44.9% 451 1,456 Colorado Denver 1,005 2.1% 21 1,026 Connecticut Hartford 1,005 27.2% 273 1,278 Delaware Dover 1,005 25.5% 256 1,261 District of Columbia Washington 1,005 32.5% 326 1,331 Florida Tallahassee 1,005 -11.2% (113) 892 Florida Tampa 1,005 -5.8% (58) 947 Georgia Atlanta 1,005 -6.3% (64) 941 Hawaii Honolulu 1,005 48.9% 492 1,497 Idaho Boise 1,005 -3.7% (38) 967 Illinois Chicago 1,005 16.1% 162 1,167 Indiana Indianapolis 1,005 0.9% 9 1,014 Iowa Davenport 1,005 0.5% 5 1,010 Iowa Waterloo 1,005 -6.2% (62) 943 Kansas Wichita 1,005 -4.3% (43) 962 Kentucky Louisville 1,005 -5.2% (52) 953 Louisiana New Orleans 1,005 -5.0% (50) 955 Maine Portland 1,005 -2.7% (27) 978 Maryland Baltimore 1,005 19.9% 200 1,205 Massachusetts Boston 1,005 38.9% 391 1,396 Michigan Detroit 1,005 5.2% 52 1,057 Michigan Grand Rapids 1,005 -5.1% (51) 954 Minnesota St. Paul 1,005 4.4% 44 1,049 Mississippi Jackson 1,005 -8.3% (83) 922 Missouri St. Louis 1,005 5.4% 54 1,059 Missouri Kansas City 1,005 2.6% 26 1,031 Montana Great Falls 1,005 -2.3% (24) 981 Nebraska Omaha 1,005 -1.4% (14) 991 New Hampshire Concord 1,005 7.2% 72 1,077 New Jersey Newark 1,005 21.4% 215 1,220 New Mexico Albuquerque 1,005 -2.3% (23) 982 6-3
  • 66.
    Base Project Location Delta Cost Total Location Cost Percent Difference Project Cost State City ($/kW) Variation ($/kW) ($/kW) New York New York 1,005 66.4% 667 1,672 New York Syracuse 1,005 15.9% 160 1,165 Nevada Las Vegas 1,005 6.0% 61 1,066 North Carolina Charlotte 1,005 -9.1% (91) 914 North Dakota Bismarck 1,005 -5.2% (52) 953 Ohio Cincinnati 1,005 -1.6% (16) 989 Oregon Portland 1,005 12.9% 130 1,135 Pennsylvania Philadelphia 1,005 25.3% 254 1,259 Pennsylvania Wilkes-Barre 1,005 -1.6% (16) 989 Rhode Island Providence 1,005 21.4% 215 1,220 South Carolina Spartanburg 1,005 -12.4% (125) 880 South Dakota Rapid City 1,005 -7.7% (77) 928 Tennessee Knoxville 1,005 -8.2% (83) 922 Texas Houston 1,005 -8.5% (86) 919 Utah Salt Lake City 1,005 -3.8% (38) 967 Vermont Burlington 1,005 0.0% (0) 1,005 Virginia Alexandria 1,005 15.6% 157 1,162 Virginia Lynchburg 1,005 -5.6% (56) 949 Washington Seattle 1,005 6.8% 68 1,073 Washington Spokane 1,005 -2.5% (25) 980 West Virginia Charleston 1,005 0.1% 1 1,006 Wisconsin Green Bay 1,005 -1.3% (13) 992 Wyoming Cheyenne 1,005 -0.4% (4) 1,001 Puerto Rico Cayey 1,005 10.6% 107 1,112 6.5 O&M ESTIMATE The O&M items for the AG-NGCC Facility are the same as those described in Section 5.5 for the Conventional NGCC Facility. Table 6-3 presents the O&M expenses for the AG-NGCC Facility. TABLE 6-3 – O&M EXPENSES FOR AG-NGCC Technology: AG-NGCC Fixed O&M Expense $14.62/kW-year Variable O&M Expense $3.11/MWh 6.6 ENVIRONMENTAL COMPLIANCE INFORMATION The environmental compliance strategy and equipment for the AG-NGCC Facility is the same as those described in Section 5.6 for the Conventional NGCC Facility. Table 6-4 presents environmental emissions for the AG-NGCC Facility. 6-4
  • 67.
    TABLE 6-4 –ENVIRONMENTAL EMISSIONS FOR AG-NGCC Technology: AG-NGCC NOX 0.0075 lb/MMBtu SO2 0.001 lb/MMBtu CO2 117 lb/MMBtu 6-5
  • 68.
    7. ADVANCED GENERATION NATURAL GAS COMBINED CYCLE WITH CCS (AG-NGCC/CCS) 7.1 MECHANICAL EQUIPMENT AND SYSTEMS The plant configuration for the AG-NGCC/CCS Facility is the same as the AG-NGCC Facility with the exception that an amine system based on MEA as the solvent is included for CO2 capture from the flue gas. The captured CO2 is compressed to approximately 2,000 psia for injection into a pipeline at the plant fence line. Figure 7-1 presents the AG-NGCC with CCS process flow diagram. FIGURE 7-1 – AG-NGCC WITH CCS DESIGN CONFIGURATION 7.2 ELECTRICAL AND CONTROL SYSTEMS The electrical and control systems for the AG-NGCC/CCS Facility are materially similar to the AG-NGCC Facility described in Section 6.2. 7.3 OFF-SITE REQUIREMENTS The off-site requirements for the AG-NGCC/CCS Facility are materially similar to the AG-NGCC Facility, except that the CO2 needs sequestering in one of the following geologic formations: (1) exhausted gas storage location, (2) unminable coal seam, (3) enhanced oil recovery, or (4) saline aquifer. To the extent that a sequestration site is not near the given facility being analyzed, transportation for a viable sequestration site has the potential to materially affect the capital cost estimates discussed below. 7.4 CAPITAL COST ESTIMATE The base Cost Estimate for the AG-NGCC/CCS Facility with a nominal capacity of 340 MW is $2,060/kW. The capital cost estimate was based on the AG-NGCC (without CCS) and the base cost estimate was increased to include the expected costs of CCS. Table 7-1 summarizes the Cost Estimate categories for the AG-NGCC/CCS Facility. 7-1
  • 69.
    TABLE 7-1 –BASE PLANT SITE CAPITAL COST ESTIMATE FOR AG-NGCC/CCS COST Technology: AG-NGCC/CCS Nominal Capacity (ISO): 340,000 kW Nominal Heat Rate (ISO): 7,525 Btu/kWh-HHV Total Project EPC 583,667 Owner Costs (excluding project finance) 116,733 Total Project Cost (excluding finance) 700,400 Total Project EPC / kW 1,717 Owner Costs 20% (excluding project finance) / kW 343 Total Project Cost (excluding project finance) / kW 2,060 (1) Includes engineering, distributable costs, scaffolding, construction management, and start-up. The locational adjustments for the AG-NGCC/CCS Facility are similar to those made for the Conventional NGCC Facility, described in Section 5.4. Table 7-2 presents the AG-NGCC/CCS Facility capital cost variations for alternative U.S. plant locations, including the difference between the given location and the average location specified for the Cost Estimate. 7-2
  • 70.
    TABLE 7-2 –LOCATION-BASED COSTS FOR AG-NGCC/CCS (OCTOBER 1, 2010 DOLLARS) Base Project Location Delta Cost Total Location Cost Percent Difference Project Cost State City ($/kW) Variation ($/kW) ($/kW) Alaska Anchorage 2,060 20.8% 428 2,488 Alaska Fairbanks 2,060 23.7% 488 2,548 Alabama Huntsville 2,060 -8.5% (174) 1,886 Arizona Phoenix 2,060 -2.3% (47) 2,013 Arkansas Little Rock 2,060 -7.0% (143) 1,917 California Los Angeles 2,060 16.1% 331 2,391 California Redding 2,060 7.4% 152 2,212 California Bakersfield 2,060 8.2% 169 2,229 California Sacramento 2,060 13.3% 274 2,334 California San Francisco 2,060 29.8% 615 2,675 Colorado Denver 2,060 -2.9% (60) 2,000 Connecticut Hartford 2,060 15.9% 328 2,388 Delaware Dover 2,060 13.5% 278 2,338 District of Columbia Washington 2,060 14.8% 305 2,365 Florida Tallahassee 2,060 -11.4% (234) 1,826 Florida Tampa 2,060 -5.3% (108) 1,952 Georgia Atlanta 2,060 -7.9% (162) 1,898 Hawaii Honolulu 2,060 26.8% 551 2,611 Idaho Boise 2,060 -4.9% (100) 1,960 Illinois Chicago 2,060 16.9% 348 2,408 Indiana Indianapolis 2,060 -0.5% (11) 2,049 Iowa Davenport 2,060 -0.6% (13) 2,047 Iowa Waterloo 2,060 -8.2% (168) 1,892 Kansas Wichita 2,060 -6.4% (132) 1,928 Kentucky Louisville 2,060 -6.2% (127) 1,933 Louisiana New Orleans 2,060 -8.5% (175) 1,885 Maine Portland 2,060 -4.9% (102) 1,958 Maryland Baltimore 2,060 7.3% 150 2,210 Massachusetts Boston 2,060 26.6% 547 2,607 Michigan Detroit 2,060 4.3% 88 2,148 Michigan Grand Rapids 2,060 -7.0% (144) 1,916 Minnesota St. Paul 2,060 3.7% 76 2,136 Mississippi Jackson 2,060 -8.4% (173) 1,887 Missouri St. Louis 2,060 4.4% 91 2,151 Missouri Kansas City 2,060 2.3% 47 2,107 Montana Great Falls 2,060 -4.5% (93) 1,967 Nebraska Omaha 2,060 -3.2% (65) 1,995 New Hampshire Concord 2,060 1.6% 34 2,094 New Jersey Newark 2,060 18.8% 388 2,448 New Mexico Albuquerque 2,060 -4.2% (86) 1,974 7-3
  • 71.
    Base Project Location Delta Cost Total Location Cost Percent Difference Project Cost State City ($/kW) Variation ($/kW) ($/kW) New York New York 2,060 50.1% 1,032 3,092 New York Syracuse 2,060 6.4% 133 2,193 Nevada Las Vegas 2,060 6.1% 126 2,186 North Carolina Charlotte 2,060 -10.8% (223) 1,837 North Dakota Bismarck 2,060 -7.1% (146) 1,914 Ohio Cincinnati 2,060 -3.4% (70) 1,990 Oregon Portland 2,060 7.1% 146 2,206 Pennsylvania Philadelphia 2,060 18.3% 378 2,438 Pennsylvania Wilkes-Barre 2,060 -3.7% (77) 1,983 Rhode Island Providence 2,060 11.9% 244 2,304 South Carolina Spartanburg 2,060 -13.4% (275) 1,785 South Dakota Rapid City 2,060 -9.8% (203) 1,857 Tennessee Knoxville 2,060 -9.6% (197) 1,863 Texas Houston 2,060 -9.6% (198) 1,862 Utah Salt Lake City 2,060 -5.9% (123) 1,937 Vermont Burlington 2,060 -4.0% (81) 1,979 Virginia Alexandria 2,060 5.7% 118 2,178 Virginia Lynchburg 2,060 -6.6% (137) 1,923 Washington Seattle 2,060 6.0% 123 2,183 Washington Spokane 2,060 -3.5% (71) 1,989 West Virginia Charleston 2,060 -1.4% (30) 2,030 Wisconsin Green Bay 2,060 -2.7% (55) 2,005 Wyoming Cheyenne 2,060 -4.5% (92) 1,968 Puerto Rico Cayey 2,060 1.7% 34 2,094 7.5 O&M ESTIMATE The O&M items for the AG-NGCC/CCS Facility are the same as those set forth in Section 6.5 for the AG-NGCC Facility, except that adders are included to both FOM and VOM to accommodate the expenses associated with compressor maintenance, sequestration maintenance, and the associated additional labor required to manage, operate, and maintain the additional equipment. Table 7-3 presents the O&M expenses for the AG-NGCC/CCS Facility. TABLE 7-3 – O&M EXPENSES FOR AG-NGCC WITH CCS Technology: AG-NGCC/CCS Fixed O&M Expense $30.25/kW-year Variable O&M Expense $6.45/MWh 7.6 ENVIRONMENTAL COMPLIANCE INFORMATION The environmental compliance strategy and equipment for the AG-NGCC Facility are the same as those described in Section 5.6 for the Conventional NGCC Facility, with the exception that the AG-NGCC with CCS Facility includes an amine scrubber control device for CO2. Table 7-4 presents environmental emissions for the AG-NGCC/CCS Facility. 7-4
  • 72.
    TABLE 7-4 –ENVIRONMENTAL EMISSIONS FOR AG-NGCC/CCS Technology: AG-NGCC/CCS NOX 0.0075 lb/MMBtu SO2 0.001 lb/MMBtu CO2 12 lb/MMBtu 7-5
  • 73.
    8. CONVENTIONAL COMBUSTION TURBINE (CT) 8.1 MECHANICAL EQUIPMENT AND SYSTEMS The Conventional CT Facility produces 85 MW of electricity using a single natural gas-fueled E-class CT and associated electric generator in simple-cycle mode. The CT is equipped with an inlet evaporative cooler to reduce the temperature of the turbine inlet air to increase summer output. Figure 8-1 presents the Conventional CT Facility process flow diagram. FIGURE 8-1 – CONVENTIONAL CT DESIGN CONFIGURATION 8.2 ELECTRICAL AND CONTROL SYSTEMS The Conventional CT Facility has one CT electric generator. The generator is a 60 Hz machine rated at approximately 101 MVA with an output voltage of 13.8 kV. The CT electric generator is connected to a high-voltage bus in the Conventional CT Facility switchyard via a dedicated generator circuit breaker, GSU, and a disconnect switch. The GSU increases the voltage from the electric generator from 13.8 kV to interconnected transmission system high voltage. The Conventional CT Facility is controlled using a DCS. The DCS provides centralized control of the facility by integrating the control systems provided with the individual CT and associated electric generator and the control of BOP systems and equipment. 8.3 OFF-SITE REQUIREMENTS Natural gas is delivered to the facility through an approximately lateral connected to the local natural gas trunk line. Water for the limited processes that utilize water at the Conventional CT Facility is obtained from a one of several available water sources (e.g., municipal water supply). The Conventional CT Facility uses a water treatment system and a high-efficiency reverse osmosis system to reduce the dissolved solids for compressor cleaning. Wastewater is sent to a municipal wastewater system. Further, the electrical interconnection from the Conventional CT on-site switchyard is effectuated by a connection to an adjacent utility substation. 8-1
  • 74.
    8.4 CAPITAL COSTESTIMATE The base Cost Estimate for the Conventional CT Facility with a nominal capacity of 85 MW is $975/kW. Table 8-1 summarizes the Cost Estimate categories for the Conventional CT Facility. TABLE 8-1 – BASE PLANT SITE CAPITAL COST ESTIMATE FOR CONVENTIONAL CT Technology: Conventional CT Nominal Capacity (ISO): 85,000 kW Nominal Heat Rate (ISO): 10,850 Btu/kWh-HHV Capital Cost Category (000s) (October 1, 2010$) Civil Structural Material and Installation 5,570 Mechanical Equipment Supply and Installation 34,709 Electrical / I&C Supply and Installation 10,700 Project Indirects (1) 12,248 EPC Cost before Contingency and Fee 63,227 Fee and Contingency 5,757 Total Project EPC 68,994 Owner Costs (excluding project finance) 13,799 Total Project Cost (excluding finance) 82,793 Total Project EPC / kW 812 Owner Costs 20% (excluding project finance) / kW 162 Total Project Cost (excluding project finance) / kW 974 (1) Includes engineering, distributable costs, scaffolding, construction management, and start-up. For this type of technology and power plant configuration, our regional adjustments took into consideration the following: outdoor installation considerations, seismic design differences, local technical enhancements (e.g., additional noise remediation that is generally required in urban siting), remote location issues, urban – high density population issues, labor wage and productivity differences, location adjustments, owner cost differences, and the increase in overheads associated with these previous eight location adjustments. Outdoor installation locations are considered in geographic areas where enclosed structures for the boilers would not be required due to the low probability of freezing. The locations that were 8-2
  • 75.
    included in outdoorinstallation are Alabama, Arizona, Arkansas, Florida, Georgia, Hawaii, Louisiana, Mississippi, New Mexico, South Carolina, and Puerto Rico. Seismic design differences among the various locations were based on U.S. seismic map information that detailed the various seismic zones throughout the U.S. No cost increases were associated with seismic Zone 0 and cost step increases were considered for Zones 1, 2, 3 and 4. The locations with local technical enhancements include California, Colorado, Connecticut, Delaware, District of Columbia, Louisiana, Maryland, Massachusetts, New Jersey, New York, Rhode Island, Vermont, and Virginia. These are areas where noise, visual impacts, and other technical enhancements generally need to be made by a project developer or utility to comply with the applicable permitting/siting requirements. Remote location issues are related to geographic areas that typically require installation of man camps, higher craft incentives, and higher per diems are generally required with respect to construction, due to the fact that such areas are long distances from urban areas, where labor is generally abundant. Remote location designations were also considered in locations where higher equipment freight costs are typically incurred, which for example are regions not near established rail or highway access. Remote locations related to the Conventional CT Facility include Fairbanks, Alaska; Honolulu, Hawaii; Albuquerque, New Mexico; Cheyenne, Wyoming; and Cayey, Puerto Rico. Labor wage and productivity differences were handled as discussed in Section 2.5.1, taking into consideration the amount of labor we estimated for the Conventional CT Facility. Location adjustments were made to locations where higher cost of living levels are incurred and/or where population density generally correlates to higher construction costs for power and other infrastructure projects. These locations include Alaska, California, Connecticut, Delaware, District of Columbia, Hawaii, Illinois, Maine, Maryland, Massachusetts, Michigan, Minnesota, New York, Ohio, and Wisconsin. Owner costs were reviewed based on the need for utility upgrades and/or infrastructure costs such as new facility transmission lines to tie to existing utility transmission substations or existing transmission lines. Table 8-2 presents the Conventional CT Facility capital cost variations for alternative U.S. plant locations. 8-3
  • 76.
    TABLE 8-2 –LOCATION-BASED COSTS FOR CONVENTIONAL CT (OCTOBER 1, 2010 DOLLARS) Base Project Location Delta Cost Total Location Cost Percent Difference Project Cost State City ($/kW) Variation ($/kW) ($/kW) Alaska Anchorage 975 31.7% 309 1,284 Alaska Fairbanks 975 36.5% 355 1,330 Alabama Huntsville 975 -7.1% (69) 906 Arizona Phoenix 975 3.8% 38 1,013 Arkansas Little Rock 975 -5.7% (55) 920 California Los Angeles 975 28.3% 276 1,251 California Redding 975 13.2% 129 1,104 California Bakersfield 975 15.6% 152 1,127 California Sacramento 975 19.3% 188 1,163 California San Francisco 975 43.6% 425 1,400 Colorado Denver 975 3.5% 34 1,009 Connecticut Hartford 975 27.1% 265 1,240 Delaware Dover 975 25.9% 253 1,228 District of Columbia Washington 975 33.8% 330 1,305 Florida Tallahassee 975 -9.6% (93) 882 Florida Tampa 975 -5.1% (50) 925 Georgia Atlanta 975 -4.9% (48) 927 Hawaii Honolulu 975 49.5% 482 1,457 Idaho Boise 975 -2.8% (28) 947 Illinois Chicago 975 13.6% 132 1,107 Indiana Indianapolis 975 1.3% 13 988 Iowa Davenport 975 0.9% 8 983 Iowa Waterloo 975 -4.6% (45) 930 Kansas Wichita 975 -3.0% (29) 946 Kentucky Louisville 975 -4.1% (40) 935 Louisiana New Orleans 975 -3.1% (30) 945 Maine Portland 975 -1.6% (15) 960 Maryland Baltimore 975 21.4% 208 1,183 Massachusetts Boston 975 37.5% 366 1,341 Michigan Detroit 975 4.8% 46 1,021 Michigan Grand Rapids 975 -3.8% (37) 938 Minnesota St. Paul 975 4.0% 39 1,014 Mississippi Jackson 975 -7.1% (69) 906 Missouri St. Louis 975 5.0% 48 1,023 Missouri Kansas City 975 2.4% 23 998 Montana Great Falls 975 -1.3% (12) 963 Nebraska Omaha 975 -0.6% (6) 969 New Hampshire Concord 975 8.0% 78 1,053 New Jersey Newark 975 19.3% 188 1,163 8-4
  • 77.
    Base Project Location Delta Cost Total Location Cost Percent Difference Project Cost State City ($/kW) Variation ($/kW) ($/kW) New Mexico Albuquerque 975 -1.4% (13) 962 New York New York 975 62.5% 609 1,584 New York Syracuse 975 16.8% 164 1,139 Nevada Las Vegas 975 5.2% 50 1,025 North Carolina Charlotte 975 -7.2% (70) 905 North Dakota Bismarck 975 -3.8% (38) 937 Ohio Cincinnati 975 -0.8% (8) 967 Oregon Portland 975 13.0% 127 1,102 Pennsylvania Philadelphia 975 24.1% 235 1,210 Pennsylvania Wilkes-Barre 975 -0.7% (7) 968 Rhode Island Providence 975 21.6% 210 1,185 South Carolina Spartanburg 975 -10.3% (101) 874 South Dakota Rapid City 975 -5.8% (57) 918 Tennessee Knoxville 975 -6.6% (65) 910 Texas Houston 975 -7.0% (68) 907 Utah Salt Lake City 975 -2.6% (25) 950 Vermont Burlington 975 1.3% 13 988 Virginia Alexandria 975 16.8% 163 1,138 Virginia Lynchburg 975 -4.5% (44) 931 Washington Seattle 975 6.1% 59 1,034 Washington Spokane 975 -1.8% (18) 957 West Virginia Charleston 975 0.6% 6 981 Wisconsin Green Bay 975 -0.6% (6) 969 Wyoming Cheyenne 975 1.0% 10 985 Puerto Rico Cayey 975 12.1% 118 1,093 8.5 O&M ESTIMATE In addition to the general O&M items discussed in Section 2.5.2, the Conventional CT Facility includes the major maintenance for the CT and associated electric generator. These major maintenance expenses are included with the VOM expense for this technology, based upon an assumed 10 percent annual capacity factor and an operating profile of approximately 8 hours of operation per CT start. Typically, significant overhauls on a Conventional CT Facility occur no less frequently than 8,000 operating hour intervals; with more significant major maintenance outages occurring at 24,000 operating hour intervals; however, often times the major maintenance for a CT at a peaking facility is driven off of CT hours (depending on the equipment manufacturer and the operating hours per start incurred on the equipment). Table 8-3 presents the O&M expenses for the Conventional CT Facility. 8-5
  • 78.
    TABLE 8-3 –O&M EXPENSES FOR CONVENTIONAL CT Technology: Conventional CT Fixed O&M Expense $6.98/kW-year Variable O&M Expense $14.70/MWh 8.6 ENVIRONMENTAL COMPLIANCE INFORMATION Typically, a Conventional CT Facility would be equipped with only the DLN combustion hardware to mitigate emissions. There are some states in the U.S. that do require a “hot” SCR that can operate at the higher exhaust temperatures of a simple-cycle plant, though that equipment was not contemplated herein. TABLE 8-4 – ENVIRONMENTAL EMISSIONS FOR CONVENTIONAL CT Technology: Conventional CT NOX 0.03 lb/MMBtu SO2 0.001 lb/MMBtu CO2 117 lb/MMBtu 8-6
  • 79.
    9. ADVANCED COMBUSTION TURBINE (ACT) 9.1 MECHANICAL EQUIPMENT AND SYSTEMS The Advanced CT Facility produces 210 MW of electricity using a single natural gas-fueled, state of the art (as of 2010) F-class CT and associated electric generator. The CT is equipped with an inlet evaporative cooler to reduce the temperature of the turbine inlet air to increase summer output. Figure 9-1 presents the Advanced CT process flow diagram. FIGURE 9-1 – ADVANCED CT DESIGN CONFIGURATION 9.2 ELECTRICAL AND CONTROL SYSTEMS The Advanced CT Facility has the same general electrical and control systems as the Conventional CT Facility, except that the electric generator is rated at approximately 234 MVA and the corresponding GSU is larger in the Advanced CT Facility. 9.3 OFF-SITE REQUIREMENTS The off-site requirements for the Advanced CT Facility are materially similar to the Conventional CT Facility. 9.4 CAPITAL COST ESTIMATE The base Cost Estimate for the Advanced CT Facility with a nominal capacity of 210 MW is $665/kW. Table 9-1 summarizes the Cost Estimate categories for the Advanced CT Facility. 9-1
  • 80.
    TABLE 9-1 –BASE PLANT SITE CAPITAL COST ESTIMATE FOR ADVANCED CT Technology: Advanced CT Nominal Capacity (ISO): 210,000 kW Nominal Heat Rate (ISO): 9,750 Btu/kWh-HHV Capital Cost Category (000s) (October 1, 2010$) Civil Structural Material and Installation 11,800 Mechanical Equipment Supply and Installation 58,700 Electrical / I&C Supply and Installation 15,300 Project Indirects (1) 16,460 EPC Cost before Contingency and Fee 102,260 Fee and Contingency 14,196 Total Project EPC 116,456 Owner Costs (excluding project finance) 23,291 Total Project Cost (excluding finance) 139,747 Total Project EPC / kW 554 Owner Costs 20% (excluding project finance) / kW 111 Total Project Cost (excluding project finance) / kW 665 (1) Includes engineering, distributable costs, scaffolding, construction management, and start-up. The locational considerations for the Advanced CT Facility are the same as those set forth in the section on the Conventional CT Facility. Table 9-2 presents the Advanced CT Facility capital cost variations for alternative U.S. plant locations. 9-2
  • 81.
    TABLE 9-2 –LOCATION-BASED COSTS FOR ADVANCED CT (OCTOBER 1, 2010 DOLLARS) Base Project Location Delta Cost Total Location Cost Percent Difference Project Cost State City ($/kW) Variation ($/kW) ($/kW) Alaska Anchorage 665 34.3% 228 893 Alaska Fairbanks 665 5.4% 36 701 Alabama Huntsville 665 -1.4% (9) 656 Arizona Phoenix 665 4.4% 29 694 Arkansas Little Rock 665 -3.4% (23) 642 California Los Angeles 665 5.6% 38 703 California Redding 665 2.5% 17 682 California Bakersfield 665 1.2% 8 673 California Sacramento 665 1.3% 9 674 California San Francisco 665 -0.2% (2) 663 Colorado Denver 665 20.6% 137 802 Connecticut Hartford 665 3.7% 25 690 Delaware Dover 665 61.7% 410 1,075 District of Columbia Washington 665 12.2% 81 746 Florida Tallahassee 665 4.6% 31 696 Florida Tampa 665 -4.6% (31) 634 Georgia Atlanta 665 -1.5% (10) 655 Hawaii Honolulu 665 1.2% 8 673 Idaho Boise 665 4.7% 31 696 Illinois Chicago 665 16.1% 107 772 Indiana Indianapolis 665 1.7% 11 676 Iowa Davenport 665 16.6% 111 776 Iowa Waterloo 665 -5.5% (37) 628 Kansas Wichita 665 -3.0% (20) 645 Kentucky Louisville 665 -4.6% (31) 634 Louisiana New Orleans 665 -5.2% (35) 630 Maine Portland 665 0.0% (0) 665 Maryland Baltimore 665 5.6% 37 702 Massachusetts Boston 665 12.6% 84 749 Michigan Detroit 665 -3.0% (20) 645 Michigan Grand Rapids 665 6.5% 43 708 Minnesota St. Paul 665 -0.6% (4) 661 Mississippi Jackson 665 2.3% 15 680 Missouri St. Louis 665 1.0% 6 671 Missouri Kansas City 665 5.5% 36 701 Montana Great Falls 665 10.3% 68 733 Nebraska Omaha 665 34.3% 228 893 New Hampshire Concord 665 5.4% 36 701 New Jersey Newark 665 -1.4% (9) 656 9-3
  • 82.
    Base Project Location Delta Cost Total Location Cost Percent Difference Project Cost State City ($/kW) Variation ($/kW) ($/kW) New Mexico Albuquerque 665 4.4% 29 694 New York New York 665 -3.4% (23) 642 New York Syracuse 665 5.6% 38 703 Nevada Las Vegas 665 2.5% 17 682 North Carolina Charlotte 665 1.2% 8 673 North Dakota Bismarck 665 1.3% 9 674 Ohio Cincinnati 665 -0.2% (2) 663 Oregon Portland 665 20.6% 137 802 Pennsylvania Philadelphia 665 3.7% 25 690 Pennsylvania Wilkes-Barre 665 61.7% 410 1,075 Rhode Island Providence 665 12.2% 81 746 South Carolina Spartanburg 665 4.6% 31 696 South Dakota Rapid City 665 -4.6% (31) 634 Tennessee Knoxville 665 -1.5% (10) 655 Texas Houston 665 1.2% 8 673 Utah Salt Lake City 665 4.7% 31 696 Vermont Burlington 665 16.1% 107 772 Virginia Alexandria 665 1.7% 11 676 Virginia Lynchburg 665 16.6% 111 776 Washington Seattle 665 -5.5% (37) 628 Washington Spokane 665 -3.0% (20) 645 West Virginia Charleston 665 -4.6% (31) 634 Wisconsin Green Bay 665 -5.2% (35) 630 Wyoming Cheyenne 665 0.0% (0) 665 Puerto Rico Cayey 665 5.6% 37 702 9.5 O&M ESTIMATE The O&M items for the Advanced CT Facility are the same as those set forth in Section 8.5 for the Conventional CT Facility. Table 9-3 presents the O&M expenses for the Advanced CT Facility. TABLE 9-3 – O&M EXPENSES FOR ADVANCED CT Technology: Advanced CT Fixed O&M Expense $6.70/kW-year Variable O&M Expense $9.87/MWh 9.6 ENVIRONMENTAL COMPLIANCE INFORMATION The environmental compliance strategy and equipment for the Advanced CT Facility are the same as those used for the Conventional CT Facility (see Section 8.6). Table 9-4 presents environmental emissions for the Advanced CT Facility. 9-4
  • 83.
    TABLE 9-4 –ENVIRONMENTAL EMISSIONS FOR ADVANCED CT Technology: Advanced CT NOX 0.03 lb/MMBtu SO2 0.001 lb/MMBtu CO2 117 lb/MMBtu 9-5
  • 84.
    10. INTEGRATED GASIFICATIONCOMBINED CYCLE (IGCC) 10.1 MECHANICAL EQUIPMENT AND SYSTEMS The following describes the IGCC Facility, which is a nominal 600 MW net coal-fired gasification-to-power facility. An analysis is also provided for a nominally 1,200 MW coal-fired gasification-to-power facility, which is essentially a dual-unit configuration, based on doubling the single-unit description provided below; however, a detailed technical description (due to the similarities/duplication with the single unit) is not provided herein. The feed for the gasification system is a slurry of water and ground coal and/or petroleum coke. The raw feedstock is ground in rod mills along with recycled water and slag fines to form the slurry. A fluxing agent is also added, if necessary, depending on the properties of the feedstock, to facilitate slagging at appropriate temperatures in the gasifier. Air separation units (“ASU”) provide a 95 percent-pure oxygen (“O2”) stream for gasification, and nitrogen for use as a diluent in the CTs, and for purging the gasifiers. The IGCC Facility is based on two trains of ConocoPhillips (E-Gas) gasifier, which is a two-stage, refractory lined vessel that converts the slurry feed into syngas consisting of hydrogen, CO, CO2, methane, nitrogen, argon and water along with sulfur compounds in the form of hydrogen sulfide (“H2S”) and carbonyl sulfide (“COS”) and a small amount of NH3. The first stage is the slagging section in which the feedstock is partially combusted with O2 at elevated temperature and pressure (2,500 degrees ºF and 540 psia). O2 and preheated slurry are fed to each of two opposing mixing nozzles at opposite ends of the horizontal section. The gasification temperature is maintained above the ash fusion point to allow for slag formation and carbon conversion. The raw syngas from the first stage flows into the vertical second stage where additional feed slurry is introduced to take advantage of the sensible heat in the gas. This fuel undergoes devolatization and pyrolysis generating additional syngas. The endothermic nature of the reactions and the introduction of a quench fluid reduce the temperature of the gas exiting to the gasifier to approximately 1,900ºF. At these temperatures (2,500ºF to 1,900ºF), two additional reactions occur, which change the character of the syngas as follows: (1) carbon-steam to produce CO; and (2) water gas shift (steam and CO) to produce hydrogen and CO2. In addition, the lower reaction temperature in the second stage allows the formation of methane. Unreacted char is carried overhead and exits the reactor with the syngas. This char is recycled to the first stage of gasification. The mineral matter in the feedstock and any fluxing agent form a molten slag that flows out of the horizontal section into water quench bath. The cooled slag exits the bottom of the quench, is crushed and exits the unit through a continuous slag removal system as a slurry. The hot raw syngas is cooled in a vertical fire tube boiler from 1,900ºF to 700ºF. The hot gas is on the tube side with pressurized water on the shell side. This unit generates HP saturated steam. The saturated steam is sent to the HRSGs in the power block. After cooling, the syngas is cleaned of entrained particles in a filter vessel containing numerous candlestick-type filter elements. The particles collect on the filter elements producing an essentially particulate matter free syngas that proceeds through the system. 10-1
  • 85.
    Captured particulate matteris cleaned from the filter elements using cleaned syngas (in a back-pulse mode) and the carbon-rich material is pneumatically conveyed back to the first stage of the gasifier for conversion. Following particulate matter removal, the syngas is scrubbed with water to remove chlorine and trace metals. The scrubbing medium is condensed sour water from the low-temperature heat recovery system. After the chlorine scrubber, the raw syngas is treated in COS hydrolysis units, which convert the COS in the syngas to H2S. The syngas is then cooled to approximately 100°F in a series of shell and tube heat exchangers in a step known as low-temperature heat recovery. This cooling removes most of the water in the syngas. In addition, most of the NH3 and a small portion of CO2 and H2S are absorbed in the water. A portion of the condensed water is used in the chlorine scrubber with the remainder sent to sour water treatment. The low temperature heat removed prior to acid gas removal (“AGR”) is used within the process. After low-temperature heat recovery, the H2S is then removed in the AGR units. The AGR units use the Selexol solvent in a single absorption stage to remove much of the sulfur from the syngas. The syngas passes through a mercury removal system consisting of sulfated activated carbon beds. Finally, the treated syngas is moisturized and sent to the power block. The acid gas streams containing H2S and COS with some CO2 from AGR and sour water treatment are fed to the sulfur recovery units (“SRUs”). The SRUs are based on a standard Claus process to convert the acid gas to pure molten sulfur. The tail gas from the SRUs, composed of CO2, nitrogen, and small amounts of sulfur, is catalytically hydrogenated to convert all of the sulfur to H2S. This converted tail gas is compressed and recycled to the gasifiers. Process water blowdown and water condensed during cooling of the sour syngas contains small amounts of dissolved gases (H2S, CO2 and NH3). This water is treated in sour water stripping units and either recycled to slurry preparation or further treated in a zero-liquid discharge (“ZLD”) system to recover and reuse water. Solid waste from the ZLD is landfilled. The power block for the IGCC Facility case is based on a two-on-one combined-cycle configuration using F-class CTs. The combined cycle is similar to the Conventional NGCC Facility except the CTs are designed to combust natural gas and/or syngas, and the combustors are not DLN. Figure 10-1 presents the IGCC process flow diagram. 10-2
  • 86.
    FIGURE 10-1 –IGCC DESIGN CONFIGURATION 10.2 ELECTRICAL AND CONTROL SYSTEMS The IGCC Facility has two CT electric generators and one ST electric generator. The generators for the CTs are 60 Hz machines rated at approximately 255 MVA with an output voltage of 18 kV. The ST electric generator is a 60 Hz machine rated at approximately 333 MVA with an output voltage of 18 kV. Each CT electric generator is connected to a high-voltage bus in the IGCC Facility switchyard via a dedicated generator circuit breaker, GSU, and a disconnect switch. The ST electric generator is connected directly to its GSU and connected through a disconnect switch between two breakers on the high-voltage bus. The GSUs increase the voltage from the electric generators from 18 kV to interconnected transmission system high voltage. The IGCC Facility is controlled using a DCS. The DCS provides centralized control of the facility by integrating the control systems provided with each individual CT and associated electric generator, ST and associated electric generator, and the control of BOP systems and equipment. 10.3 OFF-SITE REQUIREMENTS Coal is delivered to the IGCC Facility by rail, truck or barge. Water for all processes at the IGCC is obtained from one of several available water sources; however, water is typically sourced from an adjacent river, when possible. The IGCC uses a water treatment system and a high-efficiency reverse osmosis system to reduce the dissolved solids from the cooling water and to provide distilled water for HRSG makeup. Wastewater is sent to an adjacent river or other approved wastewater delivery point. Further, the electrical interconnection from the IGCC on- site switchyard is effectuated by a connection to an adjacent utility substation. 10-3
  • 87.
    10.4 CAPITAL COSTESTIMATE The base Cost Estimate for the IGCC Facility with a nominal capacity of 600 MW is $3,565/kW and with a nominal capacity of 1,200 MW is $3,221/kW. Table 10-1 and Table 10-2 summarize the Cost Estimate categories for the IGCC Facility. TABLE 10-1 – BASE PLANT SITE CAPITAL COST ESTIMATE FOR IGCC Technology: IGCC Nominal Capacity (ISO): 600,000 kW Nominal Heat Rate (ISO): 8,700 Btu/kWh-HHV Capital Cost Category (000s) (October 1, 2010$) Civil Structural Material and Installation 102,121 Mechanical Equipment Supply and Installation 975,212 Electrical / I&C Supply and Installation 200,708 Project Indirects (1) 313,558 EPC Cost before Contingency and Fee 1,591,599 Fee and Contingency 190,992 Total Project EPC 1,782,591 Owner Costs (excluding project finance) 356,518 Total Project Cost (excluding finance) 2,139,109 Total Project EPC / kW 2,971 Owner Costs 20% (excluding project finance) / kW 594 Total Project Cost (excluding project finance) / kW 3,565 (1) Includes engineering, distributable costs, scaffolding, construction management, and start-up. 10-4
  • 88.
    TABLE 10-2 –BASE PLANT SITE CAPITAL COST ESTIMATE FOR IGCC Technology: IGCC Nominal Capacity (ISO): 1,200,000 kW Nominal Heat Rate (ISO): 8,700 Btu/kWh-HHV Capital Cost Category (000s) (October 1, 2010$) Civil Structural Material and Installation 178,606 Mechanical Equipment Supply and Installation 1,859,974 Electrical / I&C Supply and Installation 364,745 Project Indirects (1) 521,600 EPC Cost before Contingency and Fee 2,924,925 Fee and Contingency 350,991 Total Project EPC 3,275,916 Owner Costs (excluding project finance) 589,665 Total Project Cost (excluding finance) 3,865,581 Total Project EPC / kW 2730 Owner Costs 18% (excluding project finance) / kW 491 Total Project Cost (excluding project finance) / kW 3,221 (1) Includes engineering, distributable costs, scaffolding, construction management, and start-up. For this type of technology and power plant configuration, our regional adjustments took into consideration the following: outdoor installation considerations, seismic design differences, remote location issues, labor wage and productivity differences, location adjustments, owner cost differences, and the increase in overheads associated with these six adjustments. Outdoor installation locations are considered in geographic areas where enclosed structures for the boilers would not be required due to the low probability of freezing. The locations that included outdoor installation are Alabama, Arizona, Arkansas, Florida, Georgia, Hawaii, Louisiana, Mississippi, New Mexico, South Carolina, and Puerto Rico. Seismic design differences among the various locations were based on U.S. seismic map information that detailed the various seismic zones throughout the U.S. No cost increases were associated with seismic Zone 0 and cost step increases were considered for Zones 1, 2, 3 and 4. 10-5
  • 89.
    Remote locations issuesare related to geographic areas that typically require installation of man camps, higher craft incentives, and higher per diems for construction, because such areas are long distances from urban areas, where labor is generally abundant. Remote location designations were also considered in locations where higher equipment freight costs are typically incurred, which for example are regions not near established rail or highway access. Remote locations related to the IGCC Facility include Fairbanks, Alaska; Honolulu, Hawaii; Albuquerque, New Mexico; Cheyenne, Wyoming; and Cayey, Puerto Rico. Labor wage and productivity differences were handled as discussed in Section 2.5.1, taking into consideration the amount of labor we estimated for the IGCC Facility. Location adjustments were made to locations where higher cost of living levels are incurred and/or where population density generally correlates to higher construction costs for power and other infrastructure projects. These locations include Alaska, California, Connecticut, Delaware, District of Columbia, Hawaii, Illinois, Maine, Maryland, Massachusetts, Michigan, Minnesota, New York, Ohio, and Wisconsin. Owner costs were reviewed based on the need for utility upgrades and/or infrastructure costs such as new facility transmission lines to tie to existing utility transmission substations or existing transmission lines. Table 10-3 and Table 10-4 present the IGCC Facility capital cost variations for alternative U.S. plant locations. 10-6
  • 90.
    TABLE 10-3 –LOCATION-BASED COSTS FOR IGCC (600,000 KW) (OCTOBER 1, 2010 DOLLARS) Base Project Location Delta Cost Total Location Cost Percent Difference Project Cost State City ($/kW) Variation ($/kW) ($/kW) Alaska Anchorage 3,565 29.4% 1,049 4,614 Alaska Fairbanks 3,565 28.5% 1,016 4,581 Alabama Huntsville 3,565 -6.5% (232) 3,333 Arizona Phoenix 3,565 -4.5% (160) 3,405 Arkansas Little Rock 3,565 -4.7% (167) 3,398 California Los Angeles 3,565 18.1% 645 4,210 California Redding 3,565 8.7% 312 3,877 California Bakersfield 3,565 8.4% 299 3,864 California Sacramento 3,565 12.8% 455 4,020 California San Francisco 3,565 37.6% 1,342 4,907 Colorado Denver 3,565 -5.2% (187) 3,378 Connecticut Hartford 3,565 23.7% 846 4,411 Delaware Dover 3,565 20.6% 734 4,299 District of Columbia Washington 3,565 35.6% 1,269 4,834 Florida Tallahassee 3,565 -9.5% (339) 3,226 Florida Tampa 3,565 -4.3% (152) 3,413 Georgia Atlanta 3,565 -7.1% (252) 3,313 Hawaii Honolulu 0 0 Idaho Boise 3,565 -3.2% (113) 3,452 Illinois Chicago 3,565 17.4% 619 4,184 Indiana Indianapolis 3,565 2.9% 103 3,668 Iowa Davenport 3,565 -1.4% (48) 3,517 Iowa Waterloo 3,565 -7.8% (279) 3,286 Kansas Wichita 3,565 -5.8% (208) 3,357 Kentucky Louisville 3,565 -4.8% (172) 3,393 Louisiana New Orleans 3,565 -9.8% (348) 3,217 Maine Portland 3,565 -0.4% (14) 3,551 Maryland Baltimore 3,565 4.3% 153 3,718 Massachusetts Boston 3,565 31.3% 1,115 4,680 Michigan Detroit 3,565 3.4% 120 3,685 Michigan Grand Rapids 3,565 -6.8% (243) 3,322 Minnesota St. Paul 3,565 3.4% 123 3,688 Mississippi Jackson 3,565 -6.5% (230) 3,335 Missouri St. Louis 3,565 6.4% 227 3,792 Missouri Kansas City 3,565 3.0% 107 3,672 Montana Great Falls 3,565 -3.7% (131) 3,434 Nebraska Omaha 3,565 -3.0% (108) 3,457 New Hampshire Concord 3,565 -1.4% (49) 3,516 New Jersey Newark 3,565 13.5% 480 4,045 10-7
  • 91.
    Base Project Location Delta Cost Total Location Cost Percent Difference Project Cost State City ($/kW) Variation ($/kW) ($/kW) New Mexico Albuquerque 3,565 -3.4% (120) 3,445 New York New York 3,565 28.4% 1,013 4,578 New York Syracuse 3,565 9.7% 345 3,910 Nevada Las Vegas 3,565 8.1% 290 3,855 North Carolina Charlotte 3,565 -8.3% (296) 3,269 North Dakota Bismarck 3,565 -6.9% (247) 3,318 Ohio Cincinnati 3,565 0.4% 16 3,581 Oregon Portland 3,565 8.5% 303 3,868 Pennsylvania Philadelphia 3,565 10.6% 377 3,942 Pennsylvania Wilkes-Barre 3,565 -3.0% (107) 3,458 Rhode Island Providence 3,565 3.6% 129 3,694 South Carolina Spartanburg 3,565 -10.2% (364) 3,201 South Dakota Rapid City 3,565 -9.3% (331) 3,234 Tennessee Knoxville 3,565 -7.7% (276) 3,289 Texas Houston 3,565 -8.3% (294) 3,271 Utah Salt Lake City 3,565 -2.6% (91) 3,474 Vermont Burlington 3,565 -4.6% (162) 3,403 Virginia Alexandria 3,565 8.8% 313 3,878 Virginia Lynchburg 3,565 -1.6% (56) 3,509 Washington Seattle 3,565 11.3% 404 3,969 Washington Spokane 3,565 -2.0% (70) 3,495 West Virginia Charleston 3,565 -1.5% (55) 3,510 Wisconsin Green Bay 3,565 0.5% 19 3,584 Wyoming Cheyenne 3,565 3.7% 132 3,697 Puerto Rico Cayey 0 0 0 10-8
  • 92.
    TABLE 10-4 –LOCATION-BASED COSTS FOR IGCC (1,200,000 KW) (OCTOBER 1, 2010 DOLLARS) Base Project Location Delta Cost Total Location Cost Percent Difference Project Cost State City ($/kW) Variation ($/kW) ($/kW) Alaska Anchorage 3,221 32.0% 1,031 4,252 Alaska Fairbanks 3,221 30.9% 996 4,217 Alabama Huntsville 3,221 -6.7% (216) 3,005 Arizona Phoenix 3,221 -4.6% (147) 3,074 Arkansas Little Rock 3,221 -4.8% (154) 3,067 California Los Angeles 3,221 19.8% 637 3,858 California Redding 3,221 9.6% 308 3,529 California Bakersfield 3,221 9.2% 296 3,517 California Sacramento 3,221 13.7% 442 3,663 California San Francisco 3,221 40.8% 1,313 4,534 Colorado Denver 3,221 -5.4% (173) 3,048 Connecticut Hartford 3,221 26.0% 836 4,057 Delaware Dover 3,221 22.7% 730 3,951 District of Columbia Washington 3,221 39.5% 1,272 4,493 Florida Tallahassee 3,221 -9.9% (318) 2,903 Florida Tampa 3,221 -4.4% (143) 3,078 Georgia Atlanta 3,221 -7.3% (235) 2,986 Hawaii Honolulu - - Idaho Boise 3,221 -3.2% (102) 3,119 Illinois Chicago 3,221 18.2% 586 3,807 Indiana Indianapolis 3,221 3.3% 107 3,328 Iowa Davenport 3,221 -1.4% (45) 3,176 Iowa Waterloo 3,221 -8.1% (261) 2,960 Kansas Wichita 3,221 -6.0% (192) 3,029 Kentucky Louisville 3,221 -4.9% (158) 3,063 Louisiana New Orleans 3,221 -10.1% (326) 2,895 Maine Portland 3,221 0.0% (1) 3,220 Maryland Baltimore 3,221 5.0% 162 3,383 Massachusetts Boston 3,221 33.8% 1,087 4,308 Michigan Detroit 3,221 3.5% 114 3,335 Michigan Grand Rapids 3,221 -7.1% (227) 2,994 Minnesota St. Paul 3,221 3.6% 117 3,338 Mississippi Jackson 3,221 -6.6% (214) 3,007 Missouri St. Louis 3,221 6.9% 221 3,442 Missouri Kansas City 3,221 3.2% 103 3,324 Montana Great Falls 3,221 -3.7% (119) 3,102 Nebraska Omaha 3,221 -3.1% (99) 3,122 New Hampshire Concord 3,221 -1.3% (42) 3,179 New Jersey Newark 3,221 14.0% 449 3,670 10-9
  • 93.
    Base Project Location Delta Cost Total Location Cost Percent Difference Project Cost State City ($/kW) Variation ($/kW) ($/kW) New Mexico Albuquerque 3,221 -3.4% (109) 3,112 New York New York 3,221 29.5% 949 4,170 New York Syracuse 3,221 10.8% 349 3,570 Nevada Las Vegas 3,221 8.6% 278 3,499 North Carolina Charlotte 3,221 -8.5% (273) 2,948 North Dakota Bismarck 3,221 -7.2% (230) 2,991 Ohio Cincinnati 3,221 0.8% 25 3,246 Oregon Portland 3,221 9.3% 300 3,521 Pennsylvania Philadelphia 3,221 11.0% 355 3,576 Pennsylvania Wilkes-Barre 3,221 -3.0% (96) 3,125 Rhode Island Providence 3,221 3.9% 124 3,345 South Carolina Spartanburg 3,221 -10.5% (337) 2,884 South Dakota Rapid City 3,221 -9.6% (309) 2,912 Tennessee Knoxville 3,221 -7.9% (256) 2,965 Texas Houston 3,221 -8.5% (275) 2,946 Utah Salt Lake City 3,221 -2.4% (76) 3,145 Vermont Burlington 3,221 -4.6% (148) 3,073 Virginia Alexandria 3,221 9.9% 320 3,541 Virginia Lynchburg 3,221 -1.3% (41) 3,180 Washington Seattle 3,221 12.3% 395 3,616 Washington Spokane 3,221 -1.9% (62) 3,159 West Virginia Charleston 3,221 -1.5% (49) 3,172 Wisconsin Green Bay 3,221 0.8% 27 3,248 Wyoming Cheyenne 3,221 4.6% 148 3,369 Puerto Rico Cayey 0 0 0 0 10.5 O&M ESTIMATE In addition to the general O&M items discussed in Section 2.5.2, IGCC Facility includes the major maintenance for the CTs, as well as the BOP, including the ST, associated electric generators, HRSGs, and emissions reduction catalysts. Additionally, provisions need to be made for routine and major maintenance for the gasification systems, the ASU, and associated gasification auxiliary equipment needs to be made. For example, major maintenance for the gasifier includes repair and replacement of the refractory. Typically, significant overhauls on an IGCC Facility occur no less frequently than 18 months and the cycle for the power generation equipment is similar to the to the Advanced NGCC discussed above. Table 10-5 and Table 10-6 present the O&M expenses for the IGCC Facility. TABLE 10-5 – O&M EXPENSES FOR IGCC (600,000 KW) Technology: IGCC Fixed O&M Expense $59.23/kW-year Variable O&M Expense $6.87/MWh 10-10
  • 94.
    TABLE 10-6 –O&M EXPENSES FOR IGCC (1,200,000 KW) Technology: IGCC Fixed O&M Expense $48.90/kW-year Variable O&M Expense $6.87/MWh 10.6 ENVIRONMENTAL COMPLIANCE INFORMATION The IGCC uses syngas combustors (which do not have DLN) in the CT and best available burner technology with respect to the duct burners in the HRSGs to manage the production of NOX and CO. Additional control of NOX and CO is accomplished through an SCR and an oxidization catalyst, respectively. SO2 in the IGCC is managed through the removal of sulfur in the syngas via the AGR system prior to combustion. The IGCC does not include any control devices for CO2, which is proportional to the heat rate (inversely proportional to the efficiency) of the technology. Water, wastewater, and solid waste compliance are achieved through traditional on-site and off-site methods, and the costs for such compliance are included in the O&M Estimate for the IGCC. Table 10-7 presents environmental emissions for the IGCC Facility. TABLE 10-7 – ENVIRONMENTAL EMISSIONS FOR IGCC Technology: IGCC NOX 0.0075 lb/MMBtu SO2 0.025 lb/MMBtu CO2 206 lb/MMBtu 10-11
  • 95.
    11. INTEGRATED GASIFICATIONCOMBINED CYCLE WITH CCS (IGCC/CCS) 11.1 MECHANICAL EQUIPMENT AND SYSTEMS The plant configuration for the IGCC/CCS Facility case is the same as the IGCC Facility case with the exceptions that: (1) a water gas shift reactor system is substituted instead of the COS hydrolysis system upstream of the AGR; and (2) a two-stage Selexol AGR system is utilized instead of a single stage to allow the capture of CO2 from the syngas prior to combustion. The captured CO2 is compressed to approximately 2,000 psia for injection into a pipeline at the plant fence line. The IGCC/CCS Facility produces 690 MW of gross power and 520 MW of net power. Figure 11-1 presents the IGCC/CCS process flow diagram. FIGURE 11-1 – IGCC/CCS DESIGN CONFIGURATION 11.2 ELECTRICAL AND CONTROL SYSTEMS The electrical and control systems for the IGCC/CCS Facility are materially similar to the IGCC Facility (without CCS) discussed in Section 10.2. 11.3 OFF-SITE REQUIREMENTS The off-site requirements for the IGCC/CCS Facility are materially similar to the IGCC Facility (without CCS) discussed in Section 10.3, except that an interconnection needs to be made with respect to the sequestration of CO2. 11.4 CAPITAL COST ESTIMATE The base Cost Estimate for the IGCC/CCS Facility with a nominal capacity of 520 MW is $5,348/kW. Table 11-1 summarizes the Cost Estimate categories for the IGCC/CCS Facility. 11-1
  • 96.
    TABLE 11-1 –BASE PLANT SITE CAPITAL COST ESTIMATE FOR IGCC/CCS Technology: IGCC/CCS Nominal Capacity (ISO): 520,000 kW Nominal Heat Rate (ISO): 10,700 Btu/kWh-HHV Capital Cost Category (000s) (October 1, 2010$) Total Project EPC 2,317,500 Owner Costs (excluding project finance) 463,500 Total Project Cost (excluding finance) 2,781,000 Total Project EPC / kW 4,458 Owner Costs 20% (excluding project finance) / kW 892 Total Project Cost (excluding project finance) / kW 5,348 (1) Includes engineering, distributable costs, scaffolding, construction management, and start-up. The locational considerations for the IGCC/CCS Facility are the same as those set forth in Section 10.4 for the IGCC Facility. Table 11-2 presents the IGCC/CCS Facility capital cost variations for alternative U.S. plant locations. 11-2
  • 97.
    TABLE 11-2 –LOCATION-BASED COSTS FOR IGCC/CCS (OCTOBER 1, 2010 DOLLARS) Base Project Location Delta Cost Total Location Cost Percent Difference Project Cost State City ($/kW) Variation ($/kW) ($/kW) Alaska Anchorage 5,350 23.1% 1,236 6,586 Alaska Fairbanks 5,350 22.9% 1,225 6,575 Alabama Huntsville 5,350 -7.4% (397) 4,953 Arizona Phoenix 5,350 -5.5% (293) 5,057 Arkansas Little Rock 5,350 -5.7% (306) 5,044 California Los Angeles 5,350 13.7% 732 6,082 California Redding 5,350 6.5% 348 5,698 California Bakersfield 5,350 6.1% 326 5,676 California Sacramento 5,350 11.1% 591 5,941 California San Francisco 5,350 30.7% 1,642 6,992 Colorado Denver 5,350 -6.3% (335) 5,015 Connecticut Hartford 5,350 17.7% 946 6,296 Delaware Dover 5,350 14.5% 774 6,124 District of Columbia Washington 5,350 23.0% 1,229 6,579 Florida Tallahassee 5,350 -10.5% (561) 4,789 Florida Tampa 5,350 -4.5% (243) 5,107 Georgia Atlanta 5,350 -8.1% (432) 4,918 Hawaii Honolulu 0 0 0 0 Idaho Boise 5,350 -4.2% (227) 5,123 Illinois Chicago 5,350 17.9% 959 6,309 Indiana Indianapolis 5,350 1.2% 67 5,417 Iowa Davenport 5,350 -1.5% (82) 5,268 Iowa Waterloo 5,350 -8.9% (474) 4,876 Kansas Wichita 5,350 -6.9% (370) 4,980 Kentucky Louisville 5,350 -5.8% (309) 5,041 Louisiana New Orleans 5,350 -10.8% (577) 4,773 Maine Portland 5,350 -2.8% (151) 5,199 Maryland Baltimore 5,350 1.1% 60 5,410 Massachusetts Boston 5,350 26.2% 1,402 6,752 Michigan Detroit 5,350 3.5% 185 5,535 Michigan Grand Rapids 5,350 -7.7% (413) 4,937 Minnesota St. Paul 5,350 3.4% 181 5,531 Mississippi Jackson 5,350 -7.4% (394) 4,956 Missouri St. Louis 5,350 5.5% 295 5,645 Missouri Kansas City 5,350 2.7% 145 5,495 Montana Great Falls 5,350 -4.8% (259) 5,091 Nebraska Omaha 5,350 -3.8% (201) 5,149 New Hampshire Concord 5,350 -2.2% (119) 5,231 New Jersey Newark 5,350 14.9% 795 6,145 11-3
  • 98.
    Base Project Location Delta Cost Total Location Cost Percent Difference Project Cost State City ($/kW) Variation ($/kW) ($/kW) New Mexico Albuquerque 5,350 -4.4% (235) 5,115 New York New York 5,350 31.4% 1,681 7,031 New York Syracuse 5,350 5.5% 295 5,645 Nevada Las Vegas 5,350 7.7% 410 5,760 North Carolina Charlotte 5,350 -10.1% (538) 4,812 North Dakota Bismarck 5,350 -7.8% (419) 4,931 Ohio Cincinnati 5,350 -1.5% (82) 5,268 Oregon Portland 5,350 6.2% 333 5,683 Pennsylvania Philadelphia 5,350 11.3% 602 5,952 Pennsylvania Wilkes-Barre 5,350 -4.1% (217) 5,133 Rhode Island Providence 5,350 3.4% 183 5,533 South Carolina Spartanburg 5,350 -12.0% (640) 4,710 South Dakota Rapid City 5,350 -10.5% (562) 4,788 Tennessee Knoxville 5,350 -9.1% (486) 4,864 Texas Houston 5,350 -9.3% (499) 4,851 Utah Salt Lake City 5,350 -4.6% (245) 5,105 Vermont Burlington 5,350 -5.8% (311) 5,039 Virginia Alexandria 5,350 4.5% 241 5,591 Virginia Lynchburg 5,350 -3.8% (203) 5,147 Washington Seattle 5,350 9.4% 505 5,855 Washington Spokane 5,350 -2.9% (154) 5,196 West Virginia Charleston 5,350 -2.1% (111) 5,239 Wisconsin Green Bay 5,350 -1.1% (58) 5,292 Wyoming Cheyenne 5,350 -0.5% (29) 5,321 Puerto Rico Cayey 0 0 0 0 11.5 O&M ESTIMATE The O&M methodology for the IGCC/CCS Facility is the same as that set forth in the section on the IGCC Facility, except that consideration needs to be made for the additional maintenance resulting from the CCS equipment. Table 11-3 presents the O&M expenses for the IGCC/CCS Facility. TABLE 11-3 – O&M EXPENSES FOR IGCC/CCS Technology: IGCC/CCS Fixed O&M Expense $69.30/kW-year Variable O&M Expense $8.04/MWh 11.6 ENVIRONMENTAL COMPLIANCE INFORMATION The environmental compliance strategy for the IGCC/CCS Facility is the same as that set forth in the section on the IGCC Facility, except for CCS including a two-stage Selexol AGR for capture of CO2. Table 11-4 presents environmental emissions for the IGCC/CCS Facility. 11-4
  • 99.
    TABLE 11-4 –ENVIRONMENTAL EMISSIONS FOR IGCC/CCS Technology: IGCC/CCS NOX 0.0075 lb/MMBtu SO2 0.015 lb/MMBtu CO2 20.6 lb/MMBtu 11-5
  • 100.
    12. ADVANCED NUCLEAR(AN) 12.1 MECHANICAL EQUIPMENT AND SYSTEMS The Advanced Nuclear (“AN”) Facility consists of two 1,117 MW Westinghouse AP1000 nuclear power units built in a brownfield (existing nuclear facility site). The steam cycle of a nuclear powered electric generation facility is similar to other steam-powered generating facilities. The difference is with the source of heat used to generate steam. In units that use fossil fuels, hydrocarbons are burned to heat water, producing steam. In the AP1000, splitting the nucleus (fission) of uranium atoms provides the energy to heat the water. Nuclear fuel is a uranium dioxide ceramic pellet encased in a zirconium alloy tube. The uranium atoms in the pellet absorb neutrons and split, or fission. When the uranium atom splits, a large amount of energy, as well as additional neutrons and fission fragments are released. The neutrons can be absorbed by other uranium atoms which fission, producing more neutrons. The chain reaction is controlled by controlling the number of neutrons available for fission. The number of neutrons available is controlled by the water in the nuclear reactor core, the arrangement of neutron absorbing control rods inserted into the core, the design of the core, and by controlling the void fraction and temperature of the coolant water (which both affect the density of water which affects the neutrons available for the fission process). The uranium fuel is contained inside a pressurized water reactor (“PWR”). The AP1000 is a two-loop PWR. The fission of the uranium fuel releases heat to the surrounding water (reactor cooling water), which under pressure does not boil, but through a heat exchanger (typically referred to as a steam generator) results in a lower pressure water (that in the “secondary loop”) to boil. The cooling water inside the PWR is circulated through the nuclear core by internal pumps. This cooling water system is termed the Reactor Coolant System (“RCS”). The RCS consists of two heat transfer circuits, with each circuit containing one Delta-125 steam generator, two reactor coolant pumps, and a single hot leg and two cold legs for circulating coolant between the reactor and the steam generators. The system also includes a pressurizer, interconnecting piping, and the valves and instrumentation necessary for operational control and the actuation of safeguards. Each AP1000 unit has a 130-foot diameter freestanding containment vessel with four ring sections and an upper and lower head. The passive core cooling system provides protection for the facility against RCS leaks and ruptures. The passive containment cooling system is the ultimate safety-related ultimate heat sink for the facility. The passive containment cooling system cools the containment following an accident to rapidly reduce the pressure via the natural circulation of air supplemented by water evaporation to transfer heat through the steel containment vessel. Main steam from the steam generator is routed to the HP section of the ST. The ST consists of a double-flow HP ST section and three double-flow LP ST sections in a tandem-compound configuration. As the steam exits the HP section it passes through a moisture separator and reheater. The moisture separator and reheater dries and reheats the steam before it enters the LP ST section, which improves the cycle efficiency and reduces moisture related erosion of the LP ST blades. A portion of the steam is extracted from the HP and LP sections of the ST and with 12-1
  • 101.
    ST exhaust heatsthe condensate and feedwater before it is sent back to the reactor. The HP and LP STs are connected via a common shaft that drives the generator which produces the electrical power output of approximately 1,100 MW per unit. The steam that exits the LP section of the ST, as well as the drains from the feedwater heaters, are directed to the condenser. The condenser is a surface condensing (tube type) heat exchanger that is maintained under vacuum to increase the turbine efficiency. The steam condenses on the outside of the tubes and condenser cooling water is circulated through the inside of the tubes. Numerous other systems are needed to support and provide redundancy for the cycle process described herein. These include the residual heat removal system, the HP core flooder system, and the LP core flooder system which are redundant systems and are designed to remove heat from the reactor core in the event the normal core cooling system fails. Other support systems include the liquid and solid radioactive waste systems which handle, control, and process radioactive waste from the plant. The reactor containment ventilation system controls and filters airborne radiation. Figure 12-1 presents a simplified process flow diagram for a PWR AN plant. FIGURE 12-1 – AN DESIGN CONFIGURATION 12.2 ELECTRICAL AND CONTROL SYSTEMS The AN Facility has one ST electric generator for each reactor. Each generator is a 60 Hz machine rated at approximately 1,250 MVA with an output voltage of 24 kV. The ST electric generator is connected through a generator circuit breaker to a GSU that is in turn connected between two circuit breakers in the high-voltage bus in the facility switchyard through a disconnect switch. The GSU increases the voltage from the electric generator from 24 kV to interconnected transmission system high voltage. 12-2
  • 102.
    The AN Facilityis controlled using a DCS. The DCS provides centralized control of the facility by integrating the control systems provided with the reactor, ST and associated electric generator and the control of BOP systems and equipment. 12.3 OFF-SITE REQUIREMENTS Water for all processes at the AN Facility is obtained from one of several available water supply options; however, water is typically sourced from an adjacent river, when possible. The AN Facility uses a water treatment system and a high-efficiency reverse osmosis system to reduce the dissolved solids from the cooling water and to provide distilled water. Wastewater is sent to an adjacent river or other approved wastewater delivery point. Further, the electrical interconnection from the AN on-site switchyard is effectuated by a connection to an adjacent utility substation. 12.4 CAPITAL COST ESTIMATE The base Cost Estimate for the AN Facility with a nominal capacity of 2,236 MW is $5,339/kW. Table 12-1 summarizes the Cost Estimate categories for the AN Facility. 12-3
  • 103.
    TABLE 12-1 –BASE PLANT SITE CAPITAL COST ESTIMATE FOR AN Technology: AN Nominal Capacity (ISO): 2,236,000 kW Nominal Heat Rate (ISO): N/A Btu/kWh-HHV Capital Cost Category (000s) (October 1, 2010$) Civil Structural Material and Installation 1,732,000 Mechanical Equipment Supply and Installation 3,400,000 Electrical / I&C Supply and Installation 630,000 Project Indirects (1) 2,722,500 EPC Cost before Contingency and Fee 8,484,500 Fee and Contingency 1,300,000 Total Project EPC 9,784,500 Owner Costs (excluding project finance) 2,152,590 Total Project Cost (excluding finance) 11,937,090 Total Project EPC / kW 4,376 Owner Costs 22% (excluding project finance) / kW 963 Total Project Cost (excluding project finance) / kW 5,339 (1) Includes engineering, distributable costs, scaffolding, construction management, and start-up. For this type of technology and power plant configuration, our regional adjustments took into consideration the following: seismic design differences, remote location issues, labor wage and productivity differences, location adjustments, owner cost differences, and the increase in overheads associated with these five adjustments. Seismic design differences among the various locations were based on U.S. seismic map information that detailed the various seismic zones throughout the U.S. No cost increases were associated with seismic Zone 0 and cost step increases were considered for Zones 1, 2, 3 and 4. Remote location issues are related to geographic areas that typically require installation of man camps, higher craft incentives, and higher per diems are generally required with respect to construction, due to the fact that such areas are long distances from urban areas, where labor is generally abundant. Remote location designations were also considered in locations where higher equipment freight costs are typically incurred, which for example are regions not near established rail or highway access. Remote locations related to the Advanced Nuclear Facility 12-4
  • 104.
    include Fairbanks, Alaska;Honolulu, Hawaii; Albuquerque, New Mexico; Cheyenne, Wyoming; and Cayey, Puerto Rico. Labor wage and productivity differences were handled as discussed in Section 2.5.1, taking into consideration the amount of labor we estimated for the AN Facility. Location adjustments were made to locations where higher cost of living levels are incurred and/or where population density generally correlates to higher construction costs for power and other infrastructure projects. These locations include Alaska, California, Connecticut, Delaware, District of Columbia, Hawaii, Illinois, Maine, Maryland, Massachusetts, Michigan, Minnesota, New York, Ohio, and Wisconsin. Owner costs were reviewed based on the need for utility upgrades and/or infrastructure costs such as new facility transmission lines to tie to existing utility transmission substations or existing transmission lines. Table 12-2 presents the AN Facility capital cost variations for alternative U.S. plant locations. TABLE 12-2 – LOCATION-BASED COSTS FOR AN (OCTOBER 1, 2010 DOLLARS) Base Project Location Delta Cost Total Location Cost Percent Difference Project Cost State City ($/kW) Variation ($/kW) ($/kW) Alaska Anchorage 5,340 16.3% 868 6,208 Alaska Fairbanks 5,340 16.4% 878 6,218 Alabama Huntsville 5,340 -3.3% (174) 5,166 Arizona Phoenix 5,340 -2.4% (126) 5,214 Arkansas Little Rock 5,340 -2.5% (131) 5,209 California Los Angeles 5,340 9.5% 505 5,845 California Redding 5,340 4.6% 245 5,585 California Bakersfield 5,340 4.4% 236 5,576 California Sacramento 5,340 6.5% 348 5,688 California San Francisco 5,340 20.9% 1,114 6,454 Colorado Denver 5,340 -2.6% (136) 5,204 Connecticut Hartford 5,340 14.7% 784 6,124 Delaware Dover 5,340 13.2% 707 6,047 District of Columbia Washington 5,340 23.9% 1,275 6,615 Florida Tallahassee 5,340 -4.6% (248) 5,092 Florida Tampa 5,340 -2.1% (114) 5,226 Georgia Atlanta 5,340 -3.5% (189) 5,151 Hawaii Honolulu 0 0 0 0 Idaho Boise 5,340 -1.6% (86) 5,254 Illinois Chicago 5,340 9.0% 479 5,819 Indiana Indianapolis 5,340 2.0% 108 5,448 Iowa Davenport 5,340 -0.6% (35) 5,305 Iowa Waterloo 5,340 -3.7% (200) 5,140 Kansas Wichita 5,340 -2.8% (151) 5,189 Kentucky Louisville 5,340 -2.4% (126) 5,214 12-5
  • 105.
    Base Project Location Delta Cost Total Location Cost Percent Difference Project Cost State City ($/kW) Variation ($/kW) ($/kW) Louisiana New Orleans 5,340 -4.8% (254) 5,086 Maine Portland 5,340 0.4% 21 5,361 Maryland Baltimore 5,340 3.4% 180 5,520 Massachusetts Boston 5,340 18.3% 976 6,316 Michigan Detroit 5,340 1.6% 83 5,423 Michigan Grand Rapids 5,340 -3.3% (174) 5,166 Minnesota St. Paul 5,340 1.9% 99 5,439 Mississippi Jackson 5,340 -3.2% (173) 5,167 Missouri St. Louis 5,340 2.8% 148 5,488 Missouri Kansas City 5,340 1.3% 70 5,410 Montana Great Falls 5,340 -1.9% (100) 5,240 Nebraska Omaha 5,340 -1.5% (80) 5,260 New Hampshire Concord 5,340 -0.8% (41) 5,299 New Jersey Newark 5,340 6.4% 340 5,680 New Mexico Albuquerque 5,340 -1.6% (83) 5,257 New York New York 5,340 13.4% 718 6,058 New York Syracuse 5,340 6.6% 355 5,695 Nevada Las Vegas 5,340 4.1% 220 5,560 North Carolina Charlotte 5,340 -4.1% (218) 5,122 North Dakota Bismarck 5,340 -3.3% (176) 5,164 Ohio Cincinnati 5,340 0.8% 45 5,385 Oregon Portland 5,340 4.5% 239 5,579 Pennsylvania Philadelphia 5,340 4.9% 263 5,603 Pennsylvania Wilkes-Barre 5,340 -1.5% (82) 5,258 Rhode Island Providence 5,340 1.6% 87 5,427 South Carolina Spartanburg 5,340 -5.1% (272) 5,068 South Dakota Rapid City 5,340 -4.4% (237) 5,103 Tennessee Knoxville 5,340 -3.7% (200) 5,140 Texas Houston 5,340 -3.9% (210) 5,130 Utah Salt Lake City 5,340 -1.5% (80) 5,260 Vermont Burlington 5,340 -2.3% (122) 5,218 Virginia Alexandria 5,340 6.2% 332 5,672 Virginia Lynchburg 5,340 -0.1% (6) 5,334 Washington Seattle 5,340 5.8% 311 5,651 Washington Spokane 5,340 -1.0% (56) 5,284 West Virginia Charleston 5,340 -0.8% (42) 5,298 Wisconsin Green Bay 5,340 1.0% 51 5,391 Wyoming Cheyenne 5,340 3.5% 188 5,528 Puerto Rico Cayey 0 0 0 0 12-6
  • 106.
    12.5 O&M ESTIMATE Inaddition to the general items discussed in the section of this report entitled O&M Estimate, the AN Facility includes provisions for major maintenance on the steam generators, STs, electric generators, BOP systems, and the reactor (beyond refueling). Table 12-3 presents the O&M expenses for the AN Facility. TABLE 12-3 – O&M EXPENSES FOR AN Technology: AN Fixed O&M Expense $88.75/kW-year Variable O&M Expense $2.04/MWh 12.6 ENVIRONMENTAL COMPLIANCE INFORMATION Environmental compliance with respect to air emissions is effectively not necessary for the AN Facility, as this technology does not combust a fuel as is the case for other non-renewable power technologies. While there are environmental compliance considerations for a given nuclear facility (e.g., spent nuclear fuel), only air emissions were considered in this report. Table 12-4 presents environmental emissions for the AN Facility. TABLE 12-4 – ENVIRONMENTAL EMISSIONS FOR AN Technology: AN NOX 0 lb/MMBtu SO2 0 lb/MMBtu CO2 0 lb/MMBtu 12-7
  • 107.
    13. BIOMASS COMBINEDCYCLE (BCC) 13.1 MECHANICAL EQUIPMENT AND SYSTEMS The Biomass Combined-Cycle (“BCC”) Facility utilizes approximately 500 tons per day of wood (at 25 percent moisture), or 370 dry tons per day for the production of 20 MW net of electricity. The facility consists of a biomass gasification system for the conversion of the wood to syngas, a clean-up system for the syngas, and a combined-cycle plant using the syngas as fuel. The gasification system consists of dual circulating fluid bed (“CFB”) units (one gasifier and one combustor) connected by a sand circulation system. Related equipment includes the wood feed system, the product gas quench, ash handling, steam supply and typical BOP equipment. The wood is fed to the circulating fluid bed gasifier through a standard system of lock hoppers, live bottom bins and feed screws. The lock hoppers are purged with nitrogen to keep the produced fuel gas from escaping. The gasifier is a refractory-lined vessel with a sand-type carrier and requires a LP steam source. The primary purpose of the steam is to maintain a reducing environment in the gasifier to enable pure gasification and not partial oxidation conditions. The gasification CFB is essentially an entrained flow reactor, which operates between 1,400F and 1,500F. The two products of the gasifier are a medium-heating value gas (approximately 450 Btu/scf dry) and non-converted char. A small amount of condensable “tars” are also produced. The gases are directed to a clean-up system to remove the entrained tars. The CFB combustor unit burns the char produced in the gasifier. The char combustor operates at approximately 1,800F. The flue gas from the char combustor goes to a boiler to recover the excess sensible energy. The two CFBs are connected by the sand circulation system. The purpose of this system is to transfer the char and circulating sand from the gasifier to the combustor, where the char is burned to reheat the sand. This hotter sand is then returned to the gasifier to provide the energy to convert the solid wood to a gas. The sand transfer system consists of mechanical cyclones (two in series for each CFB) and a sand inventory pot for each leg of the configuration. An overflow system, with some fluidizing steam in the pot, is used to regulate the flow from the gasifier to the combustor. The syngas clean-up system consists of a reformer to convert the tars and other hydrocarbons to CO and hydrogen in an isothermal fluidized bed reactor. The hot syngas is cooled by producing steam to be used in the combined cycle. A wet scrubber removes particulates, NH3 and residual tars. The excess scrubber water is sent off-site to a wastewater treatment facility. The syngas is then compressed to the required pressure for use in the CT. The BCC Facility is based on a single CT, which produces approximately 15 MW of electricity. The CT exhaust is sent to an HRSG. The HRSG is equipped with an SCR to reduce NOX emissions. Both the steam generated in the HRSG and the steam generated the cooling of the combustion flue gas and the syngas are superheated and sent to the ST. The ST output is approximately 9 MW. The total gross output is approximately 24 MW. The internal power load is approximately 4 MW for a net power output of about 20 MW. 13-1
  • 108.
    Nitrogen is requiredfor start-up and shutdown. A separate steam system is required for start-up. NH3 is required for operation of the two SCRs for reducing NOX emissions. A flare system is required for normal operation to eliminate volatile organics from the scrubbing system, and for start-up and shutdown of the process. Figure 13-1 presents the BCC process flow diagram, where the “Power Block” is based on a traditional combined-cycle configuration, as is often the case for gasification derivative plants. FIGURE 13-1 – BCC DESIGN CONFIGURATION 13.2 ELECTRICAL AND CONTROL SYSTEMS The BCC Facility has one CT electric generator and one ST electric generator. The generator for the CT is a 60 Hz machine rated at approximately 17 MVA with an output voltage of 13.8 kV. The ST electric generator is a 60 Hz machine rated at approximately 10 MVA with an output voltage of 13.8 kV. The generator breakers for the CT and ST electric generators are bussed together in 15 kV class switchgear that is connected to a high-voltage transmission system at the facility switchyard via a circuit breaker, GSU, and a disconnect switch. The GSU increases the voltage from the electric generators from 13.8 kV to interconnected transmission system high voltage. The BCC Facility is controlled using a DCS. The DCS provides centralized control of the facility by integrating the control systems provided with each individual CT and associated 13-2
  • 109.
    electric generator, STand associated electric generator, and the control of BOP systems and equipment. 13.3 OFF-SITE REQUIREMENTS Biomass is delivered to the BCC Facility by rail, truck or barge. Water for all processes at the BCC Facility is obtained from one of several available water sources. The BCC Facility uses a water treatment system and a high-efficiency reverse osmosis system to reduce the dissolved solids from the cooling water and to provide distilled water for HRSG makeup. Wastewater is sent to a municipal wastewater system or other available wastewater delivery point. Further, the electrical interconnection from the BCC Facility on-site switchyard is effectuated by a connection to an adjacent utility substation. 13.4 CAPITAL COST ESTIMATE The base Cost Estimate for the BCC Facility with a nominal capacity of 20 MW is $7,573/kW. Table 13-1 summarizes the Cost Estimate categories for the BCC Facility. 13-3
  • 110.
    TABLE 13-1 –BASE PLANT SITE CAPITAL COST ESTIMATE FOR BCC Technology: BCC Nominal Capacity (ISO): 20,000 kW Nominal Heat Rate (ISO): 12,350 Btu/kWh-HHV Capital Cost Category (000s) (October 1, 2010$) Civil Structural Material and Installation 16,459 Mechanical Equipment Supply and Installation 70,137 Electrical / I&C Supply and Installation 11,267 Project Indirects (1) 21,207 EPC Cost before Contingency and Fee 119,070 Fee and Contingency 12,500 Total Project EPC 131,570 Owner Costs (excluding project finance) 26,314 Total Project Cost (excluding finance) 157,884 Total Project EPC / kW 6,578 Owner Costs 20% (excluding project finance) / kW 1,316 Total Project Cost (excluding project finance) / kW 7,894 (1) Includes engineering, distributable costs, scaffolding, construction management, and start-up. For this type of technology and power plant configuration, our regional adjustments took into consideration the following: outdoor installation considerations, seismic design differences, remote location issues, labor wage and productivity differences, location adjustments, owner cost differences, and the increase in overheads associated with these six adjustments. Outdoor installation locations are considered in geographic areas where enclosed structures for the boilers would not be required due to the low probability of freezing. The locations that included outdoor installation are Alabama, Arizona, Arkansas, Florida, Georgia, Hawaii, Louisiana, Mississippi, New Mexico, South Carolina, and Puerto Rico. Seismic design differences among the various locations were based on U.S. seismic map information that detailed the various seismic zones throughout the U.S. No cost increases were associated with seismic Zone 0 and cost step increases were considered for Zones 1, 2, 3 and 4. 13-4
  • 111.
    Remote location issuesare related to geographic areas that typically require installation of man camps, higher craft incentives, and higher per diems are generally required with respect to construction, due to the fact that such areas are long distances from urban areas, where labor is generally abundant. Remote location designations were also considered in locations where higher equipment freight costs are typically incurred, which for example are regions not near established rail or highway access. Remote locations related to the BCC include Fairbanks, Alaska; Honolulu, Hawaii; Albuquerque, New Mexico; Cheyenne, Wyoming; and Cayey, Puerto Rico. Labor wage and productivity differences were handled as discussed in Section 2.5.1, taking into consideration the amount of labor we estimated for the BCC Facility. Location adjustments were made to locations where higher cost of living levels are incurred and/or where population density generally correlates to higher construction costs for power and other infrastructure projects. These locations include Alaska, California, Connecticut, Delaware, District of Columbia, Hawaii, Illinois, Maine, Maryland, Massachusetts, Michigan, Minnesota, New York, Ohio, and Wisconsin. Owner costs were reviewed based on the need for utility upgrades and/or infrastructure costs such as new facility transmission lines to tie to existing utility transmission substations or existing transmission lines. Table 13-2 presents the BCC Facility capital cost variations for alternative U.S. plant locations. 13-5
  • 112.
    TABLE 13-2 –LOCATION-BASED COSTS FOR BCC (OCTOBER 1, 2010 DOLLARS) Base Project Location Delta Cost Total Location Cost Percent Difference Project Cost State City ($/kW) Variation ($/kW) ($/kW) Alaska Anchorage 7,900 14.0% 1,104 9,004 Alaska Fairbanks 7,900 15.2% 1,197 9,097 Alabama Huntsville 7,900 -6.0% (472) 7,428 Arizona Phoenix 0 0.0% 0 0 Arkansas Little Rock 7,900 -5.0% (392) 7,508 California Los Angeles 7,900 7.2% 566 8,466 California Redding 7,900 3.3% 262 8,162 California Bakersfield 7,900 3.0% 237 8,137 California Sacramento 7,900 6.8% 539 8,439 California San Francisco 7,900 19.6% 1,547 9,447 Colorado Denver 7,900 -9.2% (724) 7,176 Connecticut Hartford 7,900 11.9% 940 8,840 Delaware Dover 7,900 9.7% 768 8,668 District of Columbia Washington 7,900 15.1% 1,196 9,096 Florida Tallahassee 7,900 -8.0% (635) 7,265 Florida Tampa 7,900 -3.5% (274) 7,626 Georgia Atlanta 7,900 -6.5% (511) 7,389 Hawaii Honolulu 7,900 29.3% 2,311 10,211 Idaho Boise 7,900 -3.9% (304) 7,596 Illinois Chicago 7,900 13.6% 1,073 8,973 Indiana Indianapolis 7,900 0.4% 35 7,935 Iowa Davenport 7,900 -1.2% (93) 7,807 Iowa Waterloo 7,900 -6.8% (539) 7,361 Kansas Wichita 7,900 -5.6% (444) 7,456 Kentucky Louisville 7,900 -4.7% (375) 7,525 Louisiana New Orleans 7,900 -8.3% (653) 7,247 Maine Portland 7,900 -3.0% (236) 7,664 Maryland Baltimore 7,900 0.1% 10 7,910 Massachusetts Boston 7,900 18.5% 1,459 9,359 Michigan Detroit 7,900 2.4% 188 8,088 Michigan Grand Rapids 7,900 -5.9% (469) 7,431 Minnesota St. Paul 7,900 2.5% 200 8,100 Mississippi Jackson 7,900 -5.9% (469) 7,431 Missouri St. Louis 7,900 2.8% 220 8,120 Missouri Kansas City 7,900 1.5% 119 8,019 Montana Great Falls 7,900 -4.8% (379) 7,521 Nebraska Omaha 7,900 -3.2% (252) 7,648 New Hampshire Concord 7,900 -2.3% (182) 7,718 New Jersey Newark 7,900 11.2% 882 8,782 13-6
  • 113.
    Base Project Location Delta Cost Total Location Cost Percent Difference Project Cost State City ($/kW) Variation ($/kW) ($/kW) New Mexico Albuquerque 0 0.0% 0 0 New York New York 7,900 23.6% 1,866 9,766 New York Syracuse 7,900 3.3% 259 8,159 Nevada Las Vegas 0 0.0% 0 0 North Carolina Charlotte 7,900 -8.3% (658) 7,242 North Dakota Bismarck 7,900 -6.0% (476) 7,424 Ohio Cincinnati 7,900 -1.7% (134) 7,766 Oregon Portland 7,900 3.1% 246 8,146 Pennsylvania Philadelphia 7,900 8.1% 639 8,539 Pennsylvania Wilkes-Barre 7,900 -3.7% (293) 7,607 Rhode Island Providence 7,900 2.1% 162 8,062 South Carolina Spartanburg 7,900 -9.8% (771) 7,129 South Dakota Rapid City 7,900 -8.1% (639) 7,261 Tennessee Knoxville 7,900 -7.3% (575) 7,325 Texas Houston 7,900 -7.2% (568) 7,332 Utah Salt Lake City 0 0.0% 0 0 Vermont Burlington 7,900 -5.1% (400) 7,500 Virginia Alexandria 7,900 2.5% 198 8,098 Virginia Lynchburg 7,900 -3.4% (271) 7,629 Washington Seattle 7,900 5.6% 441 8,341 Washington Spokane 7,900 -2.8% (222) 7,678 West Virginia Charleston 7,900 -1.9% (149) 7,751 Wisconsin Green Bay 7,900 -1.1% (83) 7,817 Wyoming Cheyenne 0 0.0% 0 0 Puerto Rico Cayey 7,900 -3.7% (290) 7,610 13.5 O&M ESTIMATE In addition to the general items discussed in the section of this report entitled O&M Estimate, the BCC Facility include the major maintenance for the CT, as well as the BOP, including the ST, associated electric generator, HRSG, and emissions reduction catalysts. These major maintenance expenses are included with the VOM expense for this technology and are given on an average basis across the MWhs incurred. Typically, significant overhauls on a BCC Facility occur no less frequently than 8,000 operating hour intervals, with more significant major outages occurring on 24,000 hour intervals. Additionally, major maintenance needs to be completed on the gasifier, including the refractory, which due to the lower operating temperature (as compared to the IGCC Facility discussed above) only needs replacing approximately every 10 years. Table 13-3 presents the O&M expenses for the BCC Facility. TABLE 13-3 – O&M EXPENSES FOR BCC Technology: BCC Fixed O&M Expense $338.79/kW-year Variable O&M Expense $16.64/MWh 13-7
  • 114.
    13.6 ENVIRONMENTAL COMPLIANCEINFORMATION The BCC Facility utilizes syngas combustors (which do not have DLN) in the CT and best available burner technology with respect to the duct burners in the HRSGs to manage the production of NOX and CO. Additional control of NOX and CO is accomplished through an SCR and an oxidization catalyst, respectively. SO2 in the IGCC is managed through the use of low- sulfur biomass feedstocks. The BCC does not include any control devices for CO2, which is proportional to the heat rate (inversely proportional to the efficiency) of the technology. Water, wastewater, and solid waste compliance are achieved through traditional on-site and off-site methods, and the costs for such compliance are included in the O&M Estimate for the BCC Facility. Table 13-4 presents environmental emissions for the BCC Facility. TABLE 13-4 – ENVIRONMENTAL EMISSIONS FOR BCC Technology: BCC NOX 0.054 lb/MMBtu SO2 0 lb/MMBtu CO2 195 lb/MMBtu 13-8
  • 115.
    14. BIOMASS BUBBLINGFLUIZED BED (BBFB) 14.1 MECHANICAL EQUIPMENT AND SYSTEMS The Biomass BFB (“BBFB”) Facility utilizes approximately 2,000 tons per day of wood (at 50 percent maximum moisture) for the production of 50 MW net of electricity. The BBFB Facility consists of a BFB boiler, which will flow to the ST. Steam leaving the ST will be condensed to water in a shell and tube surface condenser. The water will be pumped from the “hotwell” of the condenser through a series of feedwater heaters for purposes of pre-heating the water with ST extraction steam. The combination of feedwater heating and waste heat flowing through the economizer is included to improve cycle efficiency. The water will enter the first feedwater heater where it will be heated using extraction steam from the ST. The water will then flow to the deaerating feedwater heater and into an electric-driven boiler feed pump where the pressure of the water will be increased to approximately 1,800 psia. After leaving the boiler feed pump, the water will flow through two more feedwater heaters. After exiting the last feedwater heater, the water will flow to the economizer section of the BFB boiler for delivery to the combustion section where it will be converted back to steam and the cycle will be repeated. The cooling tower is to be used to cool the circulating water that is used to condense the steam inside the condenser. In a BFB boiler, a portion of air is introduced through the bottom of the combustor. The bottom of the bed is supported by refractory walls or water-cooled membrane with specially designed air nozzles which distribute the air uniformly. The fuel and limestone are fed into the lower bed. In the presence of fluidizing air, the fuel and limestone quickly and uniformly mix under the turbulent environment and behave like a fluid. Carbon particles in the fuel are exposed to the combustion air. The balance of combustion air is introduced at the top of the lower, dense bed. This staged combustion limits the formation of NOX. The advantages of BFB boiler technology include fuel flexibility, low SO2 emissions, low NOX emissions, and high combustion efficiency. FIGURE 14-1 – BCC DESIGN CONFIGURATION 14-1
  • 116.
    14.2 ELECTRICAL ANDCONTROL SYSTEMS The BBFB Facility has one ST electric generator. The generator for the ST is a 60 Hz machine rated at approximately 65 MVA with an output voltage of 13.8 kV. The generator breakers for the ST electric generator are bussed together in 15 kV class switchgear that is connected to a high-voltage transmission system at the facility switchyard via a circuit breaker, GSU, and a disconnect switch. The GSU increases the voltage from the electric generators from 13.8 kV to interconnected transmission system high voltage. The BBFB Facility is controlled using a DCS. The DCS provides centralized control of the facility by integrating the control systems provided with the ST and associated electric generator and the control of BOP systems and equipment. 14.3 OFF-SITE REQUIREMENTS Biomass is delivered to the BBFBFacility by rail, truck or barge. Water for all processes at the BBFB Facility is obtained from one of several available water sources. The BBFB Facility uses a water treatment system and a high-efficiency reverse osmosis system to reduce the dissolved solids from the cooling water and to provide distilled water for HRSG makeup. Wastewater is sent to a municipal wastewater system or other available wastewater delivery point. Further, the electrical interconnection from the BBFB Facility on-site switchyard is effectuated by a connection to an adjacent utility substation. 14.4 CAPITAL COST ESTIMATE The base Cost Estimate for the BBFB Facility with a nominal capacity of 50 MW is $3,860/kW. Table 14-1 summarizes the Cost Estimate categories for the BBFB Facility. 14-2
  • 117.
    TABLE 14-1 –BASE PLANT SITE CAPITAL COST ESTIMATE FOR BBFB Technology: BBFB Nominal Capacity (ISO): 50,000 kW Nominal Heat Rate (ISO): 13,500 Btu/kWh-HHV Capital Cost Category (000s) (October 1, 2010$) Civil Structural Material and Installation 13,650 Mechanical Equipment Supply and Installation 67,200 Electrical / I&C Supply and Installation 20,000 Project Indirects (1) 40,250 EPC Cost before Contingency and Fee 141,100 Fee and Contingency 19,754 Total Project EPC 160,854 Owner Costs (excluding project finance) 32,171 Total Project Cost (excluding finance) 193,025 Total Project EPC / kW 3,217 Owner Costs 20% (excluding project finance) / kW 643 Total Project Cost (excluding project finance) / kW 3,860 (1) Includes engineering, distributable costs, scaffolding, construction management, and start-up. For this type of technology and power plant configuration, our regional adjustments took into consideration the following: outdoor installation considerations, seismic design differences, remote location issues, labor wage and productivity differences, location adjustments, owner cost differences, and the increase in overheads associated with these six adjustments. Outdoor installation locations are considered in geographic areas where enclosed structures for the boilers would not be required due to the low probability of freezing. The locations that included outdoor installation are Alabama, Arizona, Arkansas, Florida, Georgia, Hawaii, Louisiana, Mississippi, New Mexico, South Carolina, and Puerto Rico. Seismic design differences among the various locations were based on U.S. seismic map information that detailed the various seismic zones throughout the U.S. No cost increases were associated with seismic Zone 0 and cost step increases were considered for Zones 1, 2, 3 and 4. 14-3
  • 118.
    Remote location issuesare related to geographic areas that typically require installation of man camps, higher craft incentives, and higher per diems are generally required with respect to construction, due to the fact that such areas are long distances from urban areas, where labor is generally abundant. Remote location designations were also considered in locations where higher equipment freight costs are typically incurred, which for example are regions not near established rail or highway access. Remote locations related to the BCC include Fairbanks, Alaska; Honolulu, Hawaii; Albuquerque, New Mexico; Cheyenne, Wyoming; and Cayey, Puerto Rico. Labor wage and productivity differences were handled as discussed in Section 2.5.1, taking into consideration the amount of labor we estimated for the BCC Facility. Location adjustments were made to locations where higher cost of living levels are incurred and/or where population density generally correlates to higher construction costs for power and other infrastructure projects. These locations include Alaska, California, Connecticut, Delaware, District of Columbia, Hawaii, Illinois, Maine, Maryland, Massachusetts, Michigan, Minnesota, New York, Ohio, and Wisconsin. Owner costs were reviewed based on the need for utility upgrades and/or infrastructure costs such as new facility transmission lines to tie to existing utility transmission substations or existing transmission lines. Table 14-2 presents the BBFB Facility capital cost variations for alternative U.S. plant locations. 14-4
  • 119.
    TABLE 14-2– LOCATION-BASEDCOSTS FOR BBFB (OCTOBER 1, 2010 DOLLARS) Base Project Location Delta Cost Total Location Cost Percent Difference Project Cost State City ($/kW) Variation ($/kW) ($/kW) Alaska Anchorage 3,860 25.8% 995 4,855 Alaska Fairbanks 3,860 27.9% 1,076 4,936 Alabama Huntsville 3,860 -9.7% (376) 3,484 Arizona Phoenix 0 0.0% 0 0 Arkansas Little Rock 3,860 -8.1% (311) 3,549 California Los Angeles 3,860 13.4% 516 4,376 California Redding 3,860 6.3% 242 4,102 California Bakersfield 3,860 5.7% 221 4,081 California Sacramento 3,860 11.9% 460 4,320 California San Francisco 3,860 35.6% 1,373 5,233 Colorado Denver 3,860 -8.2% (318) 3,542 Connecticut Hartford 3,860 22.9% 882 4,742 Delaware Dover 3,860 19.3% 745 4,605 District of Columbia Washington 3,860 31.6% 1,219 5,079 Florida Tallahassee 3,860 -13.1% (506) 3,354 Florida Tampa 3,860 -5.7% (221) 3,639 Georgia Atlanta 3,860 -10.5% (407) 3,453 Hawaii Honolulu 3,860 58.2% 2,248 6,108 Idaho Boise 3,860 -6.2% (238) 3,622 Illinois Chicago 3,860 22.7% 875 4,735 Indiana Indianapolis 3,860 1.5% 56 3,916 Iowa Davenport 3,860 -1.9% (74) 3,786 Iowa Waterloo 3,860 -11.0% (426) 3,434 Kansas Wichita 3,860 -9.1% (350) 3,510 Kentucky Louisville 3,860 -7.6% (295) 3,565 Louisiana New Orleans 3,860 -13.5% (520) 3,340 Maine Portland 3,860 -4.0% (156) 3,704 Maryland Baltimore 3,860 1.6% 63 3,923 Massachusetts Boston 3,860 33.5% 1,292 5,152 Michigan Detroit 3,860 3.9% 150 4,010 Michigan Grand Rapids 3,860 -9.6% (371) 3,489 Minnesota St. Paul 3,860 4.3% 166 4,026 Mississippi Jackson 3,860 -9.7% (373) 3,487 Missouri St. Louis 3,860 4.7% 181 4,041 Missouri Kansas City 3,860 2.5% 96 3,956 Montana Great Falls 3,860 -4.8% (185) 3,675 Nebraska Omaha 3,860 -5.1% (198) 3,662 New Hampshire Concord 3,860 -3.6% (141) 3,719 New Jersey Newark 3,860 18.1% 698 4,558 14-5
  • 120.
    Base Project Location Delta Cost Total Location Cost Percent Difference Project Cost State City ($/kW) Variation ($/kW) ($/kW) New Mexico Albuquerque 3,860 0.0% (3,860) - New York New York 3,860 38.3% 1,477 5,337 New York Syracuse 3,860 7.5% 288 4,148 Nevada Las Vegas 0 0.0% 0 0 North Carolina Charlotte 3,860 -13.4% (517) 3,343 North Dakota Bismarck 3,860 -9.7% (376) 3,484 Ohio Cincinnati 3,860 -2.0% (77) 3,783 Oregon Portland 3,860 5.9% 228 4,088 Pennsylvania Philadelphia 3,860 13.1% 507 4,367 Pennsylvania Wilkes-Barre 3,860 -5.9% (229) 3,631 Rhode Island Providence 3,860 3.4% 131 3,991 South Carolina Spartanburg 3,860 -15.8% (611) 3,249 South Dakota Rapid City 3,860 -13.1% (505) 3,355 Tennessee Knoxville 3,860 -11.7% (453) 3,407 Texas Houston 3,860 -11.6% (449) 3,411 Utah Salt Lake City 0 0.0% 0 0 Vermont Burlington 3,860 -8.1% (314) 3,546 Virginia Alexandria 3,860 6.2% 240 4,100 Virginia Lynchburg 3,860 -4.8% (186) 3,674 Washington Seattle 3,860 9.9% 382 4,242 Washington Spokane 3,860 -4.5% (172) 3,688 West Virginia Charleston 3,860 -3.0% (117) 3,743 Wisconsin Green Bay 3,860 -1.0% (39) 3,821 Wyoming Cheyenne 0 0.0% 0 0 Puerto Rico Cayey 3,860 -5.5% (213) 3,647 14.5 O&M ESTIMATE In addition to the general items discussed in the section of this report entitled O&M Estimate, the BBFB Facility includes the major maintenance for the ST and associated electric generator, as well as the BOP. These major maintenance expenses are included with the VOM expense for this technology and are given on an average basis across the MWhs incurred. Typically, significant overhauls on a BBFB Facility occur no less frequently than 6 to 8 years. Table 14-3 presents the O&M expenses for the BBFB Facility. TABLE 14-3 – O&M EXPENSES FOR BCC Technology: BCC Fixed O&M Expense $100.50/kW-year Variable O&M Expense $5.0/MWh 14-6
  • 121.
    14.6 ENVIRONMENTAL COMPLIANCEINFORMATION The BBFB Facility utilizes BFB combustion to control NOX and CO. SO2 in the BFB is managed through the use of low-sulfur biomass feedstocks. The BBFB Facility does not include any control devices for CO2, which is proportional to the heat rate (inversely proportional to the efficiency) of the technology. Water, wastewater, and solid waste compliance are achieved through traditional on-site and off-site methods, and the costs for such compliance are included in the O&M Estimate for the BBFB Facility. Table 14-4 presents environmental emissions for the BBFB Facility. TABLE 14-4 – ENVIRONMENTAL EMISSIONS FOR BBFB Technology: BBFB NOX 0.08 lb/MMBtu SO2 0 lb/MMBtu CO2 195 lb/MMBtu 14-7
  • 122.
    15. FUEL CELL(FC) MECHANICAL EQUIPMENT AND SYSTEMS The Fuel Cell (“FC”) Facility utilizes multiple phosphoric acid fuel cell units, each with a power output of 400 kW, for a total output of 10 MW. The fuel cells convert chemical energy directly into electricity from natural gas and air vapor and produce heat and water vapor as byproducts. The fuel (the reactant) is introduced continuously to the anode side of the unit cell while air (the oxidant) is introduced continuously into the cathode side via a blower. In a fuel cell, electricity is produced by ionic transfer across an electrolyte that separates the fuel from the air. A high temperature fuel cell produces electricity by splitting a molecule of the oxidant into its ionic components at the cathode, passing ions through the electrolyte (e.g. in the case of the FC Facility, a phosphoric acid ion) and then reacting the ions with the fuel at the anode to produce heat to allow the reaction to occur. During this ionic transfer process, two electrons are stripped from each ion to which develops a voltage and current. Since each fuel cell develops a relatively low voltage, the cells are stacked to produce a higher, more useful voltage. Depending on the type of fuel cell, high temperature waste heat from the process may be available for cogeneration applications. Figure 15-1 presents the fuel cell process flow diagram. FIGURE 15-1 – FC DESIGN CONFIGURATION 15.1 ELECTRICAL AND CONTROL SYSTEMS Each fuel cell stack generates DC electric power. These stacks are connected to DC-to-AC inverters that produce an output of 60 Hz, three-phase 480 volt (“V”) AC electric power voltage. The inverters also provide power quality control and protection when designed to IEEE Standards. The fuel cell units are connected through circuit breakers to a switchgear bus that combines the output of the fuel cell units for a total output of 10 MW. The switchgear is connected through a circuit breaker to the local utility distribution system. Each individual fuel cell module has its own autonomous control system with an overall data acquisition system for the combined FC Facility. 15.2 OFF-SITE REQUIREMENTS Natural gas is delivered to the FC Facility through a lateral or in an urban environment, potentially through the local distribution company infrastructure. Water for all processes at the 15-1
  • 123.
    FC Facility isobtained from one of several available water sources, but given that the water needs are low, a municipal (potable) water source would be preferable. Wastewater is sent to a municipal wastewater system. Further, the electrical interconnection from the FC Facility is into the local grid distribution infrastructure. 15.3 CAPITAL COST ESTIMATE The base Cost Estimate for the FC Facility with a nominal capacity of 10 MW is $9,960/kW. Table 15-1 summarizes the Cost Estimate categories for the FC Facility. TABLE 15-1 – BASE PLANT SITE CAPITAL COST ESTIMATE FOR FC Technology: FC Nominal Capacity (ISO): 10,000 kW Nominal Heat Rate (ISO): 9,500 Btu/kWh-HHV Capital Cost Category (000s) (October 1, 2010$) Civil Structural Material and Installation 3,148 Mechanical Equipment Supply and Installation 49,925 Electrical / I&C Supply and Installation 2,050 Project Indirects (1) 3,473 EPC Cost before Contingency and Fee 58,596 Fee and Contingency 4,688 Total Project EPC 63,284 Owner Costs (excluding project finance) 5,063 Total Project Cost (excluding finance) 68,347 Total Project EPC / kW 6,328 Owner Costs 8% (excluding project finance) / kW 500 Total Project Cost (excluding project finance) / kW 6,835 (1) Includes engineering, distributable costs, scaffolding, construction management, and start-up. For this type of technology and power plant configuration, our regional adjustments took into consideration the following: seismic design differences, remote location issues, labor wage and productivity differences, location adjustments, owner cost differences, and the increase in overheads associated with these five adjustments. 15-2
  • 124.
    Seismic design differencesamong the various locations were based on U.S. seismic map information that detailed the various seismic zones throughout the U.S. No cost increases were associated with seismic Zone 0 and cost step increases were considered for Zones 1, 2, 3 and 4. Remote location issues are related to geographic areas that typically require installation of man camps, higher craft incentives, and higher per diems are generally required with respect to construction, due to the fact that such areas are long distances from urban areas, where labor is generally abundant. Remote location designations were also considered in locations where higher equipment freight costs are typically incurred, which for example are regions not near established rail or highway access. Remote locations related to the FC Facility include Fairbanks, Alaska; Honolulu, Hawaii; Albuquerque, New Mexico; Cheyenne, Wyoming; and Cayey, Puerto Rico. Labor wage and productivity differences were handled as discussed in Section 2.5.1, taking into consideration the amount of labor we estimated for the FC Facility. Location adjustments were made to locations where higher cost of living levels are incurred and/or where population density generally correlates to higher construction costs for power and other infrastructure projects. These locations include Alaska, California, Connecticut, Delaware, District of Columbia, Hawaii, Illinois, Maine, Maryland, Massachusetts, Michigan, Minnesota, New York, Ohio, and Wisconsin. Owner costs were reviewed based on the need for utility upgrades and/or infrastructure costs such as new facility transmission lines to tie to existing utility transmission substations or existing transmission lines. Table 15-2 presents the FC Facility capital cost variations for alternative U.S. plant locations. 15-3
  • 125.
    TABLE 15-2 –LOCATION-BASED COSTS FOR FC (OCTOBER 1, 2010 DOLLARS) Base Project Location Delta Cost Total Location Cost Percent Difference Project Cost State City ($/kW) Variation ($/kW) ($/kW) Alaska Anchorage 6,835 12.7% 871 7,706 Alaska Fairbanks 6,835 18.4% 1,255 8,090 Alabama Huntsville 6,835 -4.6% (312) 6,523 Arizona Phoenix 6,835 -3.5% (240) 6,595 Arkansas Little Rock 6,835 -3.7% (251) 6,584 California Los Angeles 6,835 4.3% 293 7,128 California Redding 6,835 1.7% 119 6,954 California Bakersfield 6,835 2.2% 150 6,985 California Sacramento 6,835 4.6% 313 7,148 California San Francisco 6,835 10.7% 733 7,568 Colorado Denver 6,835 -4.1% (278) 6,557 Connecticut Hartford 6,835 4.4% 299 7,134 Delaware Dover 6,835 2.4% 166 7,001 District of Columbia Washington 6,835 1.9% 127 6,962 Florida Tallahassee 6,835 -6.3% (432) 6,403 Florida Tampa 6,835 -2.6% (179) 6,656 Georgia Atlanta 6,835 -5.0% (340) 6,495 Hawaii Honolulu 6,835 12.0% 817 7,652 Idaho Boise 6,835 -3.0% (203) 6,632 Illinois Chicago 6,835 10.0% 681 7,516 Indiana Indianapolis 6,835 -0.6% (42) 6,793 Iowa Davenport 6,835 -1.0% (65) 6,770 Iowa Waterloo 6,835 -5.5% (378) 6,457 Kansas Wichita 6,835 -4.5% (306) 6,529 Kentucky Louisville 6,835 -3.8% (258) 6,577 Louisiana New Orleans 6,835 -6.5% (445) 6,390 Maine Portland 6,835 -2.4% (162) 6,673 Maryland Baltimore 6,835 -1.3% (86) 6,749 Massachusetts Boston 6,835 9.7% 662 7,497 Michigan Detroit 6,835 2.3% 156 6,991 Michigan Grand Rapids 6,835 -4.5% (310) 6,525 Minnesota St. Paul 6,835 1.9% 133 6,968 Mississippi Jackson 6,835 -4.5% (310) 6,525 Missouri St. Louis 6,835 2.6% 180 7,015 Missouri Kansas City 6,835 1.4% 94 6,929 Montana Great Falls 6,835 -3.1% (209) 6,626 Nebraska Omaha 6,835 -2.5% (172) 6,663 New Hampshire Concord 6,835 -1.4% (98) 6,737 New Jersey Newark 6,835 10.1% 689 7,524 15-4
  • 126.
    Base Project Location Delta Cost Total Location Cost Percent Difference Project Cost State City ($/kW) Variation ($/kW) ($/kW) New Mexico Albuquerque 6,835 -2.8% (194) 6,641 New York New York 6,835 22.2% 1,514 8,349 New York Syracuse 6,835 -0.7% (48) 6,787 Nevada Las Vegas 6,835 3.7% 253 7,088 North Carolina Charlotte 6,835 -6.6% (451) 6,384 North Dakota Bismarck 6,835 -4.6% (314) 6,521 Ohio Cincinnati 6,835 -2.6% (180) 6,655 Oregon Portland 6,835 1.6% 107 6,942 Pennsylvania Philadelphia 6,835 6.7% 459 7,294 Pennsylvania Wilkes-Barre 6,835 -2.9% (195) 6,640 Rhode Island Providence 6,835 1.8% 124 6,959 South Carolina Spartanburg 6,835 -7.6% (517) 6,318 South Dakota Rapid City 6,835 -6.3% (429) 6,406 Tennessee Knoxville 6,835 -5.8% (398) 6,437 Texas Houston 6,835 -5.8% (398) 6,437 Utah Salt Lake City 6,835 -3.7% (251) 6,584 Vermont Burlington 6,835 -3.7% (251) 6,584 Virginia Alexandria 6,835 -0.8% (52) 6,783 Virginia Lynchburg 6,835 -4.0% (276) 6,559 Washington Seattle 6,835 3.6% 244 7,079 Washington Spokane 6,835 -1.8% (126) 6,709 West Virginia Charleston 6,835 -1.2% (80) 6,755 Wisconsin Green Bay 6,835 -1.9% (130) 6,705 Wyoming Cheyenne 6,835 -3.6% (245) 6,590 Puerto Rico Cayey 6,835 -0.2% (14) 6,821 15.4 O&M ESTIMATE In addition to the general items discussed in the section of this report entitled O&M Estimate, since a FC is a direct energy conversion device, the specific O&M related to the FC Facility that differs from other facilities discussed in this report is the stack replacement, currently anticipated to be every five years by the various vendors and developers. Table 15-3 presents the O&M expenses for the FC Facility. TABLE 15-3 – O&M EXPENSES FOR FC Technology: FC Fixed O&M Expense $350/kW-year Variable O&M Expense $0/MWh 15-5
  • 127.
    15.5 ENVIRONMENTAL COMPLIANCEINFORMATION Table 15-4 presents environmental emissions for the FC Facility. It should be noted that the CO2 production from the FC Facility occurs as a result of reforming natural gas to the feedstock for the fuel cell module. TABLE 15-4 – ENVIRONMENTAL EMISSIONS FOR FC Technology: FC NOX <0.013 lb/MMBtu SO2 <0.00013 lb/MMBtu CO2 <130 lb/MMBtu 15-6
  • 128.
    16. GEOTHERMAL DUALFLASH (GT) 16.1 MECHANICAL EQUIPMENT AND SYSTEMS The Geothermal (“GT”) Facility produces 50 MW net of electricity. The facility uses a dual-flash GT cycle, which includes one ST with the capability to generate 55 gross MW based on a high-temperature, high-salinity brine. The GT Facility consists of production wells, a Turbine Generating Facility (“TGF”), a Brine Processing Facility (“BPF”), injection wells, and a plant injection well. GT fluid in mixed phase (steam and brine) from the production wells is piped to the BPF where the fluid is flashed at successively lower pressures to produce three separate pressure levels of steam to be delivered to the TGF. Additionally, the BPF will produce a concentrated brine to be further processed to remove solids. The GT production wells deliver the GT brine to the BPF where it is initially flashed in a separator drum to produce HP steam. The remaining brine is subject to two additional pressure reduction stages, in closed pressure vessels called crystallizers, which are operated in a manner to prevent the rapid scaling of the vessel walls and internal parts by the precipitation of solids from the brine. The medium-pressure crystallizer is supplied with a small quantity of seed flow, concentrated brine from the primary clarifier, to provide a nucleus to which the solids in the crystallizer brine can attach themselves and be carried out with the brine leaving the crystallizer. The separated brine from the crystallizers is sent through an atmospheric flash tank to reduce pressure, and then further processed via a primary and secondary clarifier system where the solids produced are formed into a solid cake after being passed through a filter press, treated with acid and neutralizing washes, and steam and hot-air dried to produce a silica rich filter cake Steam at the three pressure levels from the BPF is delivered to the TGF and directed through steam scrubbers (one for each pressure level), which are designed to produce 99.95 percent quality steam, by removing free liquids and a proportion of the entrained liquids within the steam. The scrubbed steam is delivered to the ST. The ST is a condensing ST equipped with dual HP, IP, and LP inlets. Steam from the ST is condensed in a two-pass shell and tube condenser constructed of stainless steel, with part of the condensate used for cooling tower make-up, and the remainder pumped to the re-injection wells. Condensate pumps direct condensate to the circulating water system, the purge system, or the condensate injection system. The non-condensable gases are evacuated by a non-condensable gas removal system and vent products delivered to an H2S abatement system. Cooling water for the ST condenser is supplied by an induced-draft cooling tower. Circulating water pumps direct water from the cooling tower to the ST condenser. Make-up water for the cycle is supplied from the condensate from the ST condenser. Additional make-up water may be needed during the summer months. Figure 16-1 presents a simplified process flow diagram for a GT power plant configuration. 16-1
  • 129.
    FIGURE 16-1 –GT DESIGN CONFIGURATION 16.2 ELECTRICAL AND CONTROL SYSTEMS The GT Facility has one ST electric generator. The generator is a 60 Hz machine rated at approximately 70 MVA with an output voltage of 13.8 kV. The ST electric generator is connected to a high-voltage bus in the facility switchyard via a dedicated generator circuit breaker, GSU, high-voltage circuit breaker and a disconnect switch. The GSU increases the voltage from the electric generator from 13.8 kV to interconnected transmission system high voltage. The GT Facility is controlled using a DCS. The DCS provides centralized control of the facility by integrating the control systems provided with the BPF, ST and associated electric generator, and the control of BOP systems and equipment. 16.3 OFF-SITE REQUIREMENTS Since the GT Facility is fueled by a renewable, underground fuel source, an off-site fuel source, other than incidental plant heating, is not required. Water for all processes at the GT Facility is obtained from one of several available water sources; however, due to the geography of most geothermal power plants, water is sourced from on-site wells. Processed wastewater is generally re-injected, if wells are the source of water, though many GT facilities utilize ZLD. Further, the 16-2
  • 130.
    electrical interconnection fromthe GT Facility is accomplished by interconnecting via the plant switchyard into the utility high-voltage transmission system. 16.4 CAPITAL COST ESTIMATE The base Cost Estimate for the GT Facility with a nominal capacity of 50 MW is $6,163/kW. Table 16-1 summarizes the Cost Estimate categories for the GT Facility. TABLE 16-1 – BASE PLANT SITE CAPITAL COST ESTIMATE FOR GT Technology: GT Nominal Capacity (ISO): 50,000 kW Nominal Heat Rate (ISO): N/A Btu/kWh-HHV Capital Cost Category (000s) (October 1, 2010$) Civil Structural Material and Installation 9,450 Mechanical Equipment Supply and Installation (and well costs) 152,000 Electrical / I&C Supply and Installation 12,062 Project Indirects (1) 32,000 EPC Cost before Contingency and Fee 205,512 Fee and Contingency 30,827 Total Project EPC 236,339 Owner Costs (excluding project finance) 42,541 Total Project Cost (excluding finance) 278,879 Total Project EPC / kW 4,726 Owner Costs 18% (excluding project finance) / kW 852 Total Project Cost (excluding project finance) / kW 5,578 (1) Includes engineering, distributable costs, scaffolding, construction management, and start-up. For this type of technology and power plant configuration, our regional adjustments took into consideration the following: seismic design differences, local technical enhancements (e.g., additional noise remediation that is generally required in urban siting), remote location issues, labor wage and productivity differences, location adjustments, and the increase in overheads associated with these five adjustments. It was assumed that geothermal facilities would only be considered in 13 states: Alaska, Arizona, California, Colorado, Florida, Hawaii, Idaho, Nevada, New Mexico, Oregon, Utah, Washington, and Wyoming. 16-3
  • 131.
    Seismic design differencesamong the various locations were based on U.S. seismic map information that detailed the various seismic zones throughout the U.S. No cost increases were associated with seismic Zone 0 and cost step increases were considered for Zones 1, 2, 3 and 4. Remote location issues are related to geographic areas that typically require installation of man camps, higher craft incentives, and higher per diems are generally required with respect to construction, due to the fact that such areas are long distances from urban areas, where labor is generally abundant. Remote location designations were also considered in locations where higher equipment freight costs are typically incurred, which for example are regions not near established rail or highway access. Remote locations related to the Geothermal Facility include Fairbanks, Alaska; Honolulu, Hawaii; Albuquerque, New Mexico; and Cheyenne, Wyoming. Labor wage and productivity differences were handled as discussed in Section 2.5.1, taking into consideration the amount of labor we estimated for the GT Facility. Location adjustments were made to locations where higher cost of living levels are incurred and/or where population density generally correlates to higher construction costs for power and other infrastructure projects. These locations include Alaska, California, Hawaii, and Wyoming. Table 16-2 presents the GT Facility capital cost variations for alternative U.S. plant locations. 16-4
  • 132.
    TABLE 16-2 –LOCATION-BASED COSTS FOR GT (OCTOBER 1, 2010 DOLLARS) Base Project Location Delta Cost Total Location Cost Percent Difference Project Cost State City ($/kW) Variation ($/kW) ($/kW) Alaska Anchorage 5,580 13.9% 777 6,357 Alaska Fairbanks 5,580 20.6% 1,150 6,730 Alabama Huntsville 0 0.0% 0 0 Arizona Phoenix 5,580 -3.1% (173) 5,407 Arkansas Little Rock 0 0.0% 0 0 California Los Angeles 5,580 5.4% 301 5,881 California Redding 5,580 1.8% 101 5,681 California Bakersfield 5,580 2.4% 136 5,716 California Sacramento 5,580 4.9% 271 5,851 California San Francisco 5,580 11.8% 661 6,241 Colorado Denver 5,580 -3.0% (165) 5,415 Connecticut Hartford 0 0.0% 0 0 Delaware Dover 0 0.0% 0 0 District of Columbia Washington 0 0.0% 0 0 Florida Tallahassee 0 0.0% 0 0 Florida Tampa 0 0.0% 0 0 Georgia Atlanta 0 0.0% 0 0 Hawaii Honolulu 5,580 21.8% 1,217 6,797 Idaho Boise 5,580 -2.6% (146) 5,434 Illinois Chicago 0 0.0% 0 0 Indiana Indianapolis 0 0.0% 0 0 Iowa Davenport 0 0.0% 0 0 Iowa Waterloo 0 0.0% 0 0 Kansas Wichita 0 0.0% 0 0 Kentucky Louisville 0 0.0% 0 0 Louisiana New Orleans 0 0.0% 0 0 Maine Portland 0 0.0% 0 0 Maryland Baltimore 0 0.0% 0 0 Massachusetts Boston 0 0.0% 0 0 Michigan Detroit 0 0.0% 0 0 Michigan Grand Rapids 0 0.0% 0 0 Minnesota St. Paul 0 0.0% 0 0 Mississippi Jackson 0 0.0% 0 0 Missouri St. Louis 0 0.0% 0 0 Missouri Kansas City 0 0.0% 0 0 Montana Great Falls 0 0.0% 0 0 Nebraska Omaha 0 0.0% 0 0 New Hampshire Concord 0 0.0% 0 0 New Jersey Newark 0 0.0% 0 0 16-5
  • 133.
    Base Project Location Delta Cost Total Location Cost Percent Difference Project Cost State City ($/kW) Variation ($/kW) ($/kW) New Mexico Albuquerque 5,580 -2.1% (117) 5,463 New York New York 0 0.0% 0 0 New York Syracuse 0 0.0% 0 0 Nevada Las Vegas 5,580 3.5% 193 5,773 North Carolina Charlotte 0 0.0% 0 0 North Dakota Bismarck 0 0.0% 0 0 Ohio Cincinnati 0 0.0% 0 0 Oregon Portland 5,580 1.7% 92 5,672 Pennsylvania Philadelphia 0 0.0% 0 0 Pennsylvania Wilkes-Barre 0 0.0% 0 0 Rhode Island Providence 0 0.0% 0 0 South Carolina Spartanburg 0 0.0% 0 0 South Dakota Rapid City 0 0.0% 0 0 Tennessee Knoxville 0 0.0% 0 0 Texas Houston 0 0.0% 0 0 Utah Salt Lake City 5,580 -3.1% (173) 5,407 Vermont Burlington 0 0.0% 0 0 Virginia Alexandria 0 0.0% 0 0 Virginia Lynchburg 0 0.0% 0 0 Washington Seattle 5,580 3.5% 194 5,774 Washington Spokane 5,580 -1.8% (103) 5,477 West Virginia Charleston 0 0.0% 0 0 Wisconsin Green Bay 0 0.0% 0 0 Wyoming Cheyenne 5,580 -2.9% (164) 5,416 Puerto Rico Cayey 0 0.0% 0 0 16.5 O&M ESTIMATE In addition to the general items discussed in the section of this report entitled O&M Estimate, the GT Facility includes major maintenance on the ST, electric generator (each approximately every six years) and well field maintenance, which can vary depending on the GT resource. Table 16-3 presents the FOM and VOM expenses for the GT Facility. TABLE 16-3 – O&M EXPENSES FOR GT Technology: GT Fixed O&M Expense $84.27/kW-year Variable O&M Expense $9.46/MWh 16.6 ENVIRONMENTAL COMPLIANCE INFORMATION Table 16-4 presents environmental emissions for the GT Facility. 16-6
  • 134.
    TABLE 16-4 –ENVIRONMENTAL EMISSIONS FOR GT Technology: GT NOX 0 per MWh SO2 0.2 per MWh CO2 120 per MWh 16-7
  • 135.
    17. GEOTHERMAL BINARY(BINARY) 17.1 MECHANICAL EQUIPMENT AND SYSTEMS The Geothermal Binary (“Binary”) Facility produces 50 MW net of electricity. The Binary Facility consists primarily of three heat recovery systems. These heat recovery systems operate on a closed looped organic supercritical Rankine cycle using geothermal brine as a heat source, with a brine temperature approximately 275°F. Cycle heat rejection will be provided through three cooling towers. After supplying the three heat recovery systems with hot water, the geothermal brine will be re-injected into the resource at approximately 140°F through injection wells. The heat recovery systems are equipped with a multistage, radial inflow turbo-expander generator unit. The turbo-expander is designed for a supercritical refrigerant inlet pressure and temperature. Each turbo-expander unit has a design output (gross) of approximately 10,000 kW. Refrigerant is pumped from the condenser to the evaporators in each heat recovery system by means of a single high pressure vertical turbine pump. FIGURE 17-1 – GT DESIGN CONFIGURATION 17.2 ELECTRICAL AND CONTROL SYSTEMS There are to be three turbine generators at the Binary Facility. Each turbine generator is to be an air cooled unit with static excitation designed for operation at 60 Hz, three-phase and 12.5 kV. Each turbine generator is to be rated for 18 MW with a power factor range of 0.85 lagging. The three turbine generators are to be connected to a single GSU connected through a generator circuit breaker and a switchgear main circuit breaker and underground cable to a switch on a common open air bus in the Binary Facility substation. 17-1
  • 136.
    17.3 OFF-SITE REQUIREMENTS Sincethe Binary Facility is fueled by a renewable, underground fuel source, an off-site fuel source, other than incidental plant heating is not required. Water for all processes at the Binary Facility is obtained from one of several available water sources; however, due to the geography of most geothermal power plants, water is sourced from on-site wells. Processed wastewater is generally re-injected, if wells are the source of water, though many Binary facilities utilize ZLD. Further, the electrical interconnection from the Binary Facility is accomplished by interconnecting via the plant switchyard into the utility high-voltage transmission system. 17.4 CAPITAL COST ESTIMATE The base Cost Estimate for the Binary Facility with a nominal capacity of 50 MW is $4,141/kW. Table 17-1 summarizes the Cost Estimate categories for the Binary Facility. TABLE 17-1 – BASE PLANT SITE CAPITAL COST ESTIMATE FOR GT Technology: GT Nominal Capacity (ISO): 50,000 kW Nominal Heat Rate (ISO): N/A Btu/kWh-HHV Capital Cost Category (000s) (October 1, 2010$) Civil Structural Material and Installation 6,760 Mechanical Equipment Supply and Installation (and well costs) 107,545 Electrical / I&C Supply and Installation 13,345 Project Indirects (1) 29,000 EPC Cost before Contingency and Fee 156,650 Fee and Contingency 18,798 Total Project EPC 175,448 Owner Costs (excluding project finance) 31,598 Total Project Cost (excluding finance) 207,046 Total Project EPC / kW 3,509 Owner Costs 18% (excluding project finance) / kW 632 Total Project Cost (excluding project finance) / kW 4,141 (1) Includes engineering, distributable costs, scaffolding, construction management, and start-up. 17-2
  • 137.
    For this typeof technology and power plant configuration, our regional adjustments took into consideration the following: seismic design differences, local technical enhancements (e.g., additional noise remediation that is generally required in urban siting), remote location issues, labor wage and productivity differences, location adjustments, and the increase in overheads associated with these five adjustments. It was assumed that geothermal facilities would only be considered in 13 states: Alaska, Arizona, California, Colorado, Florida, Hawaii, Idaho, Nevada, New Mexico, Oregon, Utah, Washington, and Wyoming. Seismic design differences among the various locations were based on U.S. seismic map information that detailed the various seismic zones throughout the U.S. No cost increases were associated with seismic Zone 0 and cost step increases were considered for Zones 1, 2, 3 and 4. Remote location issues are related to geographic areas that typically require installation of man camps, higher craft incentives, and higher per diems are generally required with respect to construction, due to the fact that such areas are long distances from urban areas, where labor is generally abundant. Remote location designations were also considered in locations where higher equipment freight costs are typically incurred, which for example are regions not near established rail or highway access. Remote locations related to the Geothermal Facility include Fairbanks, Alaska; Honolulu, Hawaii; Albuquerque, New Mexico; and Cheyenne, Wyoming. Labor wage and productivity differences were handled as discussed in Section 2.5.1, taking into consideration the amount of labor we estimated for the GT Facility. Location adjustments were made to locations where higher cost of living levels are incurred and/or where population density generally correlates to higher construction costs for power and other infrastructure projects. These locations include Alaska, California, Hawaii, and Wyoming. Table 17-2 presents the GT Facility capital cost variations for alternative U.S. plant locations. 17-3
  • 138.
    TABLE 17-2 –LOCATION-BASED COSTS FOR GT (OCTOBER 1, 2010 DOLLARS) Base Project Location Delta Cost Total Location Cost Percent Difference Project Cost State City ($/kW) Variation ($/kW) ($/kW) Alaska Anchorage 4,140 17.1% 710 4,850 Alaska Fairbanks 4,140 26.0% 1,075 5,215 Alabama Huntsville 0 0.0% 0 0 Arizona Phoenix 4,140 -3.0% (125) 4,015 Arkansas Little Rock 0 0.0% 0 0 California Los Angeles 4,140 6.5% 270 4,410 California Redding 4,140 2.1% 88 4,228 California Bakersfield 4,140 3.1% 127 4,267 California Sacramento 4,140 5.4% 222 4,362 California San Francisco 4,140 13.4% 553 4,693 Colorado Denver 4,140 -2.7% (112) 4,028 Connecticut Hartford 0 0.0% 0 0 Delaware Dover 0 0.0% 0 0 District of Columbia Washington 0 0.0% 0 0 Florida Tallahassee 0 0.0% 0 0 Florida Tampa 0 0.0% 0 0 Georgia Atlanta 0 0.0% 0 0 Hawaii Honolulu 4,140 28.5% 1,178 5,318 Idaho Boise 4,140 -2.5% (105) 4,035 Illinois Chicago 0 0.0% 0 0 Indiana Indianapolis 0 0.0% 0 0 Iowa Davenport 0 0.0% 0 0 Iowa Waterloo 0 0.0% 0 0 Kansas Wichita 0 0.0% 0 0 Kentucky Louisville 0 0.0% 0 0 Louisiana New Orleans 0 0.0% 0 0 Maine Portland 0 0.0% 0 0 Maryland Baltimore 0 0.0% 0 0 Massachusetts Boston 0 0.0% 0 0 Michigan Detroit 0 0.0% 0 0 Michigan Grand Rapids 0 0.0% 0 0 Minnesota St. Paul 0 0.0% 0 0 Mississippi Jackson 0 0.0% 0 0 Missouri St. Louis 0 0.0% 0 0 Missouri Kansas City 0 0.0% 0 0 Montana Great Falls 0 0.0% 0 0 Nebraska Omaha 0 0.0% 0 0 New Hampshire Concord 0 0.0% 0 0 New Jersey Newark 0 0.0% 0 0 17-4
  • 139.
    Base Project Location Delta Cost Total Location Cost Percent Difference Project Cost State City ($/kW) Variation ($/kW) ($/kW) New Mexico Albuquerque 4,140 -1.8% (76) 4,064 New York New York 0 0.0% 0 0 New York Syracuse 0 0.0% 0 0 Nevada Las Vegas 4,140 3.6% 150 4,290 North Carolina Charlotte 0 0.0% 0 0 North Dakota Bismarck 0 0.0% 0 0 Ohio Cincinnati 0 0.0% 0 0 Oregon Portland 4,140 2.0% 81 4,221 Pennsylvania Philadelphia 0 0.0% 0 0 Pennsylvania Wilkes-Barre 0 0.0% 0 0 Rhode Island Providence 0 0.0% 0 0 South Carolina Spartanburg 0 0.0% 0 0 South Dakota Rapid City 0 0.0% 0 0 Tennessee Knoxville 0 0.0% 0 0 Texas Houston 0 0.0% 0 0 Utah Salt Lake City 4,140 -2.9% (118) 4,022 Vermont Burlington 0 0.0% 0 0 Virginia Alexandria 0 0.0% 0 0 Virginia Lynchburg 0 0.0% 0 0 Washington Seattle 4,140 3.8% 158 4,298 Washington Spokane 4,140 -1.7% (72) 4,068 West Virginia Charleston 0 0.0% 0 0 Wisconsin Green Bay 0 0.0% 0 0 Wyoming Cheyenne 4,140 -2.6% (106) 4,034 Puerto Rico Cayey 0 0.0% 0 0 17.5 O&M ESTIMATE In addition to the general items discussed in the section of this report entitled O&M Estimate, the Binary Facility includes major maintenance on the turbines, electric generator (each approximately every six years) and well field maintenance, which can vary depending on the Binary Facility resource. Table 17-3 presents the FOM and VOM expenses for the Binary Facility. TABLE 17-3 – O&M EXPENSES FOR BINARY Technology: GT Fixed O&M Expense $43.82/kW-year Variable O&M Expense $5.15/MWh 17-5
  • 140.
    17.6 ENVIRONMENTAL COMPLIANCEINFORMATION Table 17-4 presents environmental emissions for the Binary Facility. TABLE 17-4 – ENVIRONMENTAL EMISSIONS FOR BINARY Technology: Binary NOX 0 per MWh SO2 0.2 per MWh CO2 120 per MWh 17-6
  • 141.
    18. MUNICIPAL SOLIDWASTE (MSW) 18.1 MECHANICAL EQUIPMENT AND SYSTEMS The MSW Facility processes approximately 2,000 tons per day of MSW and produces approximately 50 MW. Three refuse-fired boilers are installed, which incorporate the Marin mass-burning technology and grates specifically designed for combusting waste having an HHV between 4,000 and 6,500 Btu/lb. The three boilers together produce approximately 450,000 lb/hr of 900 psia steam. Grapple cranes are used to transfer solid waste from a storage pit to loading chutes, where hydraulically operated feeds push the MSW onto the grates at a rate determined by the combustion control system. The Martin grates are constructed as assemblies of modular grate units. The units are driven by hydraulic systems to provide a reverse reciprocating motion of the grates, which move the burning refuse along the length of the downward sloped grate. At the end of its travel along the grate, the MSW is completely combusted, and the remaining ash residue falls into a proprietary Martin ash residue discharger, which receives the combustion residue and cools it in a quench chamber. The fly ash from the dry flue gas scrubber and fabric filter baghouse is conveyed to the ash discharger where it is combined with the bottom ash and quenched. After being quenched, the combined ash residue is pushed up an inclined draining/drying chute. Excess water from the residue drains back into the quench bath. The residue, containing sufficient moisture to prevent dusting, is transferred by a conveyor to a residue storage pit. Clamshell grapple cranes transport the residue to a scalper screen. The scalper screen extracts pieces of the residue larger than a certain size in order to protect the downstream equipment. The smaller material which passes through the scalper screen is fed onto a conveyer belt which discharges onto a vibrating feeder. The vibrating feeder passes the residue beneath a magnetic drum to separate ferrous material from the ash. Non-magnetic residue falls onto a distribution conveyor for distribution to a transport vehicle. Ferrous material is conveyed to a rotating trommel screen for cleaning, after which it is conveyed to a roll-off container. Each boiler is equipped with a dry flue gas scrubber in combination with a reverse air fabric filter baghouse. The dry scrubbers remove the acid gases (mainly SO2, hydrochloric acid and hydrofluoric acid) from the flue gas. A hydrated lime injection system prior to the dry scrubber augments the AGR capability of the system. The reverse air baghouse reduces dioxin/furan and particulate emissions. The facility also uses selective non-catalytic reduction (“SNCR”) for NOX control, and activated carbon injection for mercury control. Steam from the boilers is used to drive a single condensing ST for the production of approximately 50 MW of net electricity. The ST exhausts to a water-cooled condenser which receives circulating cooling water from an evaporative-type cooling tower. The ST includes extraction taps to provide steam for feedwater heating, air preheating and other miscellaneous steam requirements. The MSW process flow diagram at a high level is similar to the pulverized coal flow diagram, except that the fuel source is MSW, rather than coal (see Figure 3-1). The MSW process flow diagram at a high level is similar to the pulverized coal flow diagram, except that the fuel source is MSW, rather than coal. 18-1
  • 142.
    18.2 ELECTRICAL ANDCONTROL SYSTEMS The MSW Facility has one ST electric generator. The generator is a 60 Hz machine rated at approximately 70 MVA with an output voltage of 13.8 kV. The ST electric generator is connected to a high-voltage bus in the facility switchyard via a dedicated generator circuit breaker, GSU, high-voltage circuit breaker and a disconnect switch. The GSU increases the voltage from the electric generator from 13.8 kV to interconnected transmission system high voltage. The MSW Facility is controlled using a DCS. The DCS provides centralized control of the facility by integrating the control systems provided with the boiler, ST and associated electric generator, and the control of BOP systems and equipment. 18.3 OFF-SITE REQUIREMENTS MSW is delivered to the facility via rail, truck or barge. Water for all processes at the MSW Facility can be obtained from one of a variety of sources. The MSW Facility uses a water treatment system and a high-efficiency reverse osmosis system to reduce the dissolved solids from the cooling water and to provide distilled water for boiler make-up. Wastewater is sent to a municipal wastewater system or other approved alternative. Further, the electrical interconnection from the MSW Facility on-site switchyard is effectuated by a connection to an adjacent utility substation. 18.4 CAPITAL COST ESTIMATE The base Cost Estimate for the MSW Facility with a nominal capacity of 50 MW is $8,232/kW. Table 18-1 summarizes the Cost Estimate categories for the GT Facility. 18-2
  • 143.
    TABLE 18-1 –BASE PLANT SITE CAPITAL COST ESTIMATE FOR MSW Technology: MSW Nominal Capacity (ISO): 50,000 kW Nominal Heat Rate (ISO): 18,000 Btu/kWh-HHV Capital Cost Category (000s) (October 1, 2010$) Civil Structural Material and Installation 33,875 Mechanical Equipment Supply and Installation 183,000 Electrical / I&C Supply and Installation 25,300 Project Indirects (1) 56,080 EPC Cost before Contingency and Fee 298,255 Fee and Contingency 44,738 Total Project EPC 342,993 Owner Costs (excluding project finance) 68,599 Total Project Cost (excluding finance) 411,592 Total Project EPC / kW 6,860 Owner Costs 20% (excluding project finance) / kW 1,372 Total Project Cost (excluding project finance) / kW 8,232 (1) Includes engineering, distributable costs, scaffolding, construction management, and start-up. For this type of technology and power plant configuration, our regional adjustments took into consideration the following: seismic design differences, local enhancements, remote location issues, labor wage and productivity differences, location adjustments, and the increase in overheads associated with these five adjustments. Seismic design differences among the various locations were based on U.S. seismic map information that detailed the various seismic zones throughout the U.S. No cost increases were associated with seismic Zone 0 and cost step increases were considered for Zones 1, 2, 3 and 4. Remote location issues are related to geographic areas that typically require installation of man camps, higher craft incentives, and higher per diems are generally required with respect to construction, due to the fact that such areas are long distances from urban areas, where labor is generally abundant. Remote location designations were also considered in locations where higher equipment freight costs are typically incurred, which for example are regions not near established rail or highway access. Remote locations related to the MSW Facility include 18-3
  • 144.
    Fairbanks, Alaska; Honolulu,Hawaii; Albuquerque, New Mexico; Cheyenne, Wyoming; and Cayey, Puerto Rico. Labor wage and productivity differences were handled as discussed in Section 2.5.1, taking into consideration the amount of labor we estimated for the MSW Facility. Location adjustments were made to locations where higher cost of living levels are incurred and/or where population density generally correlates to higher construction costs for power and other infrastructure projects. These locations include Alaska, California, Connecticut, Delaware, District of Columbia, Hawaii, Illinois, Maine, Maryland, Massachusetts, Michigan, Minnesota, New York, Ohio, and Wisconsin. Table 18-2 presents the MSW Facility capital cost variations for alternative U.S. plant locations. TABLE 18-2 – LOCATION-BASED COSTS FOR MSW (OCTOBER 1, 2010 DOLLARS) Base Project Location Delta Cost Total Location Cost Percent Difference Project Cost State City ($/kW) Variation ($/kW) ($/kW) Alaska Anchorage 8,240 12.8% 1,054 9,294 Alaska Fairbanks 8,240 17.7% 1,459 9,699 Alabama Huntsville 8,240 -5.8% (474) 7,766 Arizona Phoenix 8,240 -4.5% (371) 7,869 Arkansas Little Rock 8,240 -4.7% (387) 7,853 California Los Angeles 8,240 5.2% 430 8,670 California Redding 8,240 1.9% 154 8,394 California Bakersfield 8,240 2.1% 176 8,416 California Sacramento 8,240 5.7% 472 8,712 California San Francisco 8,240 13.4% 1,104 9,344 Colorado Denver 8,240 -4.7% (384) 7,856 Connecticut Hartford 8,240 5.2% 429 8,669 Delaware Dover 8,240 3.1% 258 8,498 District of Columbia Washington 8,240 1.7% 140 8,380 Florida Tallahassee 8,240 -7.9% (649) 7,591 Florida Tampa 8,240 -3.3% (268) 7,972 Georgia Atlanta 8,240 -6.3% (515) 7,725 Hawaii Honolulu 8,240 19.9% 1,638 9,878 Idaho Boise 8,240 -3.8% (315) 7,925 Illinois Chicago 8,240 12.5% 1,033 9,273 Indiana Indianapolis 8,240 -0.9% (78) 8,162 Iowa Davenport 8,240 -1.0% (79) 8,161 Iowa Waterloo 8,240 -6.7% (548) 7,692 Kansas Wichita 8,240 -5.4% (446) 7,794 Kentucky Louisville 8,240 -4.8% (392) 7,848 Louisiana New Orleans 8,240 -7.3% (603) 7,637 Maine Portland 8,240 -4.1% (341) 7,899 Maryland Baltimore 8,240 -1.7% (144) 8,096 18-4
  • 145.
    Base Project Location Delta Cost Total Location Cost Percent Difference Project Cost State City ($/kW) Variation ($/kW) ($/kW) Massachusetts Boston 8,240 11.8% 975 9,215 Michigan Detroit 8,240 2.7% 220 8,460 Michigan Grand Rapids 8,240 -5.8% (475) 7,765 Minnesota St. Paul 8,240 2.3% 190 8,430 Mississippi Jackson 8,240 -5.7% (471) 7,769 Missouri St. Louis 8,240 3.0% 247 8,487 Missouri Kansas City 8,240 1.8% 150 8,390 Montana Great Falls 8,240 -4.0% (333) 7,907 Nebraska Omaha 8,240 -3.0% (243) 7,997 New Hampshire Concord 8,240 -2.0% (166) 8,074 New Jersey Newark 8,240 11.9% 984 9,224 New Mexico Albuquerque 8,240 -3.5% (287) 7,953 New York New York 8,240 26.3% 2,167 10,407 New York Syracuse 8,240 -0.4% (31) 8,209 Nevada Las Vegas 8,240 4.5% 370 8,610 North Carolina Charlotte 8,240 -8.3% (688) 7,552 North Dakota Bismarck 8,240 -5.6% (463) 7,777 Ohio Cincinnati 8,240 -3.1% (256) 7,984 Oregon Portland 8,240 1.7% 136 8,376 Pennsylvania Philadelphia 8,240 8.5% 698 8,938 Pennsylvania Wilkes-Barre 8,240 -3.4% (283) 7,957 Rhode Island Providence 8,240 2.8% 229 8,469 South Carolina Spartanburg 8,240 -9.5% (786) 7,454 South Dakota Rapid City 8,240 -7.9% (654) 7,586 Tennessee Knoxville 8,240 -7.3% (603) 7,637 Texas Houston 8,240 -7.3% (598) 7,642 Utah Salt Lake City 8,240 -4.9% (401) 7,839 Vermont Burlington 8,240 -4.4% (364) 7,876 Virginia Alexandria 8,240 -1.8% (148) 8,092 Virginia Lynchburg 8,240 -5.1% (420) 7,820 Washington Seattle 8,240 4.1% 342 8,582 Washington Spokane 8,240 -2.8% (228) 8,012 West Virginia Charleston 8,240 -1.6% (135) 8,105 Wisconsin Green Bay 8,240 -2.3% (186) 8,054 Wyoming Cheyenne 8,240 -4.6% (383) 7,857 Puerto Rico Cayey 8,240 -1.7% (144) 8,096 18.5 O&M ESTIMATE In addition to the general items discussed in the section of this report entitled O&M Estimate, the MSW Facility includes major maintenance for the feedstock handling, ST, electric generator, boiler, and BOP systems. Table 18-3 presents the O&M expenses for the MSW Facility. 18-5
  • 146.
    TABLE 18-3 –O&M EXPENSES FOR MSW Technology: MSW Fixed O&M Expense $373.76/kW-year Variable O&M Expense $8.33/MWh 18.6 ENVIRONMENTAL COMPLIANCE INFORMATION As mentioned above in the section on mechanical systems, each boiler is equipped with a dry flue gas scrubber in combination with a reverse air fabric filter baghouse. A hydrated lime injection system prior to the dry scrubber augments the AGR capability of the system. The reverse air baghouse reduces dioxin/furan and particulate emissions, an SNCR is used for NOX control, and activated carbon injection is used for mercury control. Table 18-4 presents environmental emissions for the MSW Facility. TABLE 18-4 – ENVIRONMENTAL EMISSIONS FOR MSW Technology: MSW NOX 0.27 lb/MMBtu SO2 0.07 lb/MMBtu CO2 200 lb/MMBtu 18-6
  • 147.
    19. HYDROELECTRIC (HY) 19.1MECHANICAL EQUIPMENT AND SYSTEMS The 500 MW Hydroelectric (“HY”) Facility is composed of two 250 MW vertical shaft Francis turbine generator units with a minimum of 650 feet (200 meters) of head. Figure 19-1 presents the HY process flow diagram. FIGURE 19-1 – HY DESIGN CONFIGURATION 19.2 ELECTRICAL AND CONTROL SYSTEMS The HY Facility has two synchronous electric generators. Each generator is a 60 Hz machine rated at approximately 300 MVA with an output voltage of approximately 23 kV. Each electric generator is connected to a high-voltage bus in the facility switchyard via a dedicated generator circuit breaker, GSU, high-voltage circuit breaker and a disconnect switch. In some instances, the generator is connected directly to its GSU and connected through a disconnect switch between two breakers on the high-voltage bus. The GSU increases the voltage from the electric generator from 23 kV to interconnected transmission system high voltage. The HY Facility is controlled using a DCS. The DCS provides centralized control of the facility by integrating the control systems provided hydro-turbine and associated electric generator and the control of BOP systems and equipment. 19.3 OFF-SITE REQUIREMENTS Since the fuel source for the HY Facility is renewable, the most important off-site requirement is the electrical interconnection to the high-voltage transmission system of the utility, which can be effectuated through the HY Facility switchyard. 19-1
  • 148.
    19.4 CAPITAL COSTESTIMATE The base Cost Estimate for the HY Facility with a nominal capacity of 500 MW is $3,076/kW. Table 19-1 summarizes the Cost Estimate categories for the HY Facility. TABLE 19-1 – BASE PLANT SITE CAPITAL COST ESTIMATE FOR HY Technology: HY Nominal Capacity (ISO): 500,000 kW Nominal Heat Rate (ISO): Not Applicable Capital Cost Category (000s) (October 1, 2010$) Civil Structural Material and Installation 634,250 Mechanical Equipment Supply and Installation 253,000 Electrical / I&C Supply and Installation 77,600 Project Indirects (1) 174,500 EPC Cost before Contingency and Fee 1,139,350 Fee and Contingency 142,419 Total Project EPC 1,281,769 Owner Costs (excluding project finance) 256,354 Total Project Cost (excluding finance) 1,538,123 Total Project EPC / kW 2,564 Owner Costs 20% (excluding project finance) / kW 513 Total Project Cost (excluding project finance) / kW 3,076 (1) Includes engineering, distributable costs, scaffolding, construction management, and start-up. For this type of technology and power plant configuration, our regional adjustments took into consideration the following: seismic design differences, local technical enhancements (e.g., additional noise remediation that is generally required in urban siting), remote location issues, labor wage and productivity differences, location adjustments, and the increase in overheads associated with these five adjustments. The assumption was made that hydroelectric facilities would only be considered for construction in the states of Alaska, California, Colorado, Connecticut, Idaho, Maine, Missouri, Montana, North Carolina, Ohio, Oregon, South Dakota, and Washington. 19-2
  • 149.
    Seismic design differencesamong the various locations were based on U.S. seismic map information that detailed the various seismic zones throughout the U.S. No cost increases were associated with seismic Zone 0 and cost step increases were considered for Zones 1, 2, 3 and 4. The locations with local technical enhancements include California, Colorado, Connecticut, and Delaware. These are areas where technical enhancements generally need to be made by a project developer or utility to comply with the applicable permitting/siting requirements. Remote location issues are related to geographic areas that typically require installation of man camps, higher craft incentives, and higher per diems are generally required with respect to construction, due to the fact that such areas are long distances from urban areas, where labor is generally abundant. Remote location designations were also considered in locations where higher equipment freight costs are typically incurred, which for example are regions not near established rail or highway access. The remote location related to the Hydroelectric Facility is Fairbanks, Alaska. Labor wage and productivity differences were handled as discussed in Section 2.5.1, taking into consideration the amount of labor we estimated for the HY Facility. Location adjustments were made to locations where higher cost of living levels are incurred and/or where population density generally correlates to higher construction costs for power and other infrastructure projects. These locations include Alaska, California, Connecticut, Maine, Ohio, and South Dakota. Table 19-2 presents the HY Facility capital cost variations for alternative U.S. plant locations. 19-3
  • 150.
    TABLE 19-2 –LOCATION-BASED COSTS FOR HY (OCTOBER 1, 2010 DOLLARS) Base Project Location Delta Cost Total Location Cost Percent Difference Project Cost State City ($/kW) Variation ($/kW) ($/kW) Alaska Anchorage 3,080 20.1% 619 3,699 Alaska Fairbanks 3,080 31.6% 974 4,054 Alabama Huntsville 0 0.0% 0 0 Arizona Phoenix 0 0.0% 0 0 Arkansas Little Rock 0 0.0% 0 0 California Los Angeles 3,080 7.4% 228 3,308 California Redding 3,080 2.8% 88 3,168 California Bakersfield 3,080 2.4% 75 3,155 California Sacramento 3,080 3.7% 113 3,193 California San Francisco 3,080 13.2% 408 3,488 Colorado Denver 3,080 -1.3% (40) 3,040 Connecticut Hartford 3,080 6.4% 197 3,277 Delaware Dover 0 0.0% 0 0 District of Columbia Washington 0 0.0% 0 0 Florida Tallahassee 0 0.0% 0 0 Florida Tampa 0 0.0% 0 0 Georgia Atlanta 0 0.0% 0 0 Hawaii Honolulu 0 0.0% 0 0 Idaho Boise 3,080 -1.6% (49) 3,031 Illinois Chicago 0 0.0% 0 0 Indiana Indianapolis 0 0.0% 0 0 Iowa Davenport 0 0.0% 0 0 Iowa Waterloo 0 0.0% 0 0 Kansas Wichita 0 0.0% 0 0 Kentucky Louisville 0 0.0% 0 0 Louisiana New Orleans 0 0.0% 0 0 Maine Portland 3,080 -0.8% (23) 3,057 Maryland Baltimore 0 0.0% 0 0 Massachusetts Boston 0 0.0% 0 0 Michigan Detroit 0 0.0% 0 0 Michigan Grand Rapids 0 0.0% 0 0 Minnesota St. Paul 0 0.0% 0 0 Mississippi Jackson 0 0.0% 0 0 Missouri St. Louis 3,080 1.3% 41 3,121 Missouri Kansas City 3,080 1.4% 42 3,122 Montana Great Falls 3,080 -1.2% (37) 3,043 Nebraska Omaha 0 0.0% 0 0 New Hampshire Concord 0 0.0% 0 0 New Jersey Newark 0 0.0% 0 0 New Mexico Albuquerque 0 0.0% 0 0 19-4
  • 151.
    Base Project Location Delta Cost Total Location Cost Percent Difference Project Cost State City ($/kW) Variation ($/kW) ($/kW) New York New York 0 0.0% 0 0 New York Syracuse 0 0.0% 0 0 Nevada Las Vegas 0 0.0% 0 0 North Carolina Charlotte 0 0.0% 20 3,100 North Dakota Bismarck 0 0.0% 0 0 Ohio Cincinnati 3,080 -1.6% (49) 3,031 Oregon Portland 3,080 4.7% 145 3,225 Pennsylvania Philadelphia 0 0.0% 0 0 Pennsylvania Wilkes-Barre 0 0.0% 0 0 Rhode Island Providence 0 0.0% 0 0 South Carolina Spartanburg 0 0.0% 0 0 South Dakota Rapid City 3,080 -3.9% (119) 2,961 Tennessee Knoxville 0 0.0% 0 0 Texas Houston 0 0.0% 0 0 Utah Salt Lake City 0 0.0% 0 0 Vermont Burlington 0 0.0% 0 0 Virginia Alexandria 0 0.0% 0 0 Virginia Lynchburg 0 0.0% 0 0 Washington Seattle 3,080 3.5% 109 3,189 Washington Spokane 3,080 -1.0% (31) 3,049 West Virginia Charleston 0 0.0% 0 0 Wisconsin Green Bay 0 0.0% 0 0 Wyoming Cheyenne 0 0.0% 0 0 Puerto Rico Cayey 0 0.0% 0 0 19.5 O&M ESTIMATE In addition to the general items discussed in the section of the report entitled O&M Estimate, the most significant differentiating O&M expenses for the HY Facility include dam and associated civil major maintenance and hydro-turbine major maintenance, which are generally conducted approximately every ten years. Because HY power plants are typically operated when available, most operators consider a majority of O&M expenses for this technology to be fixed. Table 19-3 presents the O&M expenses for the HY Facility. TABLE 19-3 – O&M EXPENSES FOR HY Technology: HY Fixed O&M Expense $13.44/kW-year Variable O&M Expense $0/MWh 19.6 ENVIRONMENTAL COMPLIANCE INFORMATION The HY Facility does not burn a fuel and consequently there are no air emissions from this type of plant. Table 19-4 presents environmental emissions for the HY Facility. 19-5
  • 152.
    TABLE 19-4 –ENVIRONMENTAL EMISSIONS FOR HY Technology: HY NOX 0 lb/MMBtu SO2 0 lb/MMBtu CO2 0 lb/MMBtu 19-6
  • 153.
    20. PUMPED STORAGE(PS) 20.1 MECHANICAL EQUIPMENT AND SYSTEMS The 250 MW Pumped Storage (“PS”) Facility is composed of two 125 MW Francis turbine generator units. During off-peak hours, water is pumped from a lower reservoir to an upper reservoir using electricity from the grid. During the generating cycle, water is discharged through the reversible turbine generators to produce power. Figure 20-1 presents the PS process flow diagram. FIGURE 20-1 – PS DESIGN CONFIGURATION 20.2 ELECTRICAL AND CONTROL SYSTEMS The PS Facility has two synchronous electric generators that are also capable of being operated as motors powered from the grid to provide the pumping function by driving the Francis hydro-turbines in reverse. The generators are 60 Hz machines rated at approximately 150 MVA with an output voltage of 13.8 kV to 24 kV. Each electric generator is connected to a high- voltage bus in the facility switchyard via a dedicated generator circuit breaker, GSU, high-voltage circuit breaker and a disconnect switch. The GSU increases the voltage from the electric generator voltage to the interconnected transmission system high voltage. The PS Facility is controlled using a DCS. The DCS provides centralized control of the facility by integrating the control systems provided with the hydro-turbine and associated electric generator and the control of BOP systems and equipment. 20.3 OFF-SITE REQUIREMENTS Similar to the HY Facility, since the fuel source for the PS Facility is renewable, the most important off-site requirement is the electrical interconnection to the high-voltage transmission system of the utility, which can be effectuated through the PS switchyard. Unlike the HY Facility, which uses the backfeed from the utility transmission system only to run required plant 20-1
  • 154.
    loads when thehydro-turbines are not operating, significant volumes of electricity are consumed in off-peak hours at the PS Facility. 20.4 CAPITAL COST ESTIMATE The base Cost Estimate for the PS Facility with a nominal capacity of 250 MW is $5,595/kW. Table 20-1 summarizes the Cost Estimate categories for the PS Facility. However, it should be noted that the construction costs for future pumped storage power plants are strongly impacted by the size (e.g., larger plants are most generally lower cost on a $/kW basis) and by the existing infrastructure that may be leveraged in the development, design, and construction. TABLE 20-1 – BASE PLANT SITE CAPITAL COST ESTIMATE FOR PS Technology: PS Nominal Capacity (ISO): 250,000 kW Nominal Heat Rate (ISO): N/A Btu/kWh-HHV Capital Cost Category (000s) (October 1, 2010$) Civil Structural Material and Installation 653,000 Mechanical Equipment Supply and Installation 152,400 Electrical / I&C Supply and Installation 73,700 Project Indirects (1) 171,100 EPC Cost before Contingency and Fee 1,050,200 Fee and Contingency 115,522 Total Project EPC 1,165,722 Owner Costs (excluding project finance) 233,144 Total Project Cost (excluding finance) 1,398,866 Total Project EPC / kW 4,663 Owner Costs 20% (excluding project finance) / kW 933 Total Project Cost (excluding project finance) / kW 5,595 (1) Includes engineering, distributable costs, scaffolding, construction management, and start-up. For this type of technology and power plant configuration, our regional adjustments took into consideration the following: seismic design differences, local technical enhancements, remote location issues, labor wage and productivity differences, location adjustments, and the increase in overheads associated with these five adjustments listed. While the analysis shown below 20-2
  • 155.
    contemplates cost adjustmentfactors for each area considered, realistically, there are certain areas that do not have enough elevation difference to cost effectively produce a pumped storage plant. Seismic design differences among the various locations were based on U.S. seismic map information that detailed the various seismic zones throughout the U.S. No cost increases were associated with seismic Zone 0 and cost step increases were considered for Zones 1, 2, 3 and 4. The locations with local technical enhancements include California, Colorado, Connecticut, Delaware, District of Columbia, Louisiana, Maryland, Massachusetts, New Jersey, New York, Rhode Island, Vermont, and Virginia. These are areas where noise, visual impacts, and other technical enhancements generally need to be made by a project developer or utility to comply with the applicable permitting/siting requirements. Remote location issues are related to geographic areas that typically require installation of man camps, higher craft incentives, and higher per diems are generally required with respect to construction, due to the fact that such areas are long distances from urban areas, where labor is generally abundant. Remote location designations were also considered in locations where higher equipment freight costs are typically incurred, which for example are regions not near established rail or highway access. Remote locations related to the Pumped Storage Facility include Fairbanks, Alaska; Honolulu, Hawaii; Albuquerque, New Mexico; Cheyenne, Wyoming; and Cayey, Puerto Rico. Labor wage and productivity differences were handled as discussed in Section 2.5.1., taking into consideration the amount of labor we estimated for the PS Facility. Location adjustments were made to locations where higher cost of living levels are incurred and/or where population density generally correlates to higher construction costs for power and other infrastructure projects. These locations include Alaska, California, Connecticut, Delaware, District of Columbia, Hawaii, Illinois, Maine, Maryland, Massachusetts, Michigan, Minnesota, New York, Ohio; and Wisconsin. Table 20-2 presents the PS Facility capital cost variations for alternative U.S. plant locations. 20-3
  • 156.
    TABLE 20-2 –LOCATION-BASED COSTS FOR PS (OCTOBER 1, 2010 DOLLARS) Base Project Location Delta Cost Total Location Cost Percent Difference Project Cost State City ($/kW) Variation ($/kW) ($/kW) Alaska Anchorage 5,595 17.6% 985 6,580 Alaska Fairbanks 5,595 24.7% 1,382 6,977 Alabama Huntsville 5,595 -7.4% (413) 5,182 Arizona Phoenix 5,595 -5.7% (322) 5,273 Arkansas Little Rock 5,595 -6.0% (335) 5,260 California Los Angeles 5,595 7.1% 398 5,993 California Redding 5,595 2.5% 141 5,736 California Bakersfield 5,595 3.0% 166 5,761 California Sacramento 5,595 7.5% 422 6,017 California San Francisco 5,595 17.8% 994 6,589 Colorado Denver 5,595 -5.9% (329) 5,266 Connecticut Hartford 5,595 7.0% 392 5,987 Delaware Dover 5,595 4.3% 243 5,838 District of Columbia Washington 5,595 2.8% 155 5,750 Florida Tallahassee 0 0 0 0 Florida Tampa 0 0 0 0 Georgia Atlanta 5,595 -8.0% (449) 5,146 Hawaii Honolulu 5,595 15.8% 883 6,478 Idaho Boise 5,595 -4.9% (273) 5,322 Illinois Chicago 5,595 16.2% 907 6,502 Indiana Indianapolis 5,595 -1.1% (64) 5,531 Iowa Davenport 5,595 -1.2% (66) 5,529 Iowa Waterloo 5,595 -8.5% (476) 5,119 Kansas Wichita 0 0 0 0 Kentucky Louisville 5,595 -6.1% (341) 5,254 Louisiana New Orleans 5,595 -9.3% (519) 5,076 Maine Portland 5,595 -5.2% (290) 5,305 Maryland Baltimore 5,595 -2.0% (110) 5,485 Massachusetts Boston 5,595 15.5% 869 6,464 Michigan Detroit 5,595 3.5% 196 5,791 Michigan Grand Rapids 5,595 -7.4% (413) 5,182 Minnesota St. Paul 5,595 3.0% 168 5,763 Mississippi Jackson 5,595 -7.3% (410) 5,185 Missouri St. Louis 5,595 4.0% 222 5,817 Missouri Kansas City 5,595 2.4% 136 5,731 Montana Great Falls 5,595 -5.1% (286) 5,309 Nebraska Omaha 5,595 -3.7% (209) 5,386 New Hampshire Concord 5,595 -2.5% (140) 5,455 New Jersey Newark 5,595 15.5% 867 6,462 New Mexico Albuquerque 5,595 -4.4% (245) 5,350 20-4
  • 157.
    Base Project Location Delta Cost Total Location Cost Percent Difference Project Cost State City ($/kW) Variation ($/kW) ($/kW) New York New York 5,595 34.3% 1,921 7,516 New York Syracuse 5,595 -0.2% (13) 5,582 Nevada Las Vegas 5,595 5.8% 326 5,921 North Carolina Charlotte 5,595 -10.7% (599) 4,996 North Dakota Bismarck 5,595 -7.1% (399) 5,196 Ohio Cincinnati 5,595 -3.9% (220) 5,375 Oregon Portland 5,595 3.1% 171 5,766 Pennsylvania Philadelphia 5,595 11.0% 615 6,210 Pennsylvania Wilkes-Barre 5,595 -4.3% (243) 5,352 Rhode Island Providence 5,595 3.7% 209 5,804 South Carolina Spartanburg 5,595 -12.2% (684) 4,911 South Dakota Rapid City 5,595 -10.2% (569) 5,026 Tennessee Knoxville 5,595 -9.4% (526) 5,069 Texas Houston 5,595 -9.3% (523) 5,072 Utah Salt Lake City 5,595 -6.2% (344) 5,251 Vermont Burlington 5,595 -5.5% (309) 5,286 Virginia Alexandria 5,595 -2.2% (121) 5,474 Virginia Lynchburg 5,595 -6.5% (366) 5,229 Washington Seattle 5,595 5.4% 305 5,900 Washington Spokane 5,595 -3.5% (197) 5,398 West Virginia Charleston 5,595 -2.0% (114) 5,481 Wisconsin Green Bay 5,595 -2.8% (157) 5,438 Wyoming Cheyenne 5,595 -5.8% (324) 5,271 Puerto Rico Cayey 5,595 -1.7% (95) 5,500 20.5 O&M ESTIMATE The O&M discussion in Section 17.5, related to the HY Facility at a high-level is applicable to the PS Facility, including the fact that most operators budget for a given PS facility on a FOM expense basis only. The additional areas of O&M that are applicable to the PS Facility that are not applicable to the HY Facility are pump and associated motor maintenance. Table 20-3 presents the O&M expenses for the PS Facility. TABLE 20-3 – O&M EXPENSES FOR PS Technology: PS Fixed O&M Expense $13.03/kW-year Variable O&M Expense $0/MWh 20.6 ENVIRONMENTAL COMPLIANCE INFORMATION The PS Facility does not directly burn a fuel and consequently there are no air emissions from this type of plant. Note that the fuel used to power the off-peak energy market, allowing off-peak pumping to the reservoir, is not considered in this report. Table 20-4 presents environmental emissions for the PS Facility. 20-5
  • 158.
    TABLE 20-4 –ENVIRONMENTAL EMISSIONS FOR PS Technology: PS NOX 0 lb/MMBtu SO2 0 lb/MMBtu CO2 0 lb/MMBtu 20-6
  • 159.
    21. ONSHORE WIND(WN) 21.1 MECHANICAL EQUIPMENT AND SYSTEMS The Onshore Wind (“WN”) Facility is based on 67 wind turbine generators (“WTGs”), each with a rated capacity of 1.5 MW. The total design capacity is 100 MW. The turbines are each supported by a conical steel tower, which is widest at the base and tapers in diameter just below the nacelle. A foundation provides the tower with a firm anchor to the ground. The nacelle is attached to the top of the tower and contains the main mechanical components of the wind turbine, which include a variable-speed generator, transmission, and yaw drive. The rotor hub connects to the transmission through one end of the nacelle, and the rotor is then connected to the hub. The WTG has a three-bladed rotor with a diameter of 77 meters. The WTG has an active yaw system in the nacelle to keep the rotor facing into the wind. Power is generated by the wind turbines, then converted using an onboard transformer to 34.5 kV AC. It is then delivered to a collection system at the base of each turbine. Power from all turbines will be collected by the underground collection circuit. The collection system supplies power to a new substation designed to step up the voltage to 115 kV for interconnection with the transmission system. Other facility components include access roads, an O&M building and electrical interconnection facilities. Figure 21-1 presents a picture of a typical WN Facility. FIGURE 21-1 – WN DESIGN CONFIGURATION 21-1
  • 160.
    21.2 ELECTRICAL ANDCONTROL SYSTEMS The WN Facility has 67 wind turbine-driven electric generators. Each generator is a doubly-fed induction generator that feeds an AC/DC/AC power converter that provides an output of three-phase, 60 Hz electrical power. The power output available is approximately 1.75 MVA with an output voltage of 575 V stepped up to 34.5 kV using a pad-mounted transformer at the base of the wind turbine. The wind turbine transformers are interconnected on one or more underground collector circuits that are connected to a collector bus through a circuit breaker for each circuit. The collector bus is connected to a high-voltage transmission system through the facility substation, which includes a 34.5 kV switch or circuit breaker, GSU, high-voltage circuit breaker, and a disconnect switch. The GSU increases the voltage from the electric generator from 34.5 kV to interconnected transmission system high voltage. The WN Facility is controlled using a control system generally referred to as the wind farm supervisory control and data acquisition (“SCADA”) system. The SCADA system provides centralized control of the facility by integrating the control systems provided with each of the wind turbines and the control of BOP systems and equipment. 21.3 OFF-SITE REQUIREMENTS Since wind uses a renewable fuel, the most significant off-site requirements are the construction of and interconnection to roads and the electrical interconnection to the utility high-voltage transmission system, as discussed in Section 19.2. 21.4 CAPITAL COST ESTIMATE The base Cost Estimate for the WN Facility with a nominal capacity of 100 MW is $2,400/kW. Table 21-1 summarizes the Cost Estimate categories for the WN Facility. 21-2
  • 161.
    TABLE 21-1 –LOCATION-BASED COSTS FOR WN Technology: WN Nominal Capacity (ISO): 100,000 kW Nominal Heat Rate (ISO): N/A Btu/kWh-HHV Capital Cost Category (000s) (October 1, 2010$) Civil Structural Material and Installation 25,625 Mechanical Equipment Supply and Installation 158,585 Electrical / I&C Supply and Installation 27,753 Project Indirects (1) 8,070 EPC Cost before Contingency and Fee 220,033 Fee and Contingency 10,000 Total Project EPC 230,033 Owner Costs (excluding project finance) 13,802 Total Project Cost (excluding finance) 243,835 Total Project EPC / kW 2,300 Owner Costs 6% (excluding project finance) / kW 138 Total Project Cost (excluding project finance) / kW 2,438 (1) Includes engineering, distributable costs, scaffolding, construction management, and start-up. For this type of technology and power plant configuration, our regional adjustments took into consideration the following: seismic design differences, remote location issues, labor wage and productivity differences, location adjustments, and owner cost differences and the increase in overheads associated with these five adjustments. Seismic design differences among the various locations were based on U.S. seismic map information that detailed the various seismic zones throughout the U.S. No cost increases were associated with seismic Zone 0 and cost step increases were considered for Zones 1, 2, 3 and 4. Remote location issues are related to geographic areas that typically require installation of man camps, higher craft incentives, and higher per diems are generally required with respect to construction, due to the fact that such areas are long distances from urban areas, where labor is generally abundant. Remote location designations were also considered in locations where higher equipment freight costs are typically incurred, which for example are regions not near established rail or highway access. Remote locations related to the WN Facility include 21-3
  • 162.
    Fairbanks, Alaska; Honolulu,Hawaii; Albuquerque, New Mexico; Cheyenne, Wyoming; and Cayey, Puerto Rico. Labor wage and productivity differences were handled as discussed in Section 2.5.1, taking into consideration the amount of labor we estimated for the WN Facility. Location adjustments were made to locations where higher cost of living levels are incurred and/or where population density generally correlates to higher construction costs for power and other infrastructure projects. These locations include Alaska, California, Connecticut, Delaware, District of Columbia, Hawaii, Illinois, Maine, Maryland, Massachusetts, Michigan, Minnesota, New York, Ohio, and Wisconsin. Owner costs were reviewed based on the need for utility upgrades and/or infrastructure costs such as new facility transmission lines to tie to existing utility transmission substations or existing transmission lines. Table 21-2 presents the WN Facility capital cost variations for alternative U.S. plant locations. TABLE 21-2 – LOCATION-BASED COSTS FOR WN (OCTOBER 1, 2010 DOLLARS) Base Project Location Delta Cost Total Location Cost Percent Difference Project Cost State City ($/kW) Variation ($/kW) ($/kW) Alaska Anchorage 2,440 25.2% 615 3,055 Alaska Fairbanks 2,440 45.0% 1,099 3,539 Alabama Huntsville 2,440 -3.5% (86) 2,354 Arizona Phoenix 2,440 -2.4% (58) 2,382 Arkansas Little Rock 2,440 -2.5% (61) 2,379 California Los Angeles 2,440 12.4% 304 2,744 California Redding 2,440 8.2% 200 2,640 California Bakersfield 2,440 10.0% 243 2,683 California Sacramento 2,440 10.5% 257 2,697 California San Francisco 2,440 18.6% 453 2,893 Colorado Denver 2,440 2.2% 54 2,494 Connecticut Hartford 2,440 6.6% 162 2,602 Delaware Dover 2,440 4.6% 111 2,551 District of Columbia Washington 2,440 7.4% 182 2,622 Florida Tallahassee 2,440 -5.3% (128) 2,312 Florida Tampa 2,440 -2.2% (53) 2,387 Georgia Atlanta 2,440 -3.9% (94) 2,346 Hawaii Honolulu 2,440 27.4% 668 3,108 Idaho Boise 2,440 3.4% 83 2,523 Illinois Chicago 2,440 14.2% 346 2,786 Indiana Indianapolis 2,440 0.3% 8 2,448 Iowa Davenport 2,440 4.5% 111 2,551 Iowa Waterloo 2,440 0.7% 18 2,458 Kansas Wichita 2,440 1.9% 46 2,486 Kentucky Louisville 2,440 -2.9% (70) 2,370 21-4
  • 163.
    Base Project Location Delta Cost Total Location Cost Percent Difference Project Cost State City ($/kW) Variation ($/kW) ($/kW) Louisiana New Orleans 2,440 -5.4% (132) 2,308 Maine Portland 2,440 6.4% 155 2,595 Maryland Baltimore 2,440 1.7% 41 2,481 Massachusetts Boston 2,440 11.1% 270 2,710 Michigan Detroit 2,440 2.7% 67 2,507 Michigan Grand Rapids 2,440 -3.2% (78) 2,362 Minnesota St. Paul 2,440 7.5% 183 2,623 Mississippi Jackson 2,440 -3.5% (85) 2,355 Missouri St. Louis 2,440 3.6% 88 2,528 Missouri Kansas City 2,440 1.7% 41 2,481 Montana Great Falls 2,440 3.9% 95 2,535 Nebraska Omaha 2,440 3.5% 86 2,526 New Hampshire Concord 2,440 5.3% 128 2,568 New Jersey Newark 2,440 10.5% 257 2,697 New Mexico Albuquerque 2,440 3.8% 93 2,533 New York New York 2,440 24.6% 600 3,040 New York Syracuse 2,440 0.8% 20 2,460 Nevada Las Vegas 2,440 9.0% 219 2,659 North Carolina Charlotte 2,440 -4.9% (120) 2,320 North Dakota Bismarck 2,440 2.1% 50 2,490 Ohio Cincinnati 2,440 -1.9% (47) 2,393 Oregon Portland 2,440 8.0% 196 2,636 Pennsylvania Philadelphia 2,440 6.1% 150 2,590 Pennsylvania Wilkes-Barre 2,440 -1.8% (44) 2,396 Rhode Island Providence 2,440 2.1% 51 2,491 South Carolina Spartanburg 2,440 -5.7% (140) 2,300 South Dakota Rapid City 2,440 0.7% 17 2,457 Tennessee Knoxville 2,440 -4.6% (111) 2,329 Texas Houston 2,440 -4.8% (118) 2,322 Utah Salt Lake City 2,440 3.7% 90 2,530 Vermont Burlington 2,440 3.4% 83 2,523 Virginia Alexandria 2,440 1.9% 46 2,486 Virginia Lynchburg 2,440 -3.1% (75) 2,365 Washington Seattle 2,440 4.4% 107 2,547 Washington Spokane 2,440 4.9% 120 2,560 West Virginia Charleston 2,440 -0.1% (3) 2,437 Wisconsin Green Bay 2,440 -1.0% (25) 2,415 Wyoming Cheyenne 2,440 4.3% 105 2,545 Puerto Rico Cayey 2,440 6.9% 167 2,607 21.5 O&M ESTIMATE In addition to the general items discussed in the section of the report entitled O&M Estimate, the major areas for O&M for an Onshore Wind Facility include periodic gearbox, WTG, electric 21-5
  • 164.
    generator, and associatedelectric conversion (e.g., GSU) technology repairs and replacement. These devices typically undergo major maintenance every five to seven years. Table 21-3 presents the O&M expenses for the WN Facility. TABLE 21-3 – O&M EXPENSES FOR WN Technology: WN Fixed O&M Expense $28.07/kW-year Variable O&M Expense $0/MWh 21.6 ENVIRONMENTAL COMPLIANCE INFORMATION Since wind utilizes a renewable fuel and no additional fuel is combusted to make power from an Onshore Wind Facility, air emissions are not created. Table 21-4 presents environmental emissions for the WN Facility. TABLE 21-4 – ENVIRONMENTAL EMISSIONS FOR WN Technology: WN NOX 0 lb/MMBtu SO2 0 lb/MMBtu CO2 0 lb/MMBtu 21-6
  • 165.
    22. OFFSHORE WIND(WF) 22.1 MECHANICAL EQUIPMENT AND SYSTEMS The Offshore Wind (“WF”) Facility is based on 80 offshore WTGs, each with a rated capacity of 5.0 MW. The total design capacity is 400 MW. The turbines are each supported by a conical steel tower, which is widest at the base and tapers in diameter just below the nacelle. A foundation provides the tower with a firm anchor to the ground. The nacelle is attached to the top of the tower and contains the main mechanical components of the wind turbine, which include a variable-speed generator, transmission, and yaw drive. The rotor hub connects to the transmission through one end of the nacelle, and the rotor is then connected to the hub. The WTG has a three-bladed rotor with a diameter of approximately 125 meters. The WTG has an active yaw system in the nacelle to keep the rotor facing into the wind. The WF WTG is designed to withstand the conditions of the high seas, including additional redundancy of key components to enhance availability, corrosion protection and permanent monitoring. Power is generated by the wind turbines, then converted using an onboard transformer to 34.5 kV AC. It is then delivered to a collection system at the base of each turbine. Power from all turbines is collected by the underground collection circuit. The collection system supplies power to a new substation designed to step up the voltage to 115 kV for interconnection with the transmission system. Figure 22-1 presents a picture of a currently operating WF Facility. 22-1
  • 166.
    FIGURE 22-1 –WF DESIGN CONFIGURATION 22.2 ELECTRICAL AND CONTROL SYSTEMS The WF Facility has 80 wind turbine-driven electric generators. Each generator is a doubly-fed induction generator that feeds an AC/DC/AC power converter that provides an output of three- phase, 60 Hz electrical power. The power output available is approximately 5.5 MVA with an output voltage of 690 V stepped up to 34.5 kV using a transformer installed in the wind turbine pylon. The wind turbine transformers are interconnected on one or more underwater collector circuits trenched into the seabed that are connected to a collector bus (or several collector busses) through a circuit breaker for each circuit. The collector bus is connected to a high-voltage transmission system through the facility substation that includes a 34.5 kV switch or circuit breaker, GSU, high-voltage circuit breaker and a disconnect switch. If there are multiple collector busses this arrangement may be replicated for each bus. The GSU increases the voltage from the electric generator from 34.5 kV to interconnected transmission system high voltage. The WF Facility is controlled using a SCADA system. The SCADA system provides centralized control of the facility by integrating the control systems provided with each of the wind turbines and the control of BOP systems and equipment. 22.3 OFF-SITE REQUIREMENTS Similar to the WF Facility, the most significant off-site requirement for the WF Facility is the electrical interconnection to the utility transmission system, as discussed directly above. 22-2
  • 167.
    22.4 CAPITAL COSTESTIMATE The base Cost Estimate for the WF Facility with a nominal capacity of 400 MW is $5,975/kW. Table 22-1 summarizes the Cost Estimate categories for the WF Facility. TABLE 22-1 – BASE PLANT SITE CAPITAL COST ESTIMATE FOR WF Technology: WF Nominal Capacity (ISO): 400,000 kW Nominal Heat Rate (ISO): N/A Btu/kWh-HHV Capital Cost Category (000s) (October 1, 2010$) Civil Structural Material and Installation 252,000 Mechanical Equipment Supply and Installation 835,328 Electrical / I&C Supply and Installation 148,302 Project Indirects (1) 463,856 EPC Cost before Contingency and Fee 1,699,486 Fee and Contingency 212,436 Total Project EPC 1,911,922 Owner Costs (excluding project finance) 477,981 Total Project Cost (excluding finance) 2,389,903 Total Project EPC / kW 4,780 Owner Costs 25% (excluding project finance) / kW 1,195 Total Project Cost (excluding project finance) / kW 5,975 (1) Includes engineering, distributable costs, scaffolding, construction management, and start-up. For this type of technology and power plant configuration, our regional adjustments took into consideration the following: seismic design differences, remote location issues, labor wage and productivity differences, location adjustments, owner cost differences, and the increase in overheads associated with these five location adjustments. The assumption was made that offshore wind projects would only be constructed offshore of the following states (where significant offshore wind resource is available): Alaska, California, Connecticut, Delaware, District of Columbia, Georgia, Hawaii, Illinois, Indiana, Maine, Maryland, Massachusetts, Michigan, Minnesota, New Jersey, New York, North Carolina, Oregon, Rhode Island, South Carolina, Texas, Virginia, Washington, Wisconsin and Puerto Rico. 22-3
  • 168.
    Seismic design differencesamong the various locations were based on U.S. seismic map information that detailed the various seismic zones throughout the U.S. No cost increases were associated with seismic Zone 0 and cost step increases were considered for Zones 1, 2, 3 and 4. Remote locations issues are related to geographic areas that typically require installation of man camps, higher craft incentives, and higher per diems for construction, because such areas are long distances from urban areas, where labor is generally abundant. Remote location designations were also considered in locations where higher equipment freight costs are typically incurred, which for example are regions not near established rail or highway access. Remote locations related to the Offshore Wind Facility include Fairbanks, Alaska; Honolulu, Hawaii; and Cayey, Puerto Rico. Labor wage and productivity differences were handled as discussed in Section 2.5.1, taking into consideration the amount of labor we estimated for the WF Facility. Location adjustments were made to locations where higher cost of living levels are incurred and/or where population density generally correlates to higher construction costs for power and other infrastructure projects. These locations include Alaska, California, Connecticut, Delaware, District of Columbia, Hawaii, Maine, Maryland, Massachusetts, New York, and Wisconsin. Owner costs were reviewed based on the need for utility upgrades and/or infrastructure costs such as new facility transmission lines to tie to existing utility transmission substations or existing transmission lines. Table 22-2 presents the WF Facility capital cost variations for alternative U.S. plant locations. 22-4
  • 169.
    TABLE 22-2 –LOCATION-BASED COSTS FOR WF (OCTOBER 1, 2010 DOLLARS) Base Project Location Delta Cost Total Location Cost Percent Difference Project Cost State City ($/kW) Variation ($/kW) ($/kW) Alaska Anchorage 5,975 15.9% 952 6,927 Alaska Fairbanks 0 0.0% Alabama Huntsville 0 0.0% Arizona Phoenix 0 0.0% Arkansas Little Rock 0 0.0% California Los Angeles 5,975 7.7% 460 6,435 California Redding 0 0.0% California Bakersfield 0 0.0% California Sacramento 0 0.0% California San Francisco 5,975 16.6% 993 6,968 Colorado Denver 0 0.0% Connecticut Hartford 5,975 5.7% 342 6,317 Delaware Dover 5,975 3.1% 184 6,159 District of Columbia Washington 5,975 1.8% 110 6,085 Florida Tallahassee 0 0.0% Florida Tampa 0 0.0% Georgia Atlanta 5,975 -7.0% (418) 5,557 Hawaii Honolulu 5,975 14.5% 864 6,839 Idaho Boise 0 0.0% Illinois Chicago 5,975 16.0% 958 6,933 Indiana Indianapolis 5,975 -1.0% (58) 5,917 Iowa Davenport 0 0.0% Iowa Waterloo 0 0.0% Kansas Wichita 0 0.0% Kentucky Louisville 0 0.0% Louisiana New Orleans 0 0.0% Maine Portland 5,975 -2.6% (156) 5,819 Maryland Baltimore 5,975 -2.1% (126) 5,849 Massachusetts Boston 5,975 13.2% 787 6,762 Michigan Detroit 5,975 2.8% 165 6,140 Michigan Grand Rapids 5,975 -6.7% (403) 5,572 Minnesota St. Paul 5,975 4.8% 288 6,263 Mississippi Jackson 0 0.0% Missouri St. Louis 0 0.0% Missouri Kansas City 0 0.0% Montana Great Falls 0 0.0% Nebraska Omaha 0 0.0% New Hampshire Concord 0 0.0% New Jersey Newark 5,975 12.7% 761 6,736 New Mexico Albuquerque 0 0.0% 22-5
  • 170.
    Base Project Location Delta Cost Total Location Cost Percent Difference Project Cost State City ($/kW) Variation ($/kW) ($/kW) New York New York 5,975 29.4% 759 7,734 New York Syracuse 5,975 -1.2% (69) 5,906 Nevada Las Vegas 0 0.0% North Carolina Charlotte 5,975 -9.3% (557) 5,418 North Dakota Bismarck 0 0.0% Ohio Cincinnati 0 0.0% Oregon Portland 5,975 5.1% 302 6,277 Pennsylvania Philadelphia 0 0.0% Pennsylvania Wilkes-Barre 0 0.0% Rhode Island Providence 5,975 2.5% 48 6,123 South Carolina Spartanburg 5,975 -6.6% (391) 5,584 South Dakota Rapid City 0 0.0% Tennessee Knoxville 0 0.0% Texas Houston 5,975 -8.2% (487) 5,488 Utah Salt Lake City 0 0.0% Vermont Burlington 0 0.0% Virginia Alexandria 5,975 -2.7% (161) 5,814 Virginia Lynchburg 5,975 -5.7% (340) 5,635 Washington Seattle 5,975 4.8% 287 6,262 Washington Spokane 0 0.0% West Virginia Charleston 0 0.0% Wisconsin Green Bay 5,975 -2.7% (164) 5,811 Wyoming Cheyenne 0 0.0% Puerto Rico Cayey 5,975 -1.2% (72) 5,903 22.5 O&M ESTIMATE The types of maintenance performed on the WF Facility are materially similar to the WN Facility, discussed in Section 19.5; however, the expenses are higher because maintaining offshore parts is considerably more complicated, due to staging on ships and with helicopters. Table 22-3 presents the FOM and VOM expenses for the WF Facility. TABLE 22-3 – O&M EXPENSES FOR WF Technology: WF Fixed O&M Expense $53.33/kW-year Variable O&M Expense $0/MWh 22.6 ENVIRONMENTAL COMPLIANCE INFORMATION Since the WF Facility uses a renewable fuel and no additional fuel is combusted, there are no air emissions. Table 22-4 presents environmental emissions for the WF Facility. 22-6
  • 171.
    TABLE 22-4 –ENVIRONMENTAL EMISSIONS FOR WF Technology: WF NOX 0 lb/MMBtu SO2 0 lb/MMBtu CO2 0 lb/MMBtu 22-7
  • 172.
    23. SOLAR THERMAL- CENTRAL STATION (SO) 23.1 MECHANICAL EQUIPMENT AND SYSTEMS The 100 MW Solar Thermal (“SO”) Facility uses a solar concentrating thermal process based on direct steam, power towers, and heliostat mirror technology. The SO Facility incorporates a Rankine-cycle reheat ST which receives steam from a solar steam generator and a solar superheater and reheated steam from a solar reheater. The solar steam generator, solar superheater, and solar reheater are all installed at the top of a tower adjacent to a power block located at grade. The tower and power block are generally in the center of a heliostat solar field. The solar energy heats water in the steam generator, superheater and reheat boiler to make steam that runs the ST. The solar field and power generation equipment are started up each morning after sunrise and insolation (or light intensity) build-up, and are shut down in the evening when insolation drops below the level required for keeping the ST online. A partial load natural gas-fired boiler is used for thermal input to the ST during the morning start-up cycle. The boiler is also generally operated during transient cloudy conditions, in order to keep the ST online and ready to resume production from solar thermal input, after the clouds clear. After the cloud passes and solar-to-thermal input resumes, the ST will be returned to full solar production and the gas-fired boiler is shut down. While permitting SO facilities with respect to water usage continues to be a challenge, our base assumption is that the SO Facility uses wet cooling technology. The power block consists of one solar power tower and an ST with a reheat cycle, and it uses typical auxiliary components for heat rejection, water treatment, water disposal, and interconnection to the grid. Figure 23-1 presents a picture of a typical SO Facility. 23-1
  • 173.
    FIGURE 23-1 –SO DESIGN CONFIGURATION 23.2 ELECTRICAL AND CONTROL SYSTEMS The SO Facility has one ST electric generator. The generator is a 60 Hz machine rated at approximately 120 MVA with an output voltage of 13.8 kV. The ST electric generator is connected to a high-voltage bus in the facility switchyard via a dedicated generator circuit breaker, GSU, high-voltage circuit breaker and a disconnect switch. The GSU increases the voltage from the electric generator from 13.8 kV to interconnected transmission system high voltage. 23-2
  • 174.
    The SO Facilityis controlled using a DCS. The DCS provides centralized control of the facility by integrating the control systems provided with the solar steam generator/superheater/reheater system, ST and associated electric generator, and the control of BOP systems and equipment. 23.3 OFF-SITE REQUIREMENTS Natural gas is delivered to the facility through a lateral connected to the local natural gas trunk line. Water for all processes at the SO Facility is obtained from a one of several available water sources (e.g., municipal water supply); however, due to the remote location of most solar thermal power plants, water is often sourced through on-site wells. The SO Facility uses a water treatment system and a high-efficiency reverse osmosis system to reduce the dissolved solids from the cooling water and to provide distilled water for HRSG make-up. Processed wastewater is sent to a municipal wastewater system, re-injected on-site, or an on-site ZLD system. Further, the electrical interconnection from the SO Facility on-site switchyard is effectuated by a connection to an adjacent utility substation. 23.4 CAPITAL COST ESTIMATE The base Cost Estimate for the SO Facility with a nominal capacity of 100 MW is $4,692/kW. Table 23-1 summarizes the Cost Estimate categories for the SO Facility. 23-3
  • 175.
    TABLE 23-1 –BASE PLANT SITE CAPITAL COST ESTIMATE FOR SO Technology: SO Nominal Capacity (ISO): 100,000 kW Nominal Heat Rate (ISO): N/A Btu/kWh-HHV (2) Capital Cost Category (000s) (October 1, 2010$) Civil Structural Material and Installation 48,475 Mechanical Equipment Supply and Installation 254,250 Electrical / I&C Supply and Installation 40,750 Project Indirects (1) 39,500 EPC Cost before Contingency and Fee 382,975 Fee and Contingency 25,000 Total Project EPC 407,975 Owner Costs (excluding project finance) 61,196 Total Project Cost (excluding finance) 469,171 Total Project EPC / kW 4,080 Owner Costs 15% (excluding project finance) / kW 612 Total Project Cost (excluding project finance) / kW 4,692 (1) Includes engineering, distributable costs, scaffolding, construction management, and start-up. (2) Does not include natural gas firing, as such usage is sporadic and highly dependent on time of year and method of operation. For this type of technology and power plant configuration, our regional adjustments took into consideration the following: seismic design differences, remote location issues, labor wage and productivity differences, location adjustments, owner cost differences, and the increase in overheads associated with the previous five location adjustments. Seismic design differences among the various locations were based on U.S. seismic map information that detailed the various seismic zones throughout the U.S. No cost increases were associated with seismic Zone 0 and cost step increases were considered for Zones 1, 2, 3 and 4. Remote location issues are related to geographic areas that typically require installation of man camps, higher craft incentives, and higher per diems are generally required with respect to construction, due to the fact that such areas are long distances from urban areas, where labor is generally abundant. Remote location designations were also considered in locations where higher equipment freight costs are typically incurred, which for example are regions not near 23-4
  • 176.
    established rail orhighway access. Remote locations related to the Solar Thermal Facility include Honolulu, Hawaii; Albuquerque, New Mexico; Cheyenne, Wyoming; and Cayey, Puerto Rico. Labor wage and productivity differences were handled as discussed in Section 2.5.1, taking into consideration the amount of labor we estimated for the SO Facility. Location adjustments were made to locations where higher cost of living levels are incurred and/or where population density generally correlates to higher construction costs for power and other infrastructure projects. These locations include Alaska, California, Connecticut, Delaware, District of Columbia, Hawaii, Illinois, Maine, Maryland, Massachusetts, Michigan, Minnesota, New York, Ohio, and Wisconsin. Owner costs were reviewed based on the need for utility upgrades and/or infrastructure costs such as new facility transmission lines to tie to existing utility transmission substations or existing transmission lines. Table 23-2 presents the SO Facility capital cost variations for alternative U.S. plant locations. 23-5
  • 177.
    TABLE 23-2 –LOCATION-BASED COSTS FOR SO (OCTOBER 1, 2010 DOLLARS) Base Project Location Delta Cost Total Location Cost Percent Difference Project Cost State City ($/kW) Variation ($/kW) ($/kW) Alaska Anchorage 4,700 23.8% 1,119 5,819 Alaska Fairbanks 4,700 35.4% 1,662 6,362 Alabama Huntsville 4,700 -11.3% (532) 4,168 Arizona Phoenix 4,700 -8.9% (417) 4,283 Arkansas Little Rock 4,700 -9.3% (435) 4,265 California Los Angeles 4,700 11.4% 538 5,238 California Redding 4,700 6.3% 297 4,997 California Bakersfield 4,700 6.7% 316 5,016 California Sacramento 4,700 13.3% 623 5,323 California San Francisco 4,700 26.8% 1,261 5,961 Colorado Denver 4,700 -7.3% (344) 4,356 Connecticut Hartford 4,700 9.2% 431 5,131 Delaware Dover 4,700 4.7% 220 4,920 District of Columbia Washington 4,700 1.6% 74 4,774 Florida Tallahassee 4,700 -15.5% (727) 3,973 Florida Tampa 4,700 -6.4% (300) 4,400 Georgia Atlanta 4,700 -12.3% (578) 4,122 Hawaii Honolulu 4,700 39.8% 1,871 6,571 Idaho Boise 4,700 -4.8% (225) 4,475 Illinois Chicago 4,700 26.8% 1,262 5,962 Indiana Indianapolis 4,700 -1.9% (90) 4,610 Iowa Davenport 4,700 0.4% 20 4,720 Iowa Waterloo 4,700 -10.8% (505) 4,195 Kansas Wichita 4,700 -8.3% (392) 4,308 Kentucky Louisville 4,700 -9.4% (440) 4,260 Louisiana New Orleans 4,700 -15.9% (748) 3,952 Maine Portland 4,700 -5.9% (278) 4,422 Maryland Baltimore 4,700 -4.4% (209) 4,491 Massachusetts Boston 4,700 22.2% 1,043 5,743 Michigan Detroit 4,700 4.8% 224 4,924 Michigan Grand Rapids 4,700 -11.8% (554) 4,146 Minnesota St. Paul 4,700 7.2% 340 5,040 Mississippi Jackson 4,700 -11.2% (528) 4,172 Missouri St. Louis 4,700 5.7% 270 4,970 Missouri Kansas City 4,700 3.1% 144 4,844 Montana Great Falls 4,700 -5.3% (248) 4,452 Nebraska Omaha 4,700 -3.5% (165) 4,535 New Hampshire Concord 4,700 -1.7% (80) 4,620 New Jersey Newark 4,700 22.2% 1,042 5,742 New Mexico Albuquerque 4,700 -4.6% (217) 4,483 23-6
  • 178.
    Base Project Location Delta Cost Total Location Cost Percent Difference Project Cost State City ($/kW) Variation ($/kW) ($/kW) New York New York 4,700 50.1% 2,355 7,055 New York Syracuse 4,700 -2.4% (114) 4,586 Nevada Las Vegas 4,700 11.5% 542 5,242 North Carolina Charlotte 4,700 -16.4% (772) 3,928 North Dakota Bismarck 4,700 -8.8% (412) 4,288 Ohio Cincinnati 4,700 -6.6% (310) 4,390 Oregon Portland 4,700 5.9% 277 4,977 Pennsylvania Philadelphia 4,700 16.1% 758 5,458 Pennsylvania Wilkes-Barre 4,700 -7.3% (341) 4,359 Rhode Island Providence 4,700 4.2% 196 4,896 South Carolina Spartanburg 4,700 -18.8% (882) 3,818 South Dakota Rapid City 4,700 -12.8% (604) 4,096 Tennessee Knoxville 4,700 -14.4% (677) 4,023 Texas Houston 4,700 -14.2% (670) 4,030 Utah Salt Lake City 4,700 -6.9% (325) 4,375 Vermont Burlington 4,700 -7.2% (338) 4,362 Virginia Alexandria 4,700 -4.8% (225) 4,475 Virginia Lynchburg 4,700 -10.0% (471) 4,229 Washington Seattle 4,700 8.0% 377 5,077 Washington Spokane 4,700 -2.7% (127) 4,573 West Virginia Charleston 4,700 -3.3% (155) 4,545 Wisconsin Green Bay 4,700 -4.9% (232) 4,468 Wyoming Cheyenne 4,700 -7.0% (320) 4,371 Puerto Rico Cayey 4,700 -4.0% (190) 4,510 23.5 O&M ESTIMATE The typical O&M expenses for the SO Facility include mirror cleaning, repair, and replacement; thermal tube replacements; and BOP major maintenance. The BOP major maintenance is similar to that which is performed on a combined-cycle plant: HRSG, ST, and electric generator major maintenance, typically performed approximately every seven years. Additionally, most thermal solar operators do not treat O&M on a variable basis, and consequently, all O&M expenses are shown below on a fixed basis. Table 23-3 presents the O&M expenses for the SO Facility. TABLE 23-3 – O&M EXPENSES FOR SO Technology: SO Fixed O&M Expense $64.00/kW-year Variable O&M Expense $0/MWh 23.6 ENVIRONMENTAL COMPLIANCE INFORMATION Table 23-4 presents environmental emissions for the SO Facility. 23-7
  • 179.
    TABLE 23-4 –ENVIRONMENTAL EMISSIONS FOR SO Technology: SO NOX 0 lb/MMBtu SO2 0 lb/MMBtu CO2 0 lb/MMBtu 23-8
  • 180.
    24. PHOTOVOLTAIC (CENTRALSTATION) FACILITY (PV) 24.1 MECHANICAL EQUIPMENT AND SYSTEMS The following describes a nominally 7 MW Photovoltaic (“PV”) Facility. An analysis is also provided for a nominally 150 MW PV Facility, which is essentially a significant expansion of the 7 MW Facility; however, a detailed technical description (due to the similarities with the 7 MW Facility and the technology associated therewith) is not provided herein. The PV Facility uses several ground-mounted, fixed-tilt semiconductor panels in an array to directly convert incident solar radiation in the form of photons into DC electricity, which can then be inverted to AC. Additional BOP components include metal racks and foundations to support fixed panels and keep them aligned at the correct angle, a DC-to-AC inverter, AC and DC wiring, combiner boxes where individual strings of panels are connected prior to being fed into the inverter, and a control system to control and monitor output by adjusting the balance of voltage and current to yield maximum power. Figure 22-1 presents a picture of a typical PV Facility. FIGURE 24-1 – PV DESIGN CONFIGURATION 24.2 ELECTRICAL AND CONTROL SYSTEMS The PV Facility is comprised of 20 half-megawatt building blocks, each block consisting of groups of PV cells connected to a 500 kW inverter module. Groups of PV cells, or modules, are connected in parallel to a combiner box which contains a fuse for each module. The PV cells create DC electricity. The cables are routed from the modules to a combiner box and a number 24-1
  • 181.
    of combiner boxesare connected to the input of a 500 kW inverter module, which converts the aggregate power from DC to three-phase AC electricity at an output voltage of 265 V. The output voltage of the inverter modules is stepped up to a level of 13.8 kV through a series of GSUs connected to the modules. Two modules are combined on each of transformer, each of which is rated 1 MVA. The transformers are connected in groups to form circuits on an underground collection system. The circuits are connected to a 13.8 kV circuit breaker and then to the local utility distribution grid. Each inverter module has its own integral control system. The aggregate of all the modules are controlled through a SCADA system, typically provided by the inverter manufacturer. 24.3 OFF-SITE REQUIREMENTS Unlike other power technologies discussed in this report, the essential off-site requirement for which provisions must be made on a PV Facility are water supply (generally in limited quantities) and an electrical interconnection between the PV Facility switchyard and the local utility distribution system. 24.4 CAPITAL COST ESTIMATE The base Cost Estimate for the PV Facility with a nominal capacity of 7 MW is 6,050/kW and with a nominal capacity of 150 MW is $4,755/kW. Table 24-1 and Table 24-2 summarize the Cost Estimate categories for the PV Facility. 24-2
  • 182.
    TABLE 24-1 –BASE PLANT SITE CAPITAL COST ESTIMATE FOR PV Technology: PV Nominal Capacity (ISO): 7,000 kW Nominal Heat Rate (ISO): N/A Btu/kWh-HHV Capital Cost Category (000s) (October 1, 2010$) Civil Structural Material and Installation 6,100 Mechanical Equipment Supply and Installation 20,500 Electrical / I&C Supply and Installation 3,550 Project Indirects (1) 3,665 EPC Cost before Contingency and Fee 33,815 Fee and Contingency 4,000 Total Project EPC 37,815 Owner Costs (excluding project finance) 4,538 Total Project Cost (excluding finance) 42,353 Total Project EPC / kW 5,402 Owner Costs 12% (excluding project finance) / kW 648 Total Project Cost (excluding project finance) / kW 6,050 (1) Includes engineering, distributable costs, scaffolding, construction management, and start-up. 24-3
  • 183.
    TABLE 24-2 –BASE PLANT SITE CAPITAL COST ESTIMATE FOR PV Technology: PV Nominal Capacity (ISO): 150,000 kW Nominal Heat Rate (ISO): N/A Btu/kWh-HHV Capital Cost Category (000s) (October 1, 2010$) Civil Structural Material and Installation 65,000 Mechanical Equipment Supply and Installation 391,583 Electrical / I&C Supply and Installation 64,350 Project Indirects (1) 52,762 EPC Cost before Contingency and Fee 573,695 Fee and Contingency 68,843 Total Project EPC 642,538 Owner Costs (excluding project finance) 70,679 Total Project Cost (excluding finance) 713,217 Total Project EPC / kW 4,283 Owner Costs 12% (excluding project finance) / kW 471 Total Project Cost (excluding project finance) / kW 4,755 (1) Includes engineering, distributable costs, scaffolding, construction management, and start-up. For this type of technology and power plant configuration, our regional adjustments took into consideration the following: seismic design differences, remote location issues, labor wage and productivity differences, location adjustments, owner cost differences, and the increase in overheads associated with these five location adjustments. Seismic design differences among the various locations were based on U.S. seismic map information that detailed the various seismic zones throughout the U.S. No cost increases were associated with seismic Zone 0 and cost step increases were considered for Zones 1, 2, 3 and 4. Remote location issues are related to geographic areas that typically require installation of man camps, higher craft incentives, and higher per diems are generally required with respect to construction, due to the fact that such areas are long distances from urban areas, where labor is generally abundant. Remote location designations were also considered in locations where higher equipment freight costs are typically incurred, which for example are regions not near established rail or highway access. Remote locations related to the Photovoltaic Facility include 24-4
  • 184.
    Fairbanks, Alaska; Honolulu,Hawaii; Albuquerque, New Mexico; Cheyenne, Wyoming; and Cayey, Puerto Rico. Labor wage and productivity differences were handled as discussed in Section 2.5.1, taking into consideration the amount of labor we estimated for the PV Facility. Location adjustments were made to locations where higher cost of living levels are incurred and/or where population density generally correlates to higher construction costs for power and other infrastructure projects. These locations include Alaska, California, Connecticut, Delaware, District of Columbia, Hawaii, Illinois, Maine, Maryland, Massachusetts, Michigan, Minnesota, New York, Ohio, and Wisconsin. Owner costs were reviewed based on the need for utility upgrades and/or infrastructure costs such as new facility transmission lines to tie to existing utility transmission substations or existing transmission lines. Table 24-3 and Table 24-4 present the PV Facility capital cost variations for alternative U.S. plant locations. 24-5
  • 185.
    TABLE 24-3 –LOCATION-BASED COSTS FOR PV (7 MW) (OCTOBER 1, 2010 DOLLARS) Base Project Location Delta Cost Total Location Cost Percent Difference Project Cost State City ($/kW) Variation ($/kW) ($/kW) Alaska Anchorage 6,050 16.8% 1,016 7,066 Alaska Fairbanks 6,050 25.6% 1,548 7,598 Alabama Huntsville 6,050 -7.3% (441) 5,609 Arizona Phoenix 6,050 -5.7% (344) 5,706 Arkansas Little Rock 6,050 -5.9% (359) 5,691 California Los Angeles 6,050 8.1% 490 6,540 California Redding 6,050 4.6% 277 6,327 California Bakersfield 6,050 5.0% 301 6,351 California Sacramento 6,050 9.1% 549 6,599 California San Francisco 6,050 18.1% 1,096 7,146 Colorado Denver 6,050 -4.3% (263) 5,787 Connecticut Hartford 6,050 6.2% 376 6,426 Delaware Dover 6,050 3.3% 198 6,248 District of Columbia Washington 6,050 1.6% 96 6,146 Florida Tallahassee 6,050 -10.0% (605) 5,445 Florida Tampa 6,050 -4.1% (250) 5,800 Georgia Atlanta 6,050 -7.9% (480) 5,570 Hawaii Honolulu 6,050 29.9% 1,812 7,862 Idaho Boise 6,050 -2.7% (162) 5,888 Illinois Chicago 6,050 17.8% 1,075 7,125 Indiana Indianapolis 6,050 -1.2% (70) 5,980 Iowa Davenport 6,050 0.6% 38 6,088 Iowa Waterloo 6,050 -6.6% (399) 5,651 Kansas Wichita 6,050 -5.0% (303) 5,747 Kentucky Louisville 6,050 -6.0% (364) 5,686 Louisiana New Orleans 6,050 -10.3% (622) 5,428 Maine Portland 6,050 -3.4% (203) 5,847 Maryland Baltimore 6,050 -2.6% (158) 5,892 Massachusetts Boston 6,050 14.6% 885 6,935 Michigan Detroit 6,050 3.1% 188 6,238 Michigan Grand Rapids 6,050 -7.6% (461) 5,589 Minnesota St. Paul 6,050 5.1% 308 6,358 Mississippi Jackson 6,050 -7.2% (438) 5,612 Missouri St. Louis 6,050 3.9% 233 6,283 Missouri Kansas City 6,050 2.0% 123 6,173 Montana Great Falls 6,050 -2.9% (178) 5,872 Nebraska Omaha 6,050 -1.9% (114) 5,936 New Hampshire Concord 6,050 -0.7% (42) 6,008 New Jersey Newark 6,050 14.4% 869 6,919 New Mexico Albuquerque 6,050 -2.5% (154) 5,896 24-6
  • 186.
    Base Project Location Delta Cost Total Location Cost Percent Difference Project Cost State City ($/kW) Variation ($/kW) ($/kW) New York New York 6,050 32.9% 1,988 8,038 New York Syracuse 6,050 -1.4% (86) 5,964 Nevada Las Vegas 6,050 7.9% 476 6,526 North Carolina Charlotte 6,050 -10.6% (640) 5,410 North Dakota Bismarck 6,050 -5.3% (318) 5,732 Ohio Cincinnati 6,050 -4.2% (256) 5,794 Oregon Portland 6,050 4.3% 260 6,310 Pennsylvania Philadelphia 6,050 10.5% 634 6,684 Pennsylvania Wilkes-Barre 6,050 -4.6% (281) 5,769 Rhode Island Providence 6,050 2.7% 166 6,216 South Carolina Spartanburg 6,050 -12.1% (731) 5,319 South Dakota Rapid City 6,050 -7.9% (477) 5,573 Tennessee Knoxville 6,050 -9.3% (562) 5,488 Texas Houston 6,050 -9.2% (557) 5,493 Utah Salt Lake City 6,050 -4.0% (240) 5,810 Vermont Burlington 6,050 -4.2% (256) 5,794 Virginia Alexandria 6,050 -3.1% (185) 5,865 Virginia Lynchburg 6,050 -6.5% (391) 5,659 Washington Seattle 6,050 5.3% 322 6,372 Washington Spokane 6,050 -1.3% (81) 5,969 West Virginia Charleston 6,050 -2.0% (124) 5,926 Wisconsin Green Bay 6,050 -3.1% (190) 5,860 Wyoming Cheyenne 6,050 -4.0% (240) 5,810 Puerto Rico Cayey 6,050 -1.9% (117) 5,933 24-7
  • 187.
    TABLE 24-4 –LOCATION-BASED COSTS FOR PV (150 MW) (OCTOBER 1, 2010 DOLLARS) Base Project Location Delta Cost Total Location Cost Percent Difference Project Cost State City ($/kW) Variation ($/kW) ($/kW) Alaska Anchorage 4,755 19.9% 947 5,702 Alaska Fairbanks 4,755 30.9% 1,470 6,225 Alabama Huntsville 4,755 -8.0% (379) 4,376 Arizona Phoenix 4,755 -6.2% (294) 4,461 Arkansas Little Rock 4,755 -6.5% (307) 4,448 California Los Angeles 4,755 9.6% 458 5,213 California Redding 4,755 5.5% 263 5,018 California Bakersfield 4,755 6.1% 291 5,046 California Sacramento 4,755 10.5% 498 5,253 California San Francisco 4,755 20.7% 985 5,740 Colorado Denver 4,755 -4.4% (208) 4,547 Connecticut Hartford 4,755 7.1% 339 5,094 Delaware Dover 4,755 3.8% 183 4,938 District of Columbia Washington 4,755 2.3% 111 4,866 Florida Tallahassee 4,755 -11.0% (522) 4,233 Florida Tampa 4,755 -4.5% (216) 4,539 Georgia Atlanta 4,755 -8.7% (413) 4,342 Hawaii Honolulu 4,755 37.2% 1,771 6,526 Idaho Boise 4,755 -2.5% (119) 4,636 Illinois Chicago 4,755 19.9% 949 5,704 Indiana Indianapolis 4,755 -1.2% (57) 4,698 Iowa Davenport 4,755 1.1% 51 4,806 Iowa Waterloo 4,755 -6.9% (327) 4,428 Kansas Wichita 4,755 -5.1% (242) 4,513 Kentucky Louisville 4,755 -6.6% (313) 4,442 Louisiana New Orleans 4,755 -11.3% (537) 4,218 Maine Portland 4,755 -3.2% (152) 4,603 Maryland Baltimore 4,755 -2.6% (124) 4,631 Massachusetts Boston 4,755 16.4% 778 5,533 Michigan Detroit 4,755 3.4% 163 4,918 Michigan Grand Rapids 4,755 -8.4% (398) 4,357 Minnesota St. Paul 4,755 6.0% 286 5,041 Mississippi Jackson 4,755 -7.9% (377) 4,378 Missouri St. Louis 4,755 4.4% 208 4,963 Missouri Kansas City 4,755 2.3% 109 4,864 Montana Great Falls 4,755 -2.7% (130) 4,625 Nebraska Omaha 4,755 -1.7% (79) 4,676 New Hampshire Concord 4,755 -0.3% (15) 4,740 New Jersey Newark 4,755 15.8% 751 5,506 New Mexico Albuquerque 4,755 -2.3% (111) 4,644 24-8
  • 188.
    Base Project Location Delta Cost Total Location Cost Percent Difference Project Cost State City ($/kW) Variation ($/kW) ($/kW) New York New York 4,755 36.6% 1,739 6,494 New York Syracuse 4,755 -1.4% (68) 4,687 Nevada Las Vegas 4,755 9.1% 432 5,187 North Carolina Charlotte 4,755 -11.6% (549) 4,206 North Dakota Bismarck 4,755 -5.3% (254) 4,501 Ohio Cincinnati 4,755 -4.6% (220) 4,535 Oregon Portland 4,755 5.2% 249 5,004 Pennsylvania Philadelphia 4,755 11.6% 550 5,305 Pennsylvania Wilkes-Barre 4,755 -5.0% (240) 4,515 Rhode Island Providence 4,755 3.1% 146 4,901 South Carolina Spartanburg 4,755 -13.2% (628) 4,127 South Dakota Rapid City 4,755 -8.2% (392) 4,363 Tennessee Knoxville 4,755 -10.2% (483) 4,272 Texas Houston 4,755 -10.1% (481) 4,274 Utah Salt Lake City 4,755 -3.8% (183) 4,572 Vermont Burlington 4,755 -4.2% (201) 4,554 Virginia Alexandria 4,755 -3.3% (159) 4,596 Virginia Lynchburg 4,755 -7.1% (336) 4,419 Washington Seattle 4,755 6.0% 284 5,039 Washington Spokane 4,755 -1.0% (49) 4,706 West Virginia Charleston 4,755 -2.2% (103) 4,652 Wisconsin Green Bay 4,755 -3.4% (161) 4,594 Wyoming Cheyenne 4,755 -3.8% (180) 4,575 Puerto Rico Cayey 4,755 -1.4% (68) 4,687 24.5 O&M ESTIMATE The significant O&M items for a PV Facility include periodic inverter maintenance and periodic panel water washing. Additionally, most thermal solar operators do not treat O&M on a variable basis, and consequently, all O&M expenses are shown below on a fixed basis. Table 24-5 and Table 24-6 present the O&M expenses for the PV Facility. TABLE 24-5 – O&M EXPENSES FOR PV FACILITY (7 MW) Technology: PV Fixed O&M Expense $26.40/kW-year Variable O&M Expense $0/MWh TABLE 24-6 – O&M EXPENSES FOR PV FACILITY (150 MW) Technology: PV Fixed O&M Expense $16.70/kW-year Variable O&M Expense $0/MWh 24-9
  • 189.
    24.6 ENVIRONMENTAL COMPLIANCEINFORMATION Table 24-7 presents environmental emissions for the PV Facility. TABLE 24-7 – ENVIRONMENTAL EMISSIONS FOR PV Technology: Photovoltaic NOX 0 lb/MMBtu SO2 0 lb/MMBtu CO2 0 lb/MMBtu 24-10