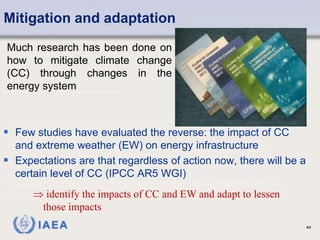
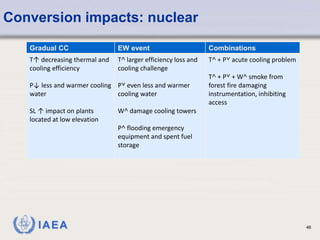
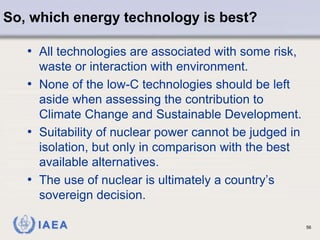
Download to read offline

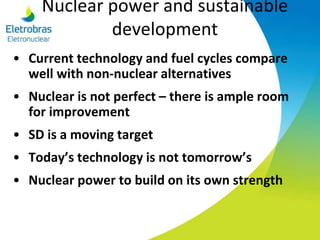
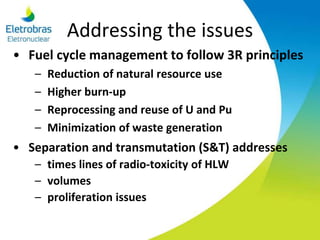
![Mitigation – Role of nuclear
power
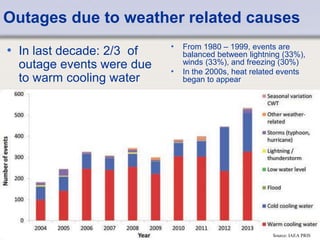
Life cycle GHG emissions of different electricity generating options
Nuclear power: Very low lifetime GHG emissions make
the technology a potent climate change mitigation option
[8]
[12]
[10]
[16]
[8]
0
200
400
600
800
1 000
1 200
1 400
1 600
1 800
lignite coal oil gas CCS
[8]
[12]
[10]
[16]
[8]
0
200
400
600
800
1 000
1 200
1 400
1 600
1 800
lignite coal oil gas CCS
[15][15]
[16]
[15]
[13]
[8]
[4]
Standard deviation
Mean
Min - Max
[sample size]
0
20
40
60
80
100
120
140
160
180
hydro nuclear wind solar
PV
bio-
mass
storage
[16]
[15]
[13]
[8]
[4]
Standard deviation
Mean
Min - Max
[sample size]
0
20
40
60
80
100
120
140
160
180
hydro nuclear wind solar
PV
bio-
mass
storage
gCO2-eqperkWh](https://image.slidesharecdn.com/nuclearpowerandsustainabledevelopment-160729163008/85/Nuclear-power-and-sustainable-development-25-320.jpg)


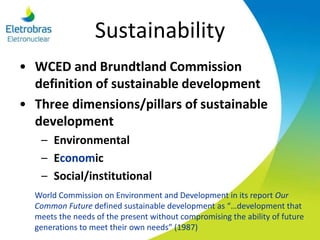
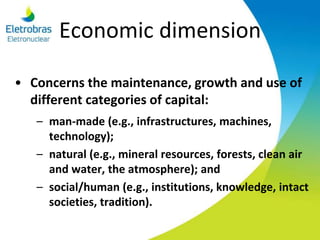
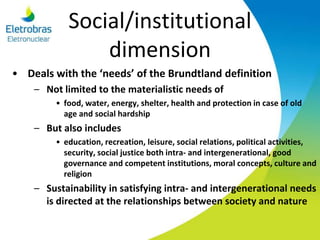
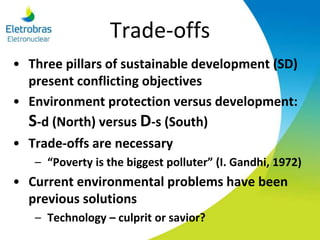
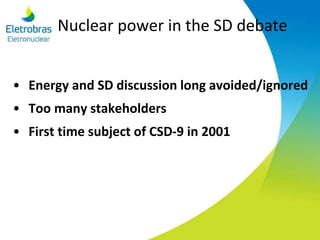
The document discusses the relationship between nuclear power and sustainable development, detailing the three pillars of sustainability: environmental, economic, and social/institutional dimensions. It highlights the debate surrounding nuclear energy's role in climate change mitigation, emphasizing its low greenhouse gas emissions and potential to expand electricity supplies while addressing waste management concerns. Ultimately, it asserts that while nuclear power has advantages in promoting sustainability, it also faces challenges such as safety risks and public acceptance.