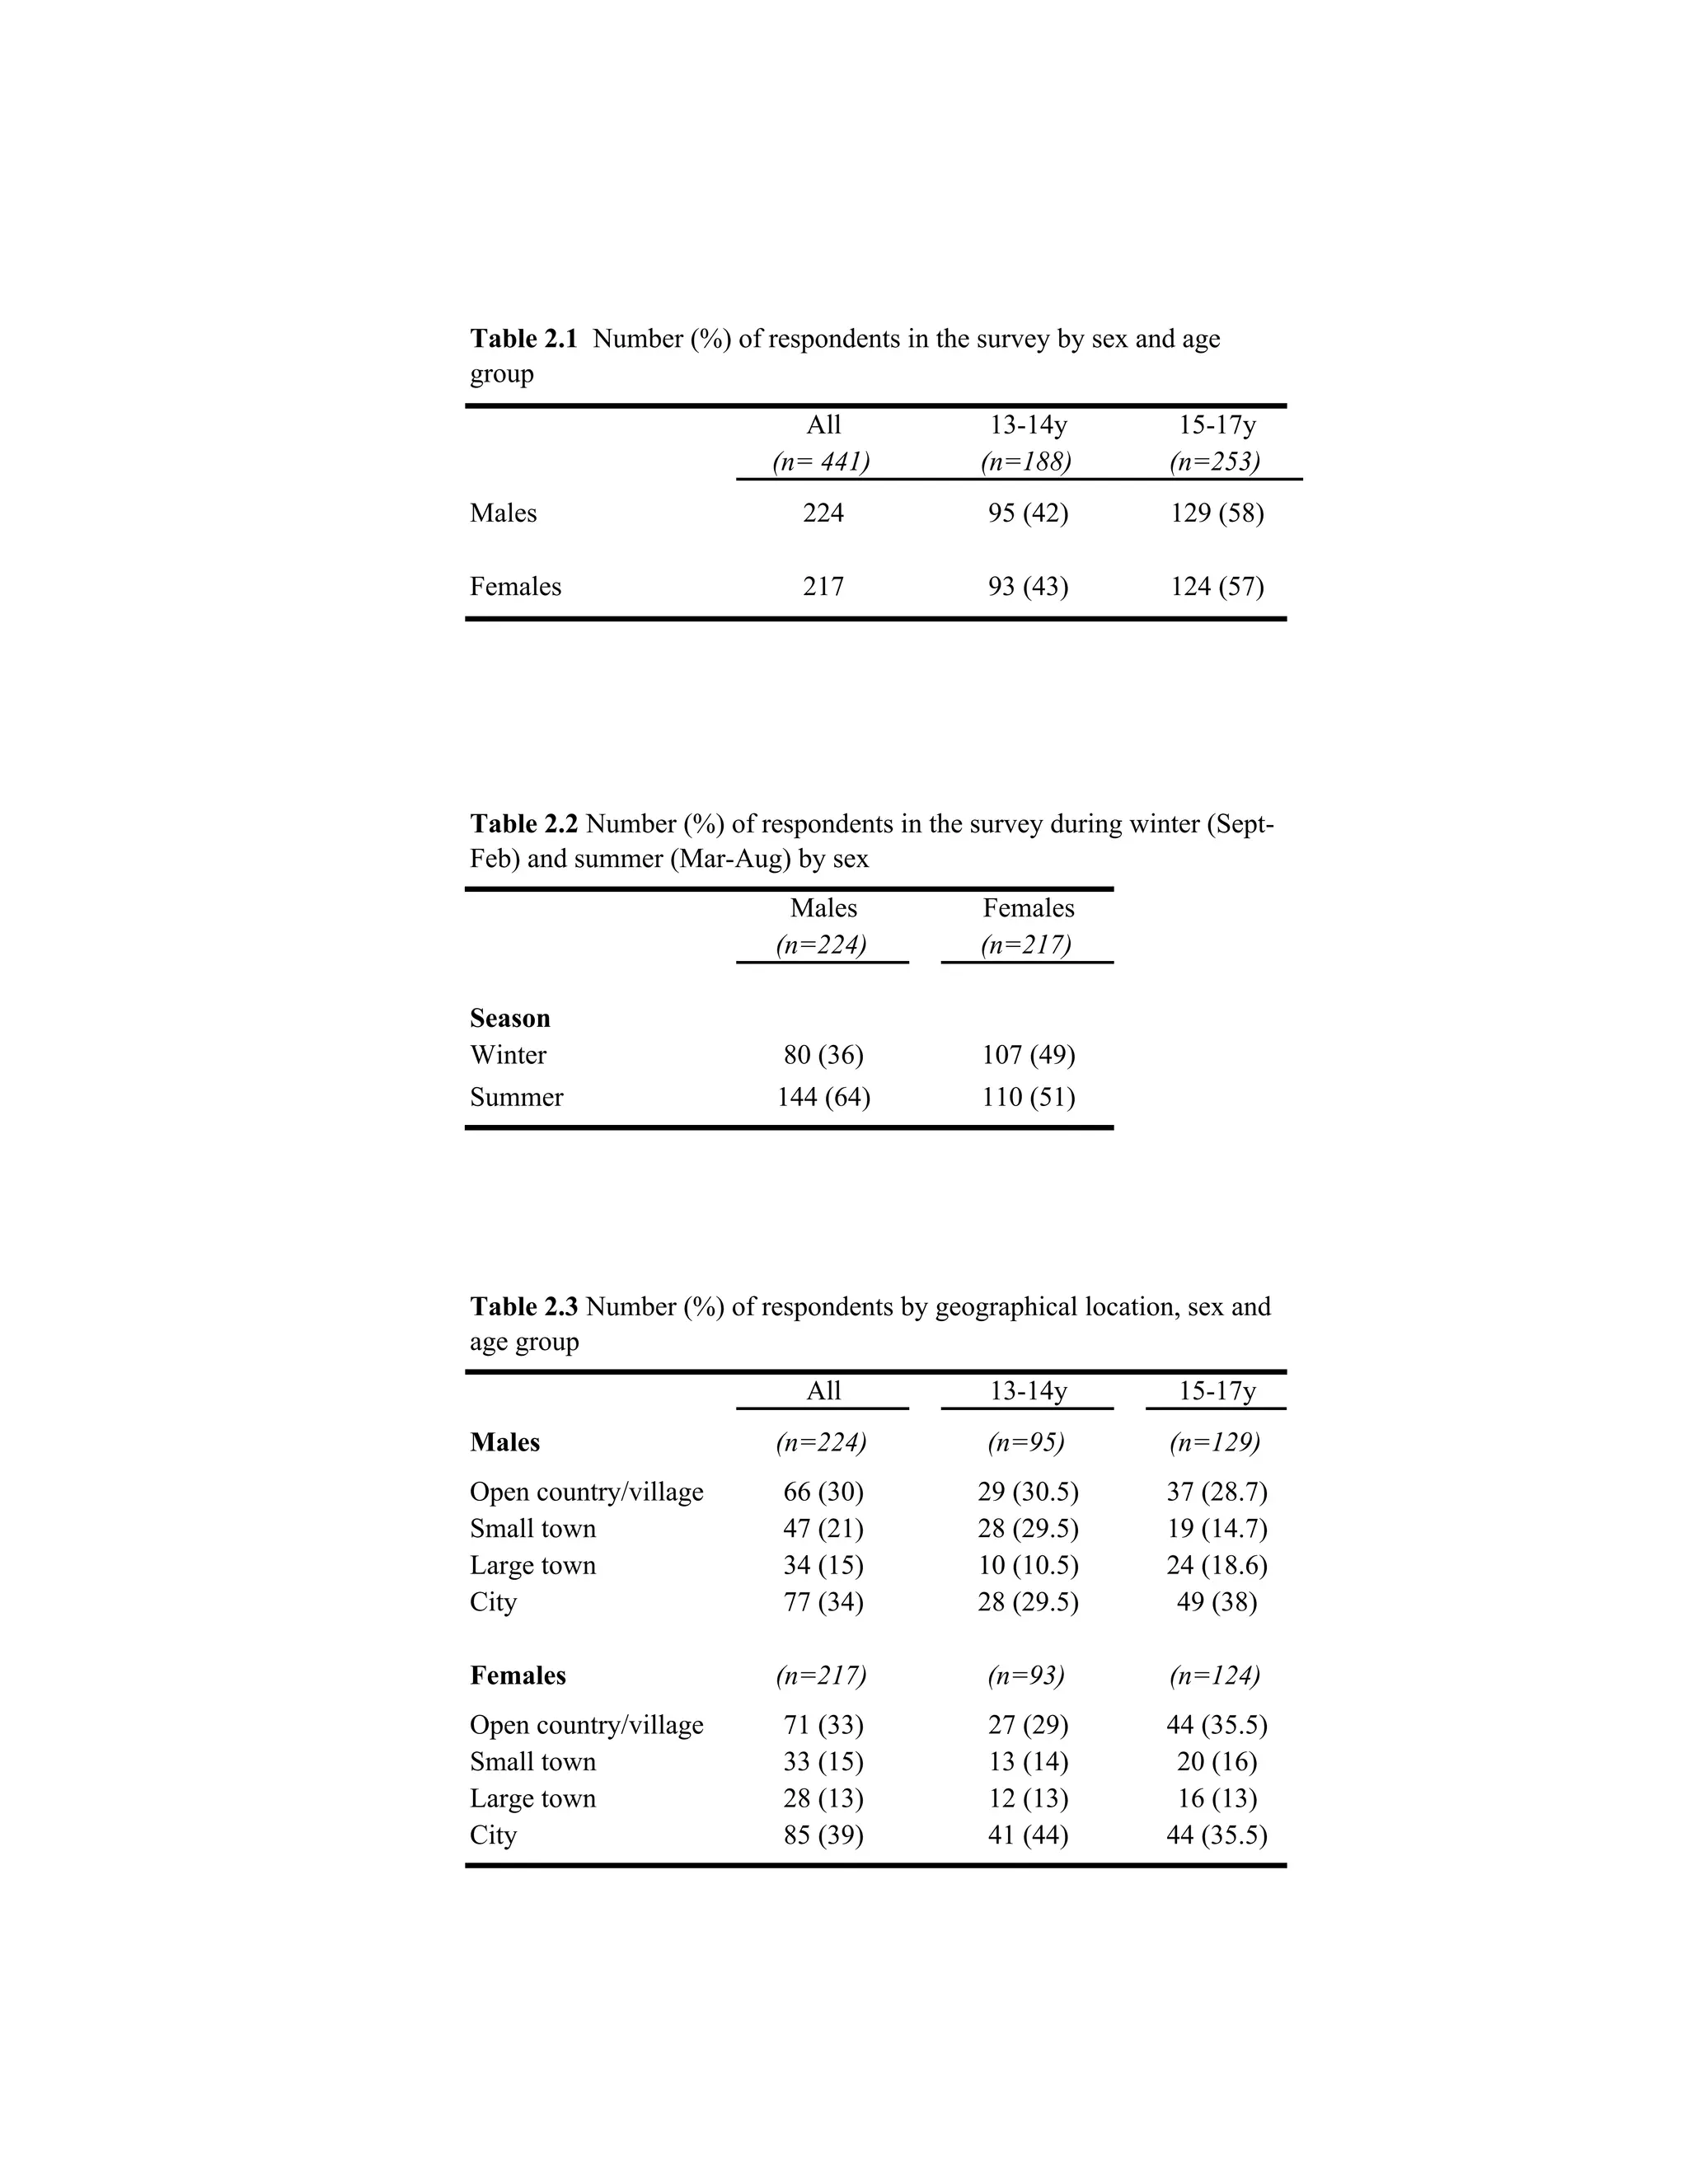
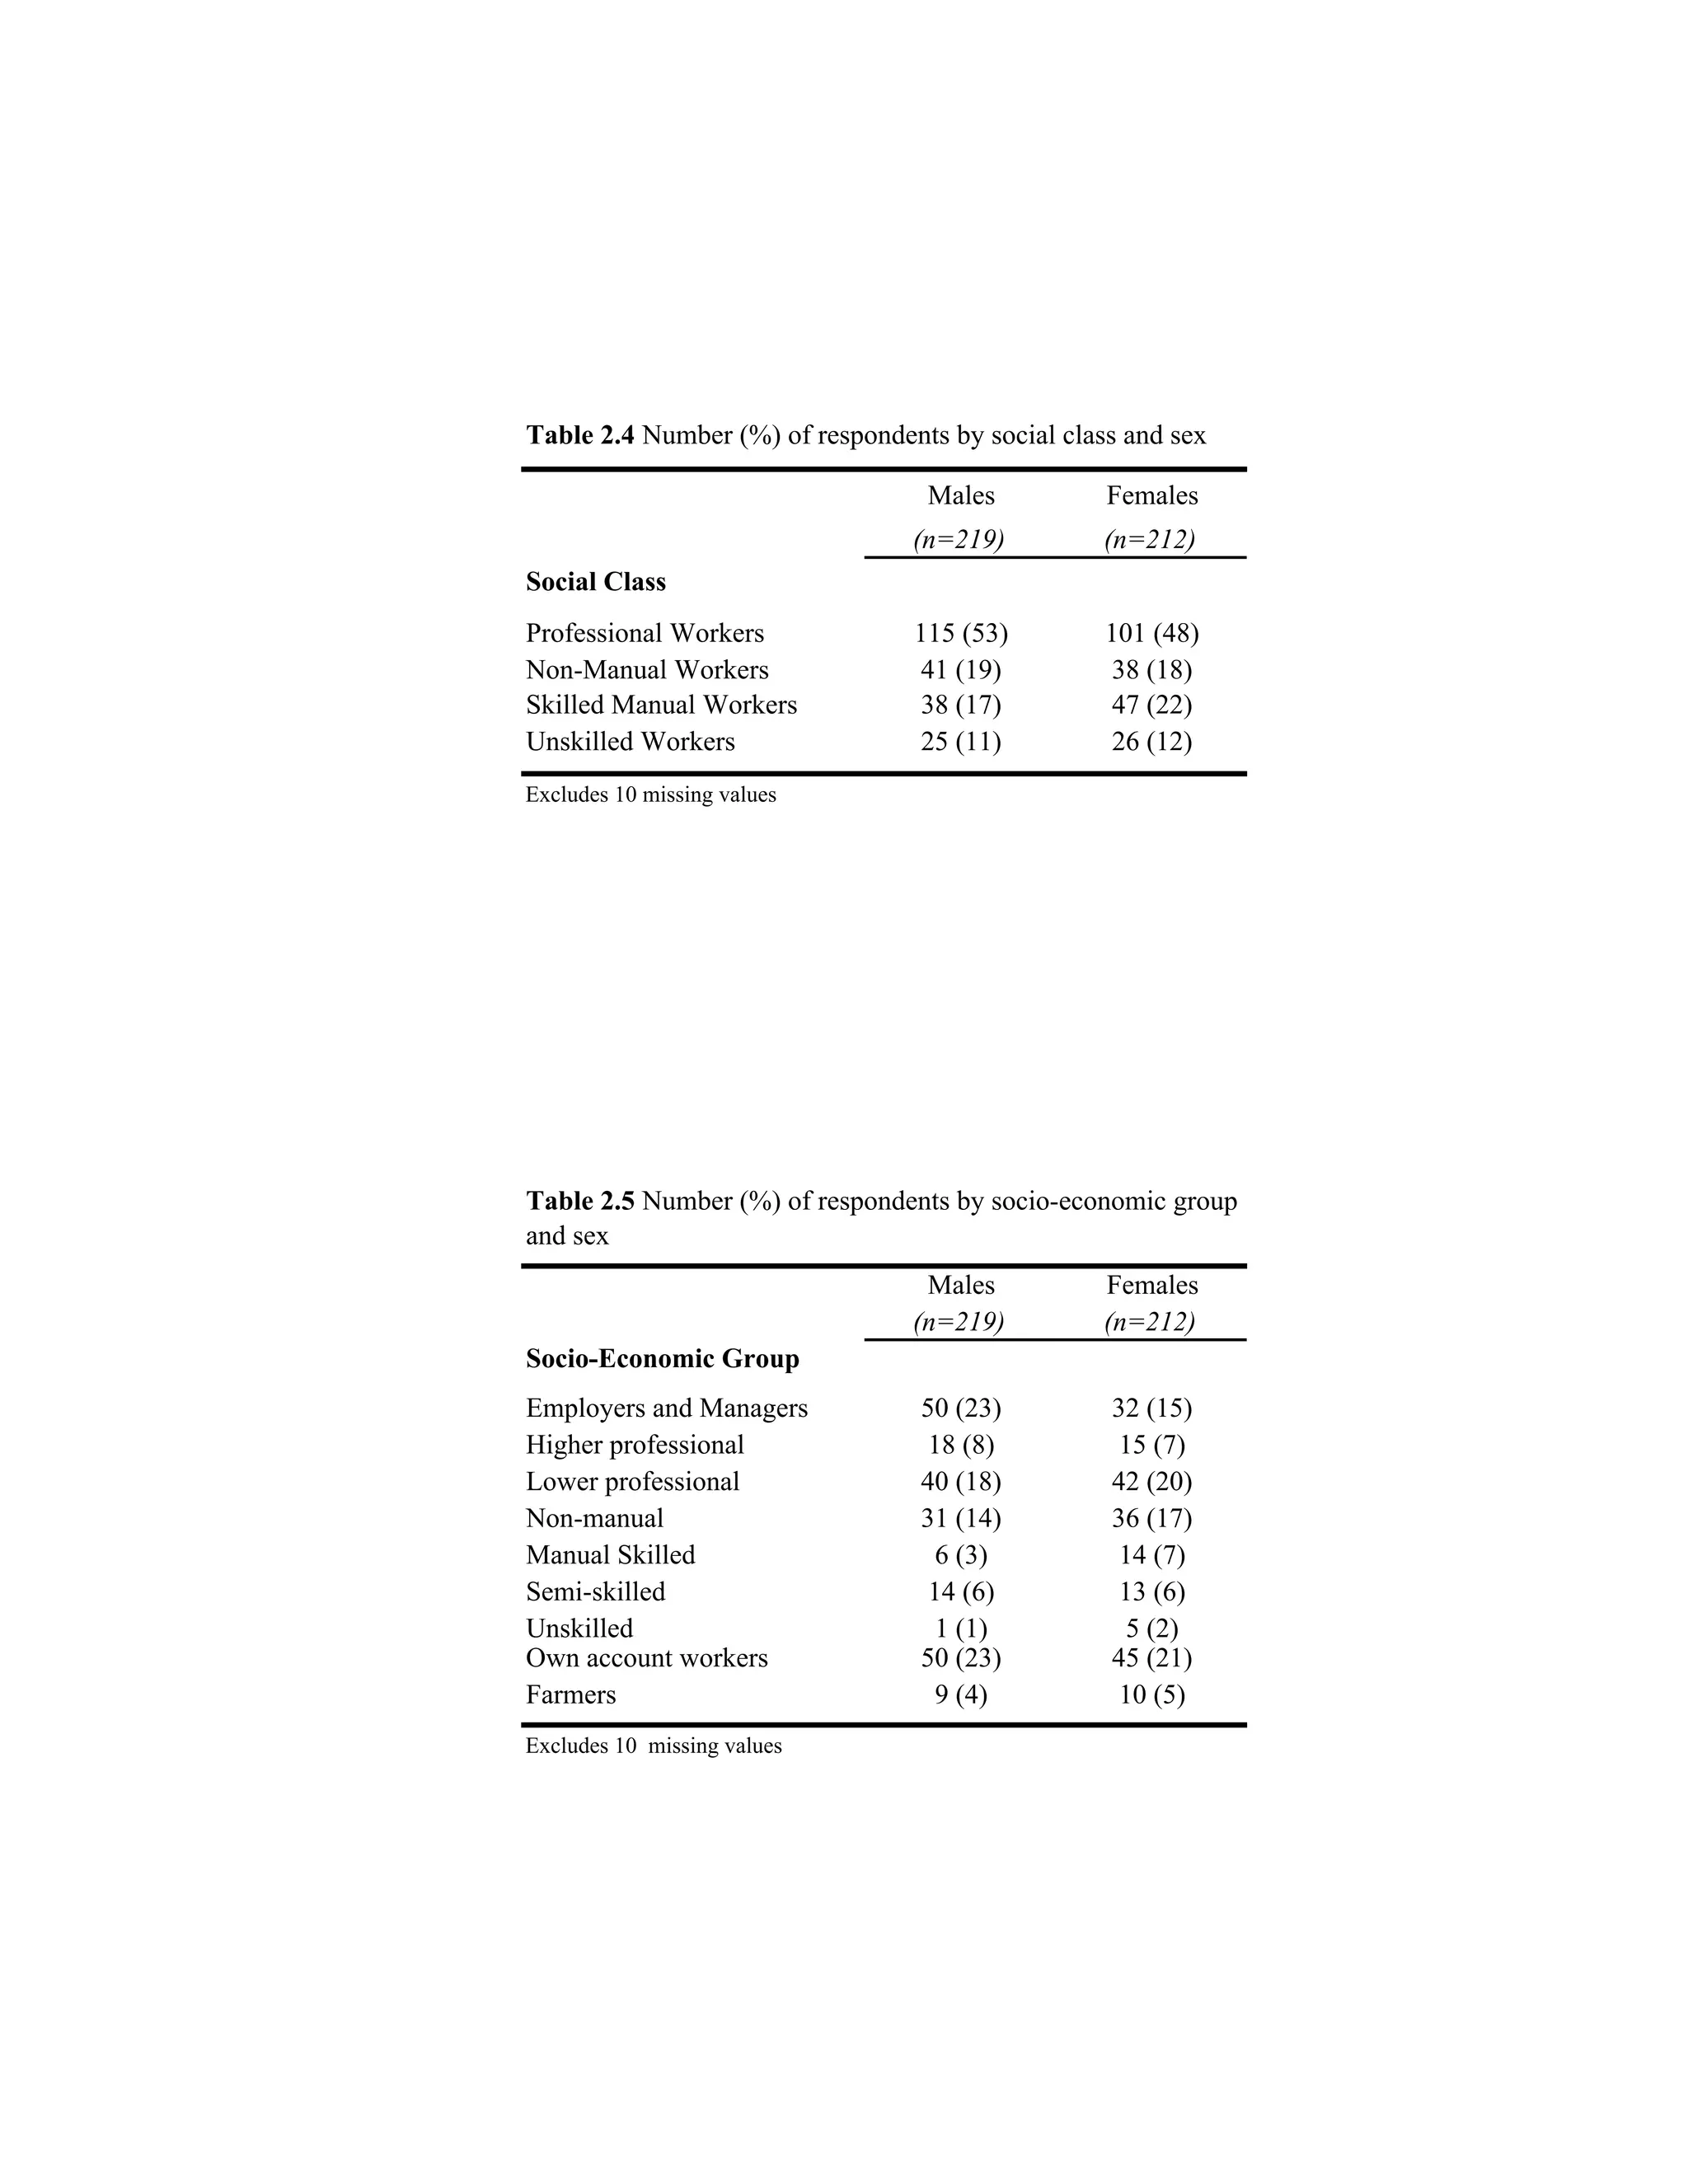
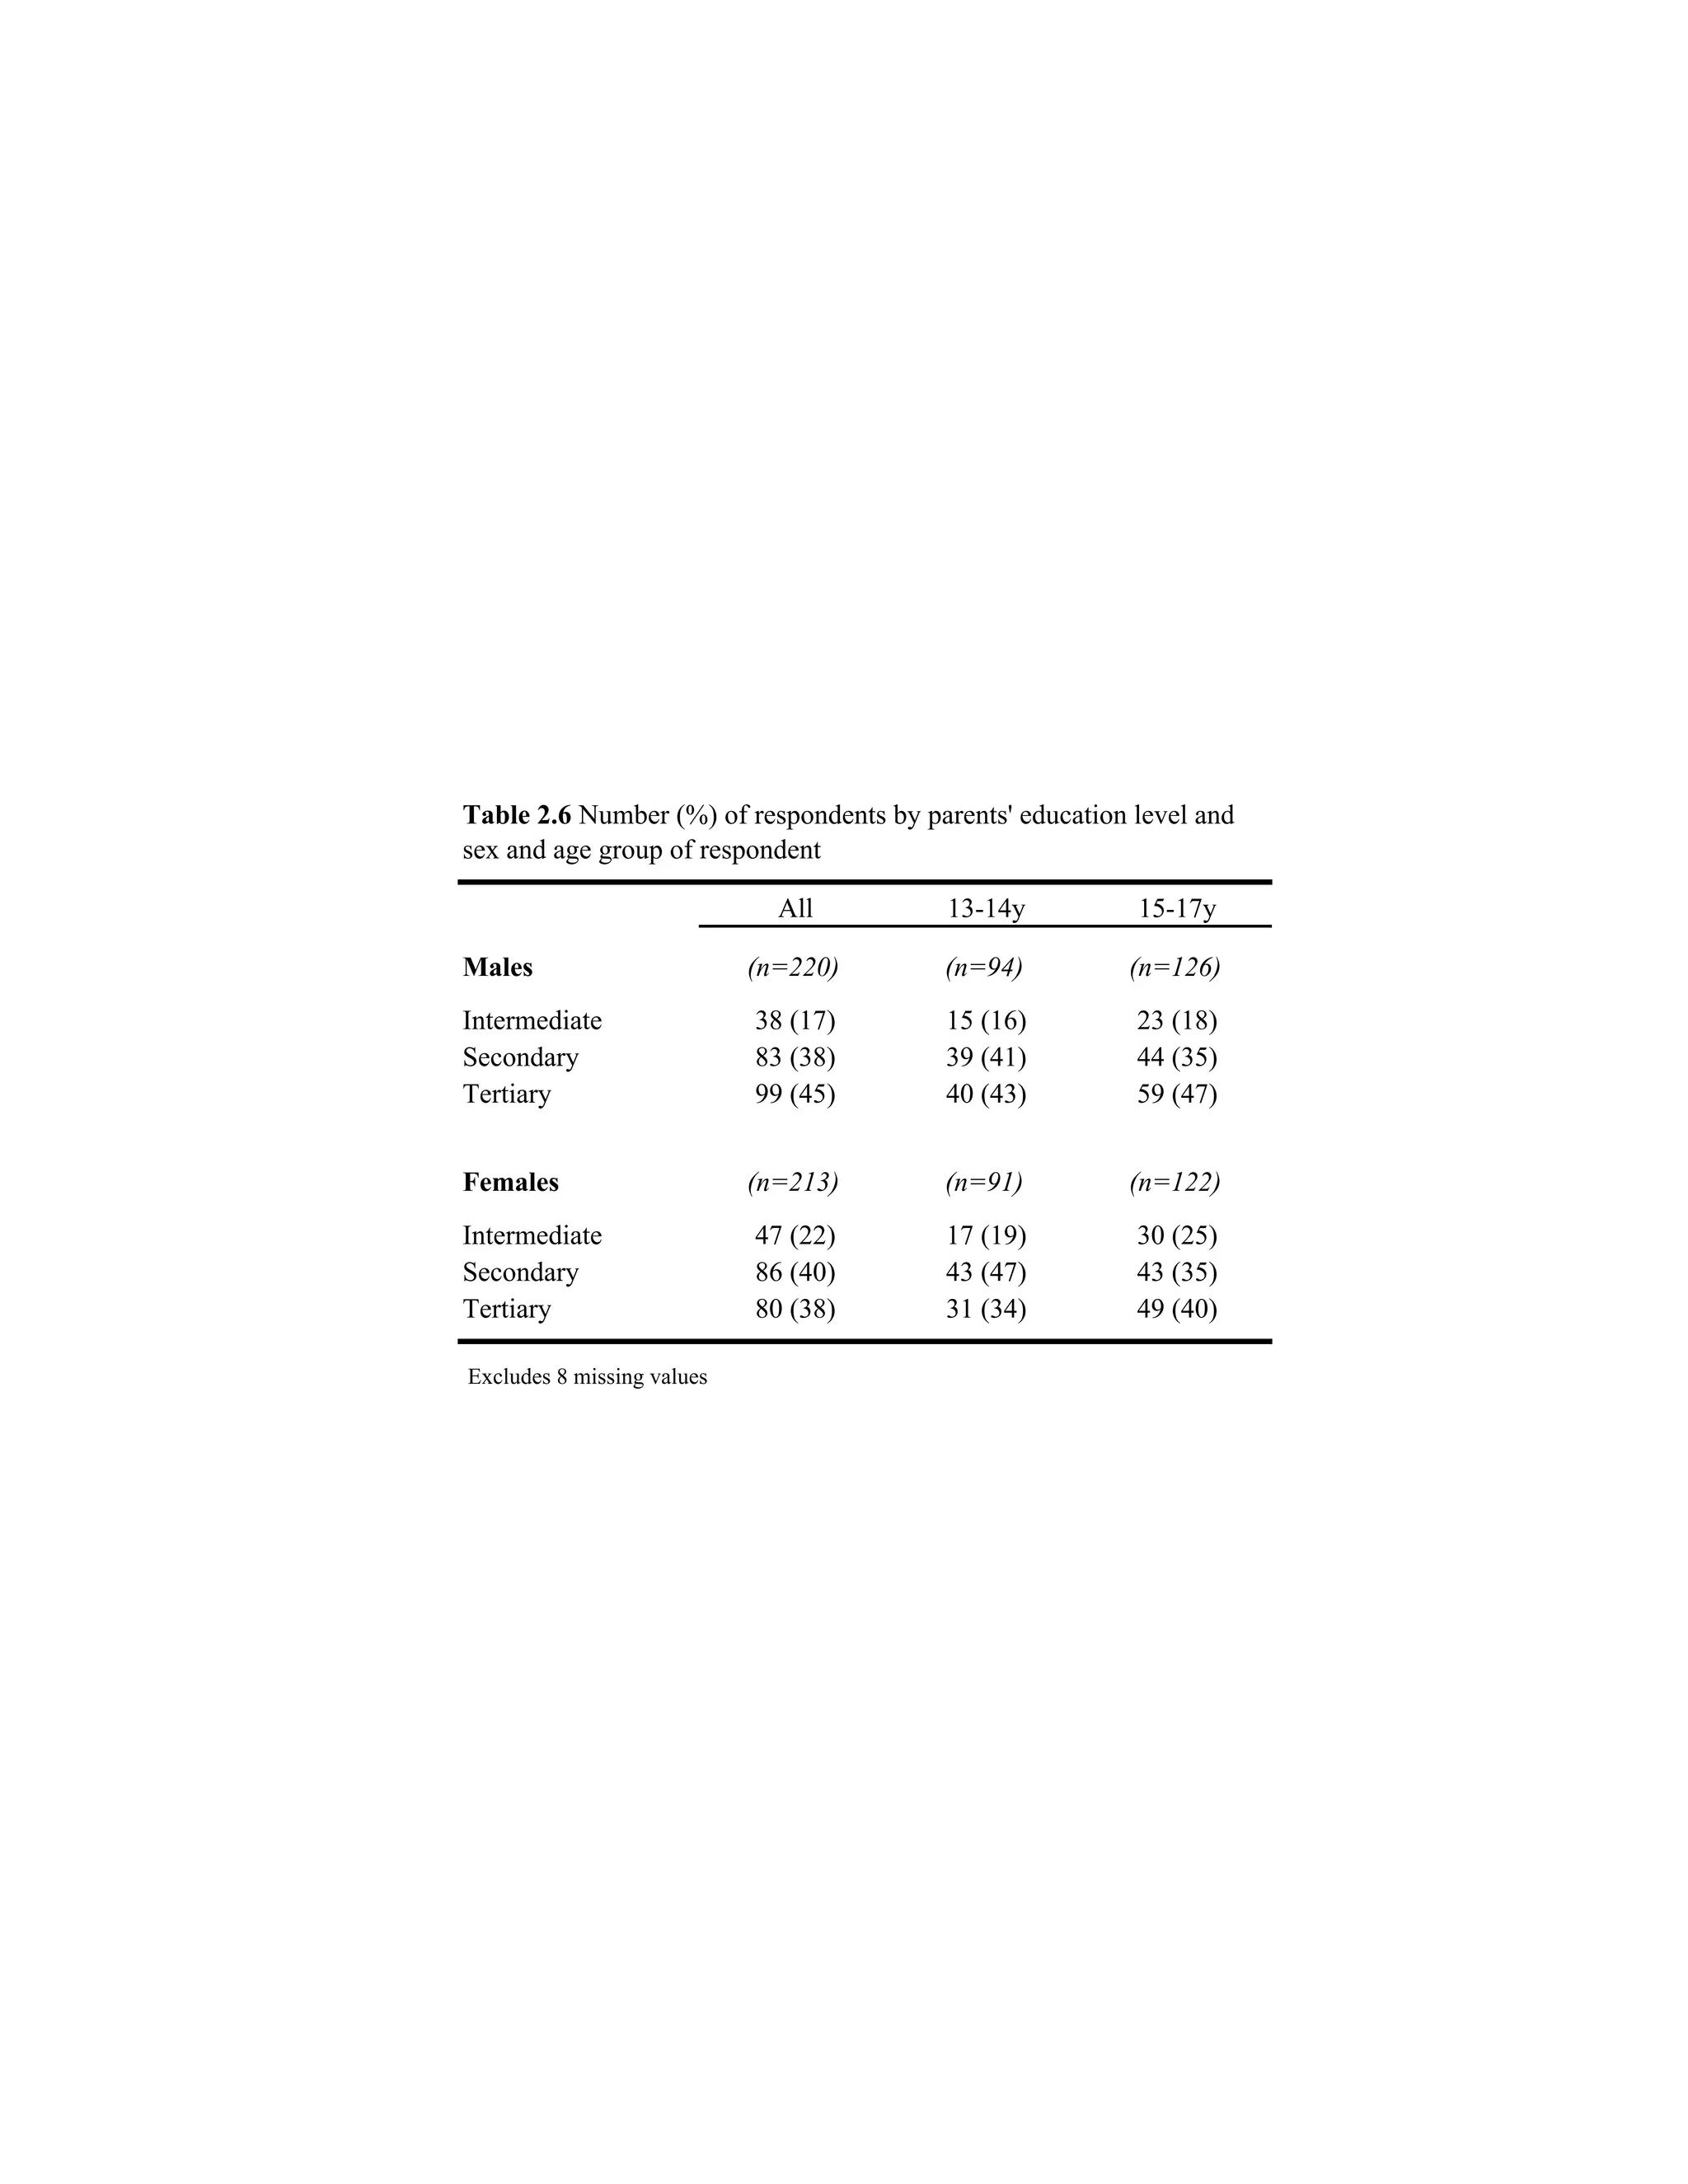
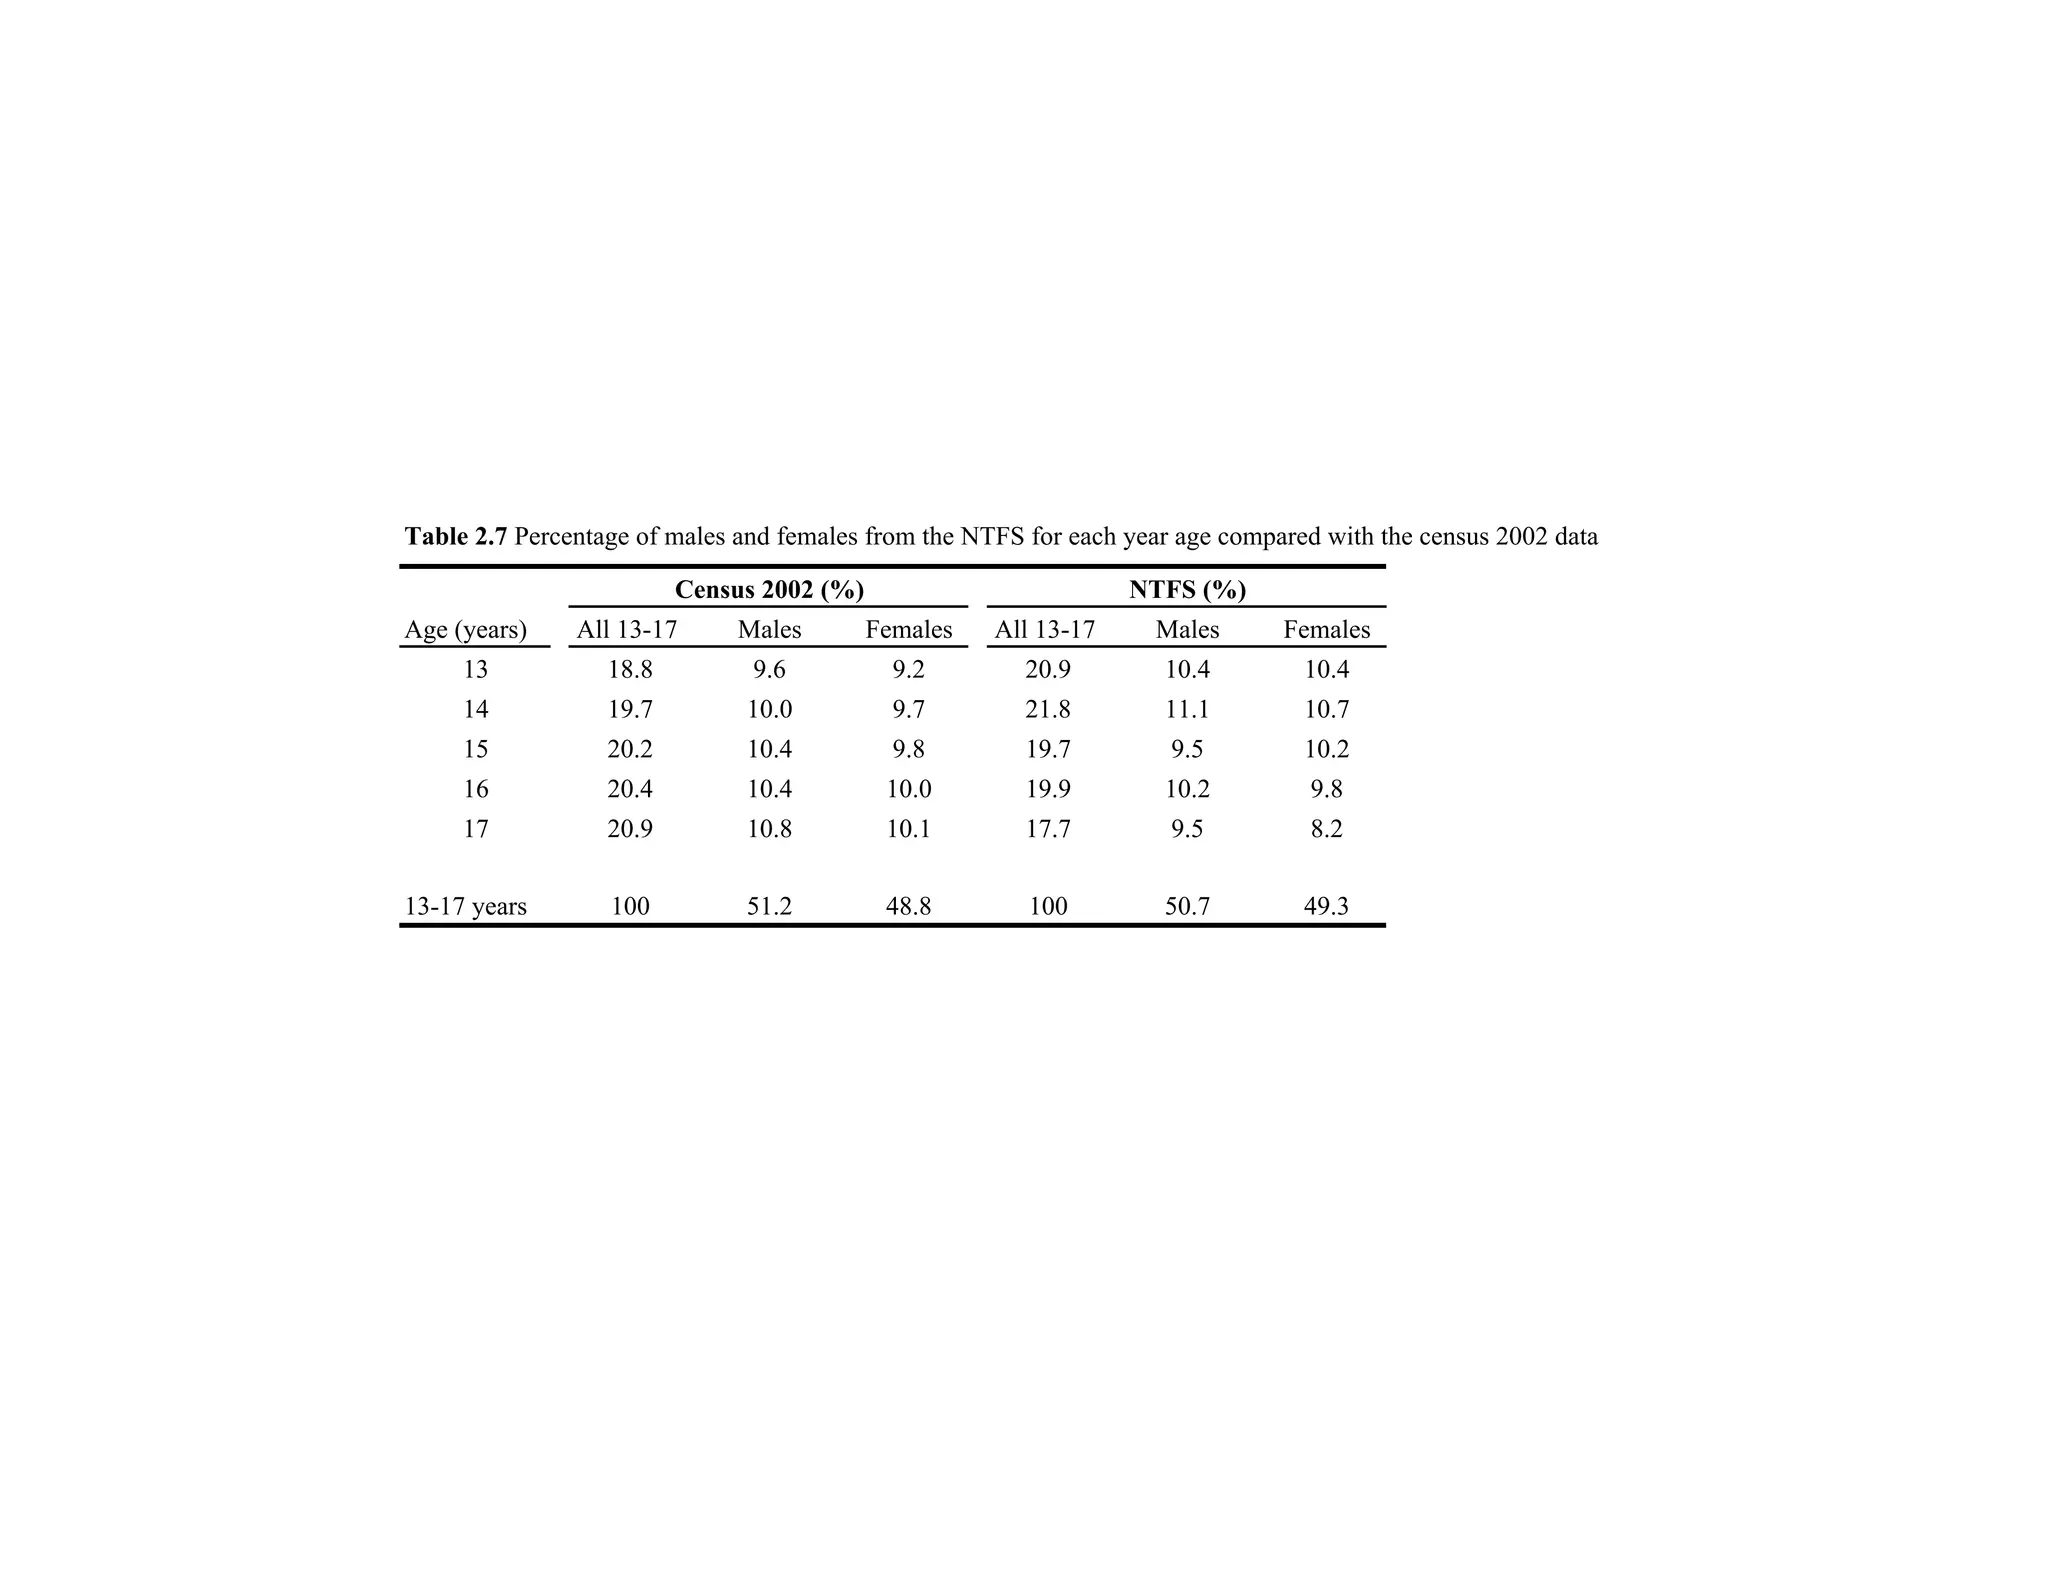
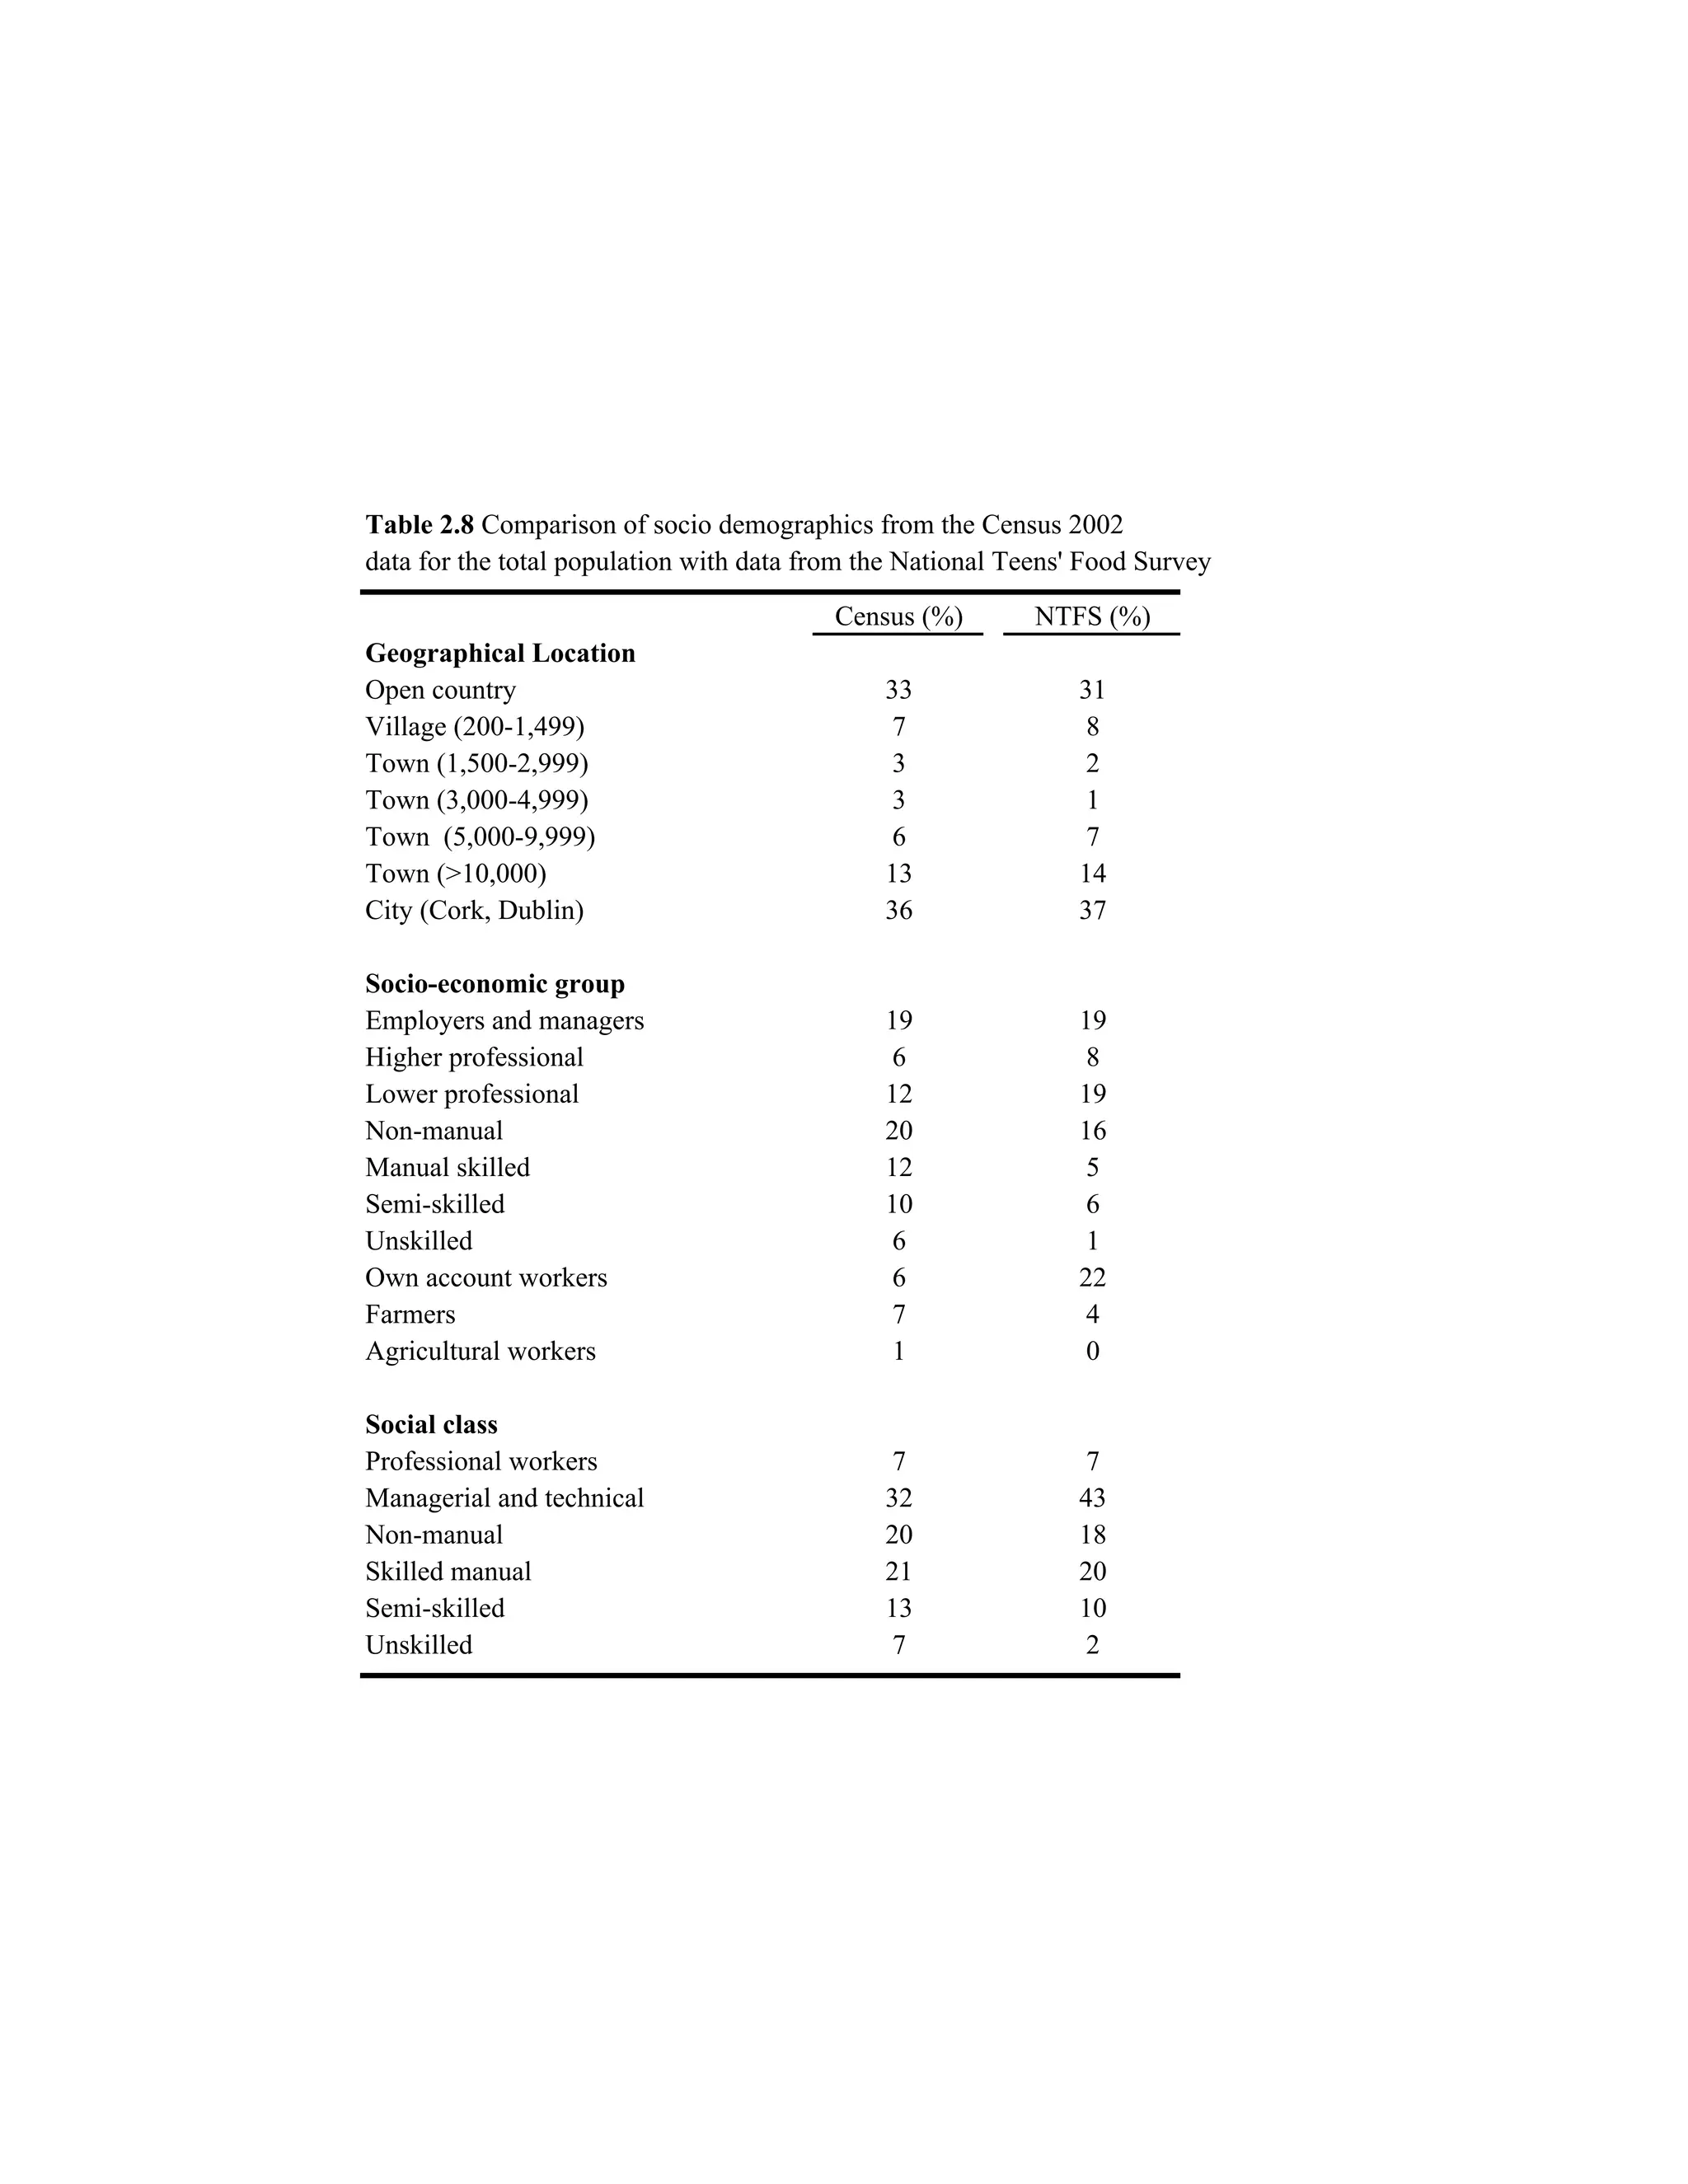
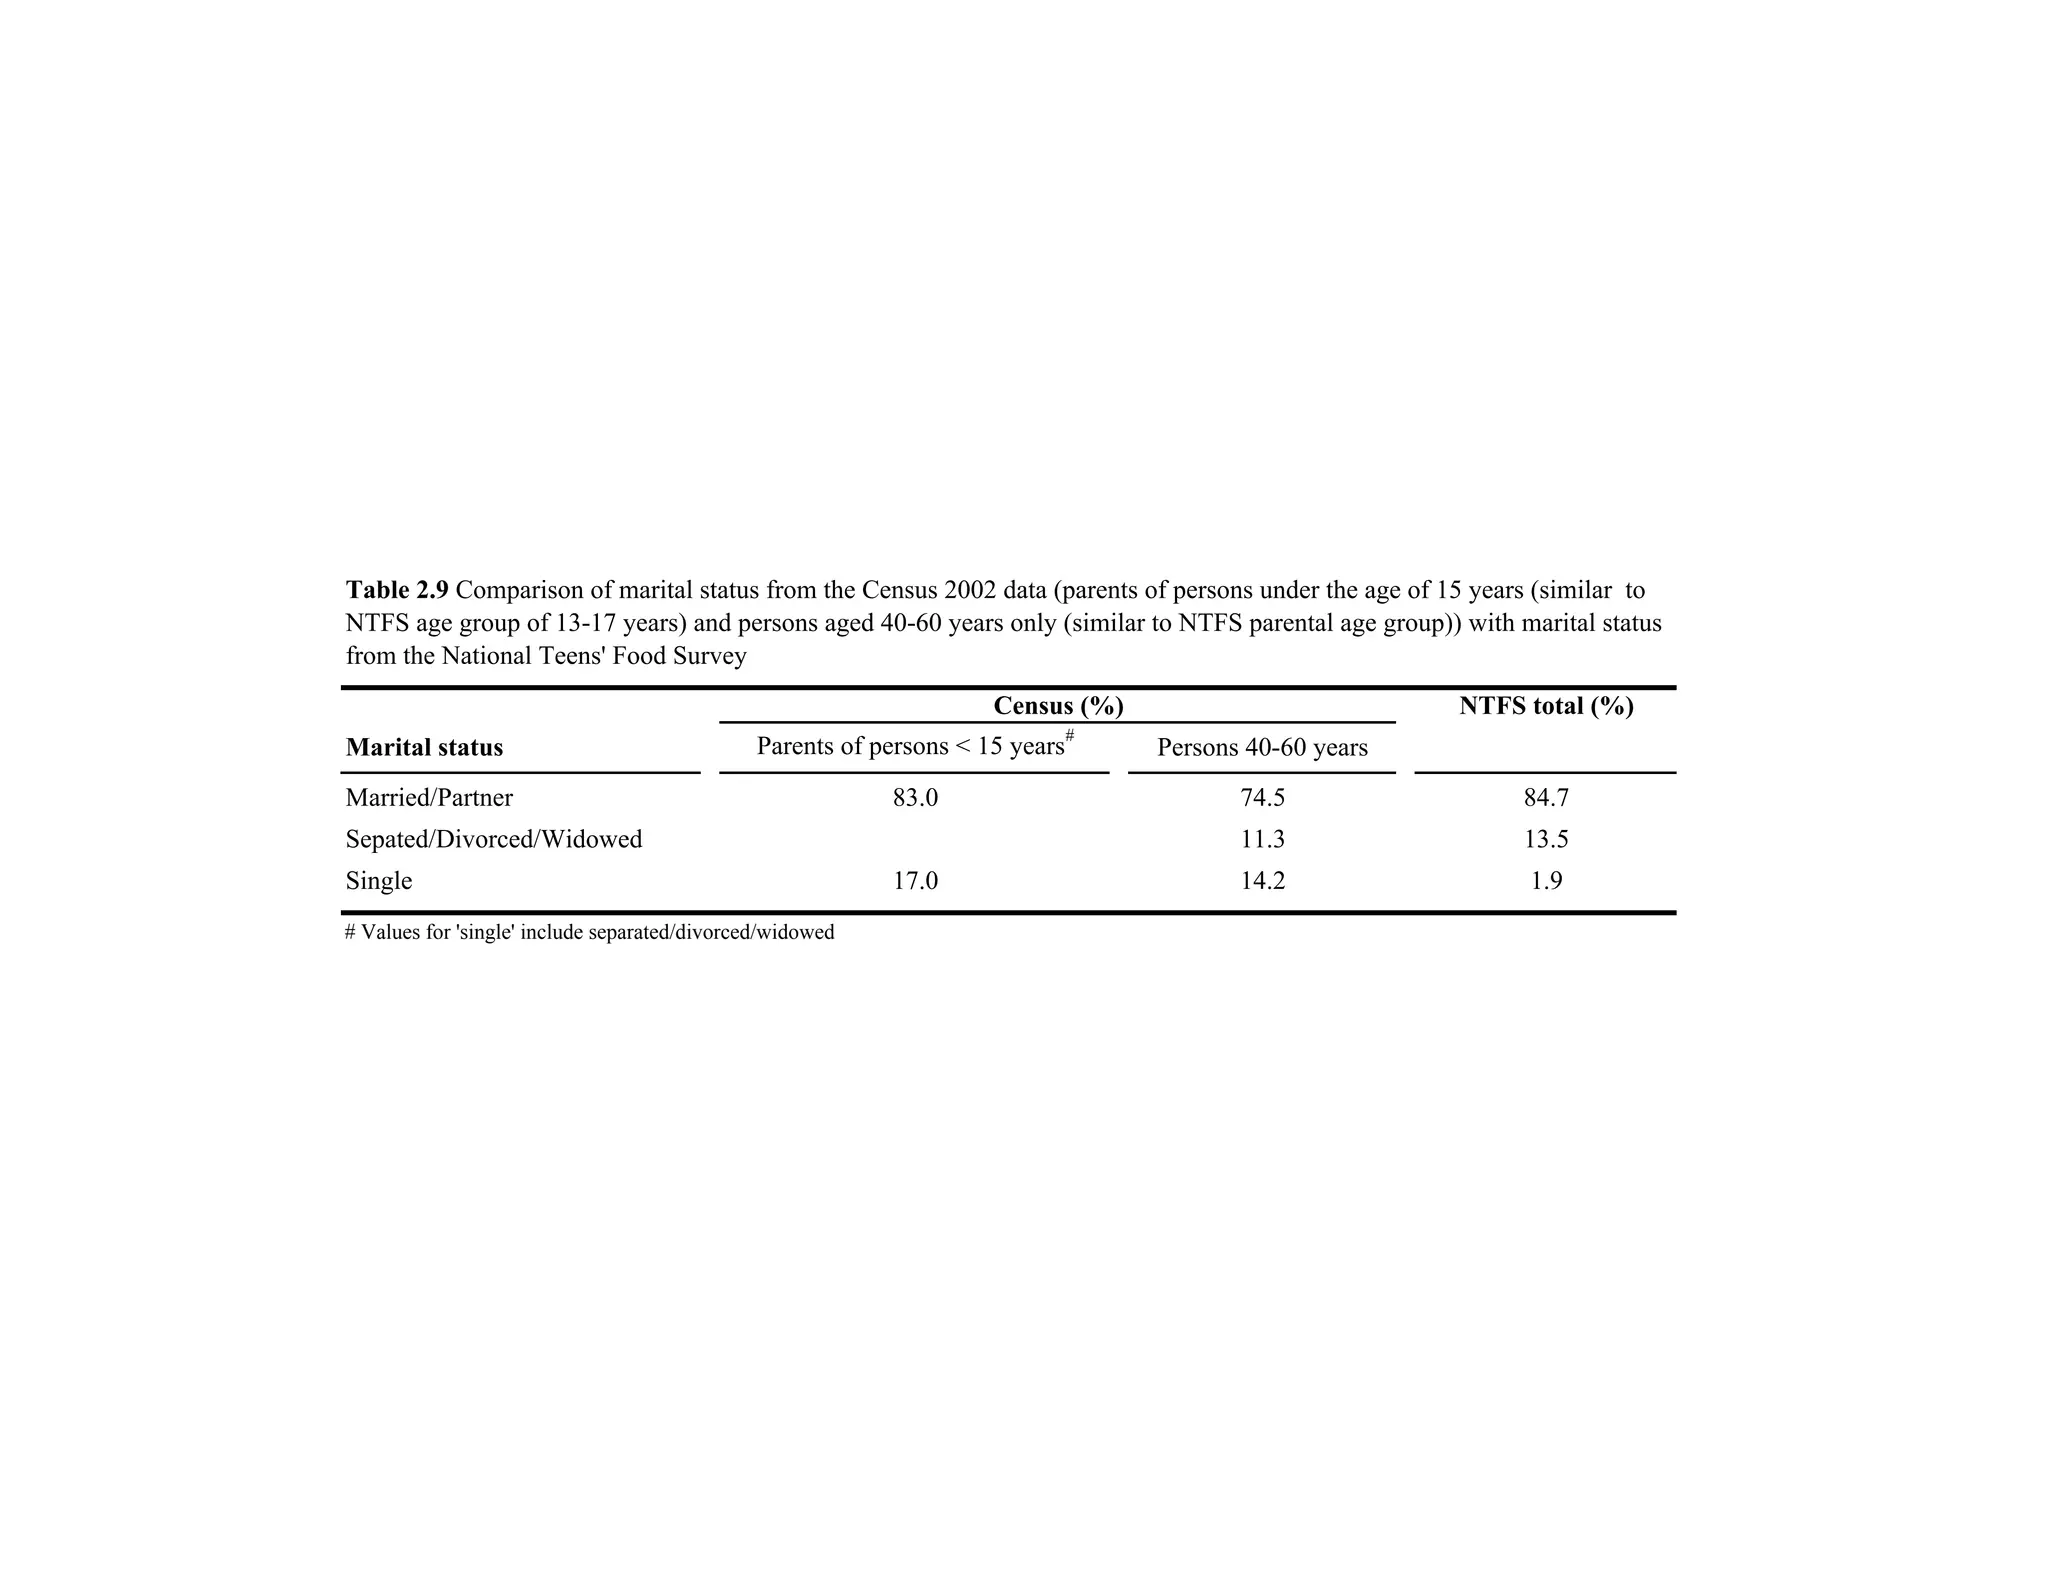
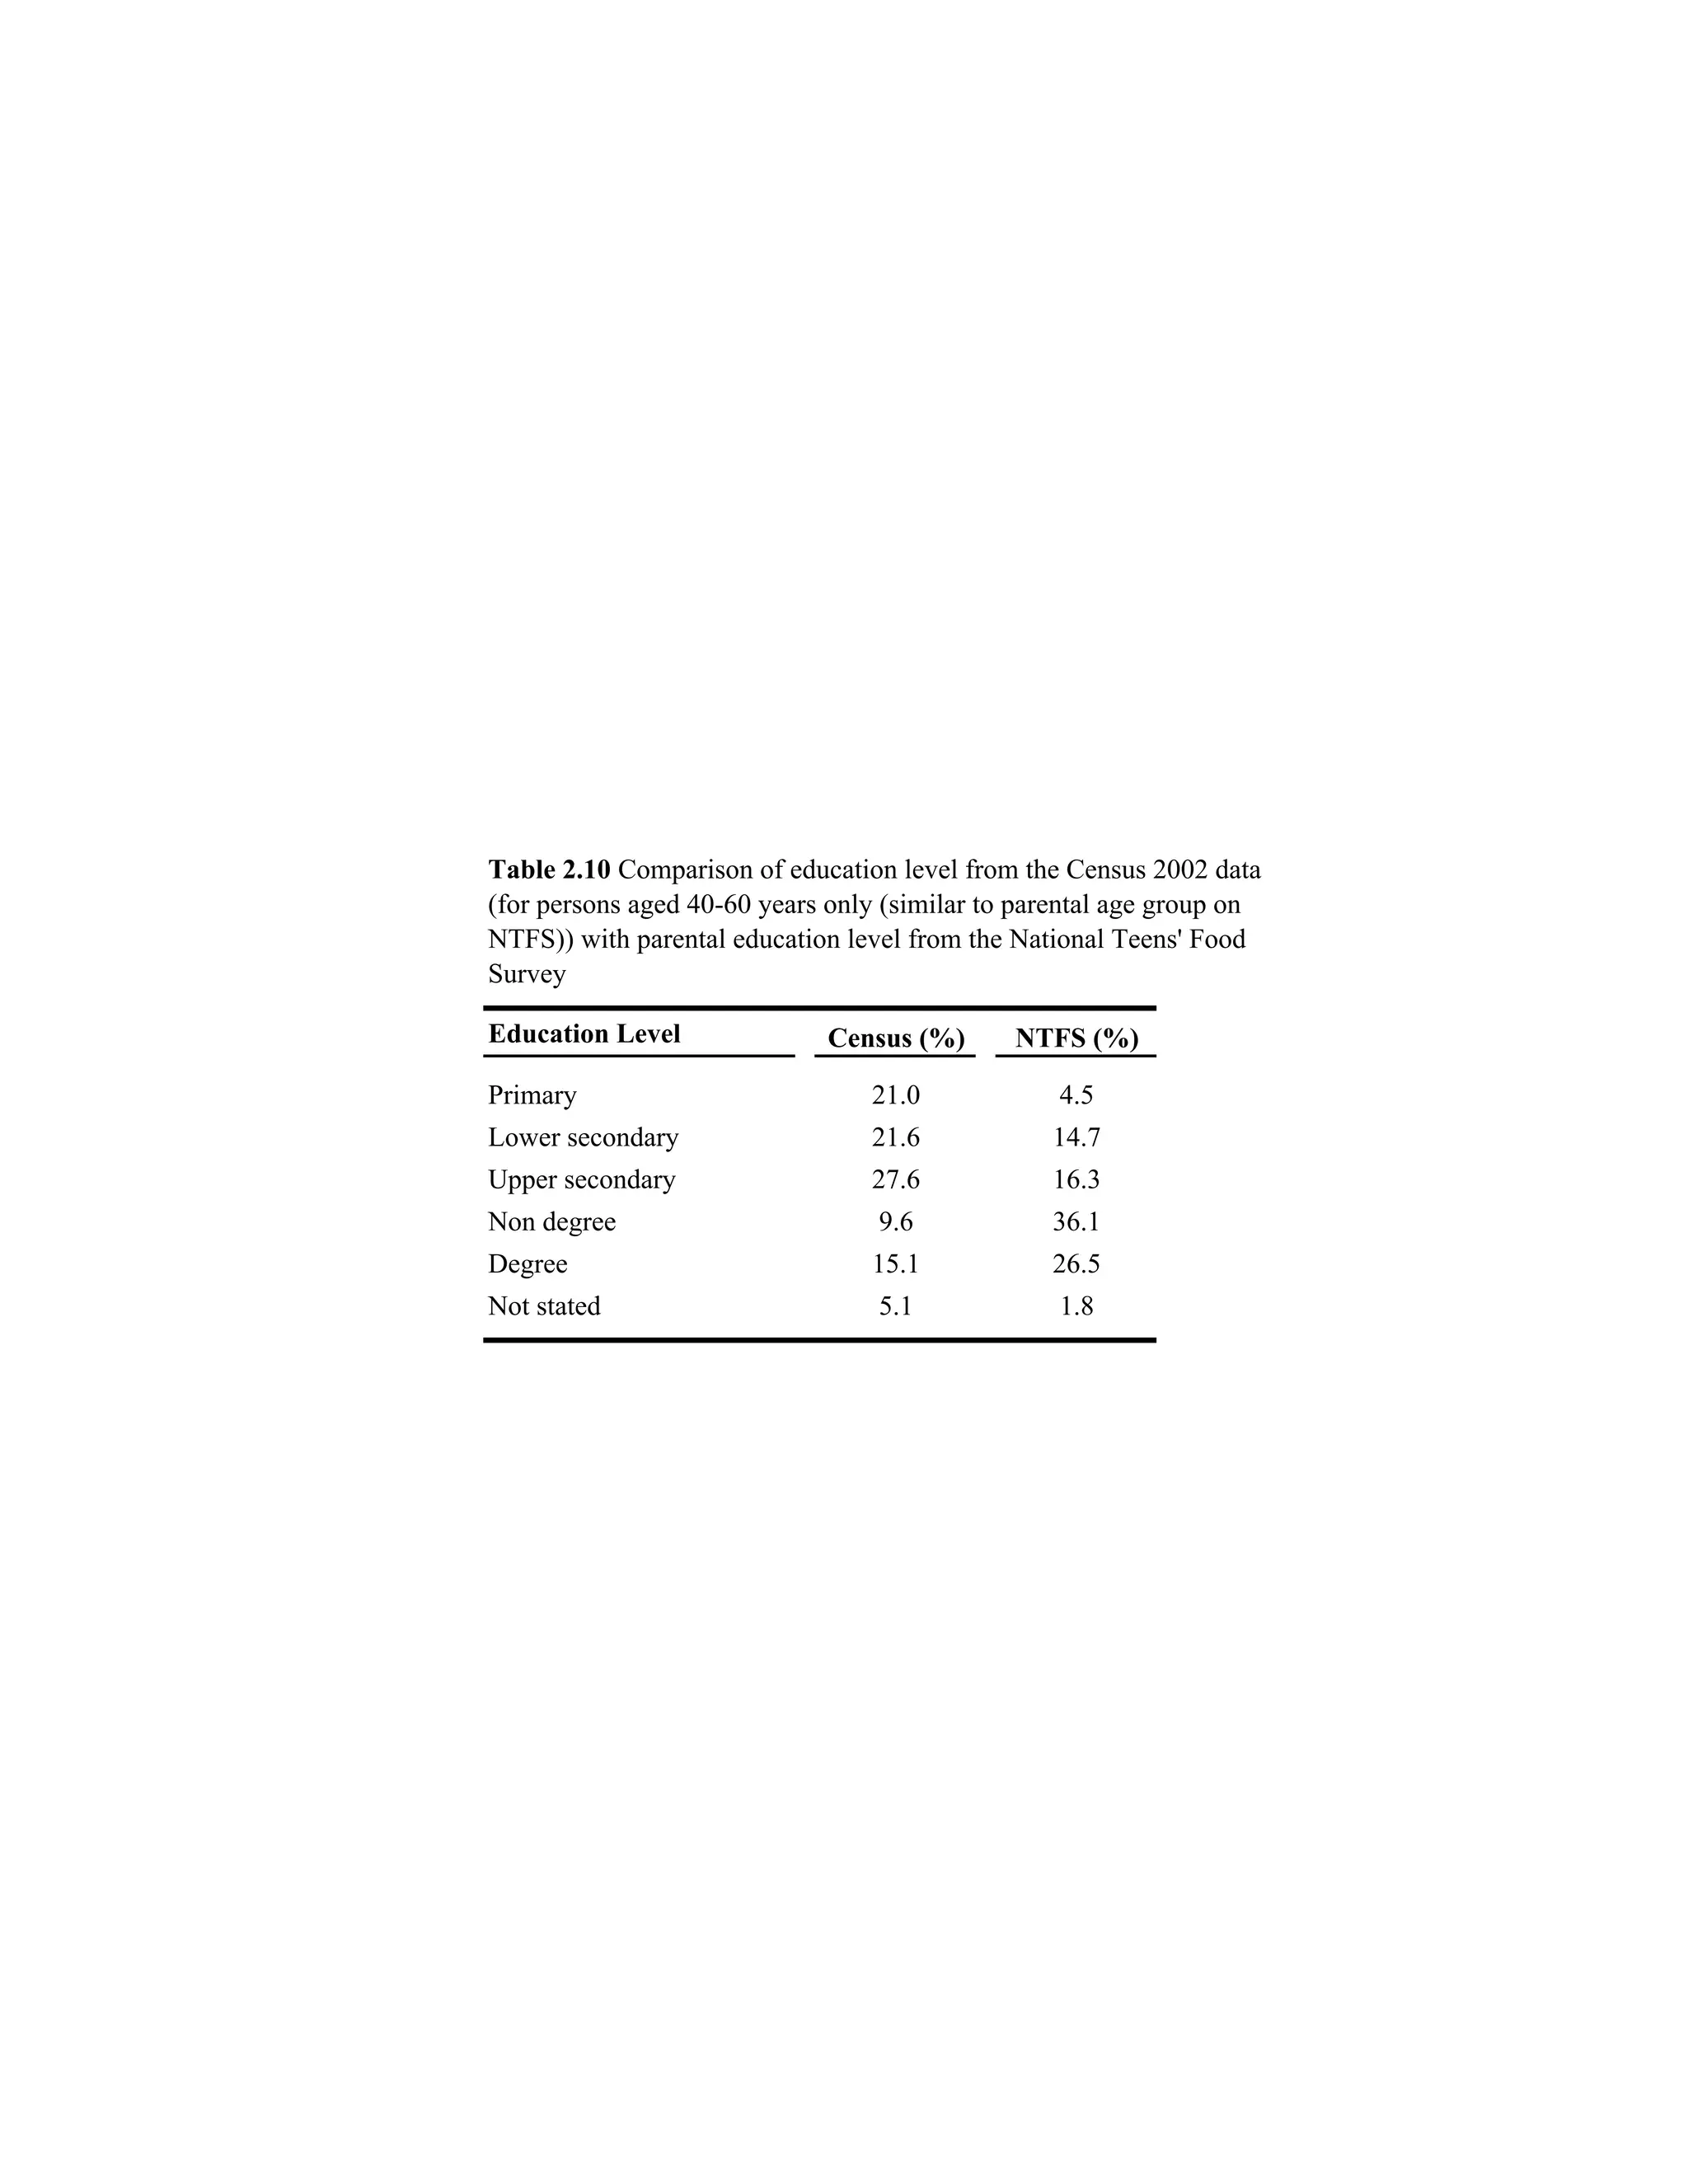
The document contains 9 tables that present demographic data from a National Teens' Food Survey (NTFS) conducted in Ireland. The tables show characteristics of survey respondents such as age, sex, geographic location, socioeconomic factors, and parents' education levels. The data is also compared to corresponding census data from Ireland to show similarities between the survey respondents and the overall Irish population.
The document contains 10 tables summarizing data from a survey of 594 Irish children ages 5-12 on topics like demographics, socioeconomic status, and family characteristics. The data is also compared to census data for Ireland. Key findings include that 49.5% of survey respondents were boys and 50.5% were girls, most children lived in open country or villages, over half had parents working as professional or non-manual workers, and the majority of parents had attained at least a secondary level of education.
This schedule outlines a competition with 4 contestants for the first two weeks in December, then 3 contestants the following week, down to 2 contestants for the final weeks in January. It lists tasks and deadlines for the contestants on most days, as well as times for judging, rankings, critiques and results to be posted or due. The competition culminates with a final task due on January 19th and the announcement of the Season 1 winner on January 30th.
This document discusses grouping discrete data and calculating statistics like the mode, mean, and frequency. It provides an example of grouping the number of goals scored in soccer matches to find the mode of 3 goals. Another example calculates the mean shoe size from a survey by tallying shoe sizes into a frequency table and dividing the total by the number of participants.
This document provides instructions and examples for using a math workbook on fractions. It explains how to work through the book step-by-step from less complex to more complex topics like addition, subtraction, multiplication and division of fractions. Examples are provided to demonstrate reducing fractions to a common denominator and performing operations on homogeneous and heterogeneous fractions. Time limits are given for each section to practice problems until they can be completed within the allotted time.
This document appears to be a tournament results sheet containing multiple games of checkers between different players. It lists the names of players, dates of matches, and game scores in a table format. Each game entry includes the moves made and results. The document compares multiple games played on February 5th 2011 as part of a Dutch championship tournament.
This document summarizes the National Teens' Food Survey conducted in Ireland which investigated the food and drink consumption, health, and lifestyle characteristics of 441 teenagers. The survey was carried out by the Irish Universities Nutrition Alliance and created an extensive electronic database on European teenagers. This database will be used by public health and food industry organizations. The survey was conducted by teams from University College Cork, Trinity College Dublin, and University College Dublin who are thanked for their funding and support.
The document presents anthropometric data on Irish teenagers aged 13-17 years old. It includes measurements of weight, height, BMI, waist circumference, and hip circumference broken down by age and sex. The data includes means, standard deviations, medians, and percentiles for each measurement. Key findings are that on average, males were heavier and taller than females, and weight and height increased with each older age group from 13-14 years to 15-17 years.
The National Children's Food Survey (NCFS) was conducted between 2003-2004 in Ireland to study food and nutrient intake in children aged 5-12 years. 594 children were selected from 28 primary schools across Ireland using stratified random sampling. Data was collected through 7-day weighed food diaries and questionnaires. Nutrient intake was analyzed using food composition databases. Anthropometric measurements and physical activity data using accelerometers was also collected. Rigorous methodology including training, multiple food diary reviews, and quality control procedures were employed to obtain accurate dietary intake data.
The document presents mean, standard deviation, median, and percentile values for food group intakes in grams per day for the total population studied and for consumers only. It shows that for most food groups, the mean intake is higher when only considering consumers. For example, the mean rice intake is 39g for the total population but 61g for consumers only. The median and percentile values also increase for many food groups when only considering consumers.
The document summarizes survey results from Irish teenagers aged 13-17 on body size satisfaction and weight control practices by BMI, sex, age, location, and socioeconomic group. It finds that overweight and obese teenagers were more likely to want to be smaller or lose weight compared to normal weight teenagers. Females were more likely than males to want to be smaller or lose weight. Older teenagers aged 15-17 were more likely to attempt weight loss than younger teenagers aged 13-14. Location and socioeconomic group had little influence on body size satisfaction and weight control practices.
- The document presents data on daily nutrient intake values for a total population of 441 individuals, including means, standard deviations, medians, and percentiles.
- The data is broken down by macronutrients, vitamins, minerals, and dietary fiber intake and includes subgroups of males and females in different age groups.
- Key statistics reported include average daily energy intake in MJ and kcals, intake of proteins, fats, carbohydrates, and various vitamins and minerals measured in grams or milligrams.
This document describes an unpaid research and communications administrator position with INKEx, an Irish nonprofit organization. The 6-month placement offers experience in marketing, communications, research, and social media for a recent graduate. Duties include implementing communications plans, stakeholder outreach, public relations, and developing promotional materials. Candidates should have strong communication skills, be able to meet deadlines, and be comfortable with web and office tools. The position is located in Dublin and eligible for welfare payments through the FAS work placement program.
The document summarizes the methodology used for the National Teens' Food Survey conducted in Ireland between 2005-2006. It describes the sampling and selection of schools, recruitment of respondents, data collection methods including food diaries and questionnaires, anthropometric measurements, data analysis, and validation procedures. Over 400 teenagers were selected from 32 secondary schools across Ireland to collect detailed information on food and beverage intake and lifestyle factors over a 7-day period.
This document provides a table of contents for a report on a National Teens' Food Survey. The table of contents lists 6 chapters, with the first chapter providing background information and methodology. Chapter 2 discusses sampling and census data comparing survey respondents to census data. Chapter 3 presents food consumption data and Chapters 4 provides information on nutrient intakes. Chapter 5 presents anthropometric data on survey participants and Chapter 6 discusses body size satisfaction and weight control practices. Each chapter includes numerous tables displaying results.
The document reports results from a study on dietary intake in the UK. It includes 6 tables presenting mean, standard deviation, median and percentile values for daily intake of energy, macronutrients, vitamins, minerals and food groups for the total population and broken down by age and sex. The tables provide statistical data on nutritional intake and allow comparisons between demographic groups.
This document summarizes the methods and key findings of the National Teen Food Consumption Survey conducted in Ireland. The survey investigated food/beverage consumption, physical activity, health characteristics, and food choice factors of 441 Irish teens aged 13-17. Data was collected through 7-day food records, questionnaires, and anthropometric measurements. The survey aimed to establish a database on teen diets and lifestyles and investigate food/nutrient intakes, weight status, physical activity and sociodemographic characteristics. The database allows analysis of nutrient intakes, exposure to food chemicals, and supports product development and policymaking.
This document provides an introduction and background to the North/South Ireland Food Consumption Survey. The survey investigated food consumption, lifestyle factors, and health indicators in a representative sample of 1,379 adults aged 18-64 in Ireland. Comprehensive food consumption data was collected to inform public health policy and the food industry. Previous dietary surveys in Ireland were outdated, so this new database will be a valuable resource for analyzing issues related to food safety and nutrition. The survey also collected additional data on physical activity, anthropometrics, and attitudes to provide context for interpreting dietary intakes and their relationship to health.
This document summarizes the findings of the North/South Ireland Food Consumption Survey conducted by the Irish Universities Nutrition Alliance. The survey examined the food and beverage consumption, lifestyle habits, health indicators and attitudes of 1,379 adults aged 18-64 in Ireland. Key findings include:
- The most commonly consumed foods were potatoes, bread, dairy products and tea. Meat, bread, potatoes, dairy and biscuits/cakes provided nearly 60% of energy intake.
- Alcohol consumption was common, though many consumed above recommended maximums.
- Nutrient intakes were generally adequate, though many had low fiber, calcium and iron intake.
- Obesity levels increased significantly since 1990,
The document presents data on the number and location of eating occasions for Irish children aged 5-12. It finds that on average, children ate at home 29-30 times per week. They occasionally ate at other homes, with boys eating elsewhere more than girls. Outside of home, takeaways were the most common location for eating. The number of eating occasions varied slightly based on age, gender, parental education and social class.
The document contains 18 tables presenting nutrient intake data from a national survey, including means, standard deviations, medians and percentiles for calcium, magnesium, phosphorus, iron, copper, zinc by sex and age group. Intakes are shown from all sources and from food only, by location and parents' education. Intakes of all nutrients were typically higher in boys than girls and older children within each sex. Intakes varied some by location and parents' education level.
This document provides a table of contents for a report on the National Children's Food Survey. It outlines 6 chapters that will analyze data on food consumption, nutrient intake, anthropometric measurements, and eating occasions among Irish children ages 5-12. Each chapter includes numerous tables presenting statistics on variables like food and nutrient intake by age, sex, geography, and socioeconomic status. The document provides an overview of the extensive data and analyses that will be presented in the report.
The document summarizes the National Children's Food Survey conducted in Ireland. The survey investigated food consumption, health, and lifestyle factors of 594 Irish children ages 5-12. It compiled a comprehensive electronic database on the children's habits. This database will be used by public health and food industry organizations. The survey was conducted by researchers from Trinity College Dublin and University College Cork with funding provided by the Irish government and several food companies.
The document presents mean, standard deviation, median and percentile values for food group intakes in grams per day for the total population and consumers only. For the total population, intake amounts vary widely between food groups with whole milk having the highest mean intake of 238g and creams having the lowest mean intake of 0g. When looking at consumers only, mean intakes are higher for all food groups compared to the total population as non-consumers are excluded from the calculations.
The document presents mean, standard deviation, median and percentile values for daily intake of energy, macronutrients, vitamins and minerals for a total population of 594 people. It also breaks this data down by gender and age groups for boys and girls aged 5-12 years old. The data shows the average daily nutrient intake values and the variation within the populations.
The document presents anthropometric data on weight, height, BMI, waist, and hip measurements for Irish children aged 5-12 years. It includes mean, standard deviation, median, and percentile values for the overall cohort and broken down by age and sex. The data is also analyzed according to location, education level, social class, and socio-economic group. Overall, the study provides detailed anthropometric statistics on physical measurements of Irish youth populations across multiple demographic factors.
The document discusses eLearning in higher education and training. It provides examples of different forms of eLearning like learning management systems, Moodle, browser-based training, Open University, and distance learning. It also discusses the positives of eLearning in increasing access and student engagement, and the challenges of eLearning like student and instructor skills, technical issues, and managing student motivation in distance learning.
Level 3 NCEA - NZ: A Nation In the Making 1872 - 1900 SML.pptHenry Hollis
The History of NZ 1870-1900.
Making of a Nation.
From the NZ Wars to Liberals,
Richard Seddon, George Grey,
Social Laboratory, New Zealand,
Confiscations, Kotahitanga, Kingitanga, Parliament, Suffrage, Repudiation, Economic Change, Agriculture, Gold Mining, Timber, Flax, Sheep, Dairying,
Gender and Mental Health - Counselling and Family Therapy Applications and In...PsychoTech Services
A proprietary approach developed by bringing together the best of learning theories from Psychology, design principles from the world of visualization, and pedagogical methods from over a decade of training experience, that enables you to: Learn better, faster!
How Barcodes Can Be Leveraged Within Odoo 17Celine George
In this presentation, we will explore how barcodes can be leveraged within Odoo 17 to streamline our manufacturing processes. We will cover the configuration steps, how to utilize barcodes in different manufacturing scenarios, and the overall benefits of implementing this technology.
THE SACRIFICE HOW PRO-PALESTINE PROTESTS STUDENTS ARE SACRIFICING TO CHANGE T...indexPub
The recent surge in pro-Palestine student activism has prompted significant responses from universities, ranging from negotiations and divestment commitments to increased transparency about investments in companies supporting the war on Gaza. This activism has led to the cessation of student encampments but also highlighted the substantial sacrifices made by students, including academic disruptions and personal risks. The primary drivers of these protests are poor university administration, lack of transparency, and inadequate communication between officials and students. This study examines the profound emotional, psychological, and professional impacts on students engaged in pro-Palestine protests, focusing on Generation Z's (Gen-Z) activism dynamics. This paper explores the significant sacrifices made by these students and even the professors supporting the pro-Palestine movement, with a focus on recent global movements. Through an in-depth analysis of printed and electronic media, the study examines the impacts of these sacrifices on the academic and personal lives of those involved. The paper highlights examples from various universities, demonstrating student activism's long-term and short-term effects, including disciplinary actions, social backlash, and career implications. The researchers also explore the broader implications of student sacrifices. The findings reveal that these sacrifices are driven by a profound commitment to justice and human rights, and are influenced by the increasing availability of information, peer interactions, and personal convictions. The study also discusses the broader implications of this activism, comparing it to historical precedents and assessing its potential to influence policy and public opinion. The emotional and psychological toll on student activists is significant, but their sense of purpose and community support mitigates some of these challenges. However, the researchers call for acknowledging the broader Impact of these sacrifices on the future global movement of FreePalestine.
Philippine Edukasyong Pantahanan at Pangkabuhayan (EPP) CurriculumMJDuyan
(𝐓𝐋𝐄 𝟏𝟎𝟎) (𝐋𝐞𝐬𝐬𝐨𝐧 𝟏)-𝐏𝐫𝐞𝐥𝐢𝐦𝐬
𝐃𝐢𝐬𝐜𝐮𝐬𝐬 𝐭𝐡𝐞 𝐄𝐏𝐏 𝐂𝐮𝐫𝐫𝐢𝐜𝐮𝐥𝐮𝐦 𝐢𝐧 𝐭𝐡𝐞 𝐏𝐡𝐢𝐥𝐢𝐩𝐩𝐢𝐧𝐞𝐬:
- Understand the goals and objectives of the Edukasyong Pantahanan at Pangkabuhayan (EPP) curriculum, recognizing its importance in fostering practical life skills and values among students. Students will also be able to identify the key components and subjects covered, such as agriculture, home economics, industrial arts, and information and communication technology.
𝐄𝐱𝐩𝐥𝐚𝐢𝐧 𝐭𝐡𝐞 𝐍𝐚𝐭𝐮𝐫𝐞 𝐚𝐧𝐝 𝐒𝐜𝐨𝐩𝐞 𝐨𝐟 𝐚𝐧 𝐄𝐧𝐭𝐫𝐞𝐩𝐫𝐞𝐧𝐞𝐮𝐫:
-Define entrepreneurship, distinguishing it from general business activities by emphasizing its focus on innovation, risk-taking, and value creation. Students will describe the characteristics and traits of successful entrepreneurs, including their roles and responsibilities, and discuss the broader economic and social impacts of entrepreneurial activities on both local and global scales.
This document provides an overview of wound healing, its functions, stages, mechanisms, factors affecting it, and complications.
A wound is a break in the integrity of the skin or tissues, which may be associated with disruption of the structure and function.
Healing is the body’s response to injury in an attempt to restore normal structure and functions.
Healing can occur in two ways: Regeneration and Repair
There are 4 phases of wound healing: hemostasis, inflammation, proliferation, and remodeling. This document also describes the mechanism of wound healing. Factors that affect healing include infection, uncontrolled diabetes, poor nutrition, age, anemia, the presence of foreign bodies, etc.
Complications of wound healing like infection, hyperpigmentation of scar, contractures, and keloid formation.
This presentation was provided by Rebecca Benner, Ph.D., of the American Society of Anesthesiologists, for the second session of NISO's 2024 Training Series "DEIA in the Scholarly Landscape." Session Two: 'Expanding Pathways to Publishing Careers,' was held June 13, 2024.
🔥🔥🔥🔥🔥🔥🔥🔥🔥
إضغ بين إيديكم من أقوى الملازم التي صممتها
ملزمة تشريح الجهاز الهيكلي (نظري 3)
💀💀💀💀💀💀💀💀💀💀
تتميز هذهِ الملزمة بعِدة مُميزات :
1- مُترجمة ترجمة تُناسب جميع المستويات
2- تحتوي على 78 رسم توضيحي لكل كلمة موجودة بالملزمة (لكل كلمة !!!!)
#فهم_ماكو_درخ
3- دقة الكتابة والصور عالية جداً جداً جداً
4- هُنالك بعض المعلومات تم توضيحها بشكل تفصيلي جداً (تُعتبر لدى الطالب أو الطالبة بإنها معلومات مُبهمة ومع ذلك تم توضيح هذهِ المعلومات المُبهمة بشكل تفصيلي جداً
5- الملزمة تشرح نفسها ب نفسها بس تكلك تعال اقراني
6- تحتوي الملزمة في اول سلايد على خارطة تتضمن جميع تفرُعات معلومات الجهاز الهيكلي المذكورة في هذهِ الملزمة
واخيراً هذهِ الملزمة حلالٌ عليكم وإتمنى منكم إن تدعولي بالخير والصحة والعافية فقط
كل التوفيق زملائي وزميلاتي ، زميلكم محمد الذهبي 💊💊
🔥🔥🔥🔥🔥🔥🔥🔥🔥
1. Table 2.1 Number (%) of respondents in the survey by sex and age
group
All 13-14y 15-17y
(n= 441) (n=188) (n=253)
Males 224 95 (42) 129 (58)
Females 217 93 (43) 124 (57)
Table 2.2 Number (%) of respondents in the survey during winter (Sept-
Feb) and summer (Mar-Aug) by sex
Males Females
(n=224) (n=217)
Season
Winter 80 (36) 107 (49)
Summer 144 (64) 110 (51)
Table 2.3 Number (%) of respondents by geographical location, sex and
age group
All 13-14y 15-17y
Males (n=224) (n=95) (n=129)
Open country/village 66 (30) 29 (30.5) 37 (28.7)
Small town 47 (21) 28 (29.5) 19 (14.7)
Large town 34 (15) 10 (10.5) 24 (18.6)
City 77 (34) 28 (29.5) 49 (38)
Females (n=217) (n=93) (n=124)
Open country/village 71 (33) 27 (29) 44 (35.5)
Small town 33 (15) 13 (14) 20 (16)
Large town 28 (13) 12 (13) 16 (13)
City 85 (39) 41 (44) 44 (35.5)
2. Table 2.4 Number (%) of respondents by social class and sex
Males Females
(n=219) (n=212)
Social Class
Professional Workers 115 (53) 101 (48)
Non-Manual Workers 41 (19) 38 (18)
Skilled Manual Workers 38 (17) 47 (22)
Unskilled Workers 25 (11) 26 (12)
Excludes 10 missing values
Table 2.5 Number (%) of respondents by socio-economic group
and sex
Males Females
(n=219) (n=212)
Socio-Economic Group
Employers and Managers 50 (23) 32 (15)
Higher professional 18 (8) 15 (7)
Lower professional 40 (18) 42 (20)
Non-manual 31 (14) 36 (17)
Manual Skilled 6 (3) 14 (7)
Semi-skilled 14 (6) 13 (6)
Unskilled 1 (1) 5 (2)
Own account workers 50 (23) 45 (21)
Farmers 9 (4) 10 (5)
Excludes 10 missing values
3. Table 2.6 Number (%) of respondents by parents' education level and
sex and age group of respondent
All 13-14y 15-17y
Males (n=220) (n=94) (n=126)
Intermediate 38 (17) 15 (16) 23 (18)
Secondary 83 (38) 39 (41) 44 (35)
Tertiary 99 (45) 40 (43) 59 (47)
Females (n=213) (n=91) (n=122)
Intermediate 47 (22) 17 (19) 30 (25)
Secondary 86 (40) 43 (47) 43 (35)
Tertiary 80 (38) 31 (34) 49 (40)
Excludes 8 missing values
4. Table 2.7 Percentage of males and females from the NTFS for each year age compared with the census 2002 data
Census 2002 (%) NTFS (%)
Age (years) All 13-17 Males Females All 13-17 Males Females
13 18.8 9.6 9.2 20.9 10.4 10.4
14 19.7 10.0 9.7 21.8 11.1 10.7
15 20.2 10.4 9.8 19.7 9.5 10.2
16 20.4 10.4 10.0 19.9 10.2 9.8
17 20.9 10.8 10.1 17.7 9.5 8.2
13-17 years 100 51.2 48.8 100 50.7 49.3
5. Table 2.8 Comparison of socio demographics from the Census 2002
data for the total population with data from the National Teens' Food Survey
Census (%) NTFS (%)
Geographical Location
Open country 33 31
Village (200-1,499) 7 8
Town (1,500-2,999) 3 2
Town (3,000-4,999) 3 1
Town (5,000-9,999) 6 7
Town (>10,000) 13 14
City (Cork, Dublin) 36 37
Socio-economic group
Employers and managers 19 19
Higher professional 6 8
Lower professional 12 19
Non-manual 20 16
Manual skilled 12 5
Semi-skilled 10 6
Unskilled 6 1
Own account workers 6 22
Farmers 7 4
Agricultural workers 1 0
Social class
Professional workers 7 7
Managerial and technical 32 43
Non-manual 20 18
Skilled manual 21 20
Semi-skilled 13 10
Unskilled 7 2
6. Table 2.9 Comparison of marital status from the Census 2002 data (parents of persons under the age of 15 years (similar to
NTFS age group of 13-17 years) and persons aged 40-60 years only (similar to NTFS parental age group)) with marital status
from the National Teens' Food Survey
Census (%) NTFS total (%)
Marital status Parents of persons < 15 years# Persons 40-60 years
Married/Partner 83.0 74.5 84.7
Sepated/Divorced/Widowed 11.3 13.5
Single 17.0 14.2 1.9
# Values for 'single' include separated/divorced/widowed
7. Table 2.10 Comparison of education level from the Census 2002 data
(for persons aged 40-60 years only (similar to parental age group on
NTFS)) with parental education level from the National Teens' Food
Survey
Education Level Census (%) NTFS (%)
Primary 21.0 4.5
Lower secondary 21.6 14.7
Upper secondary 27.6 16.3
Non degree 9.6 36.1
Degree 15.1 26.5
Not stated 5.1 1.8