Download to read offline

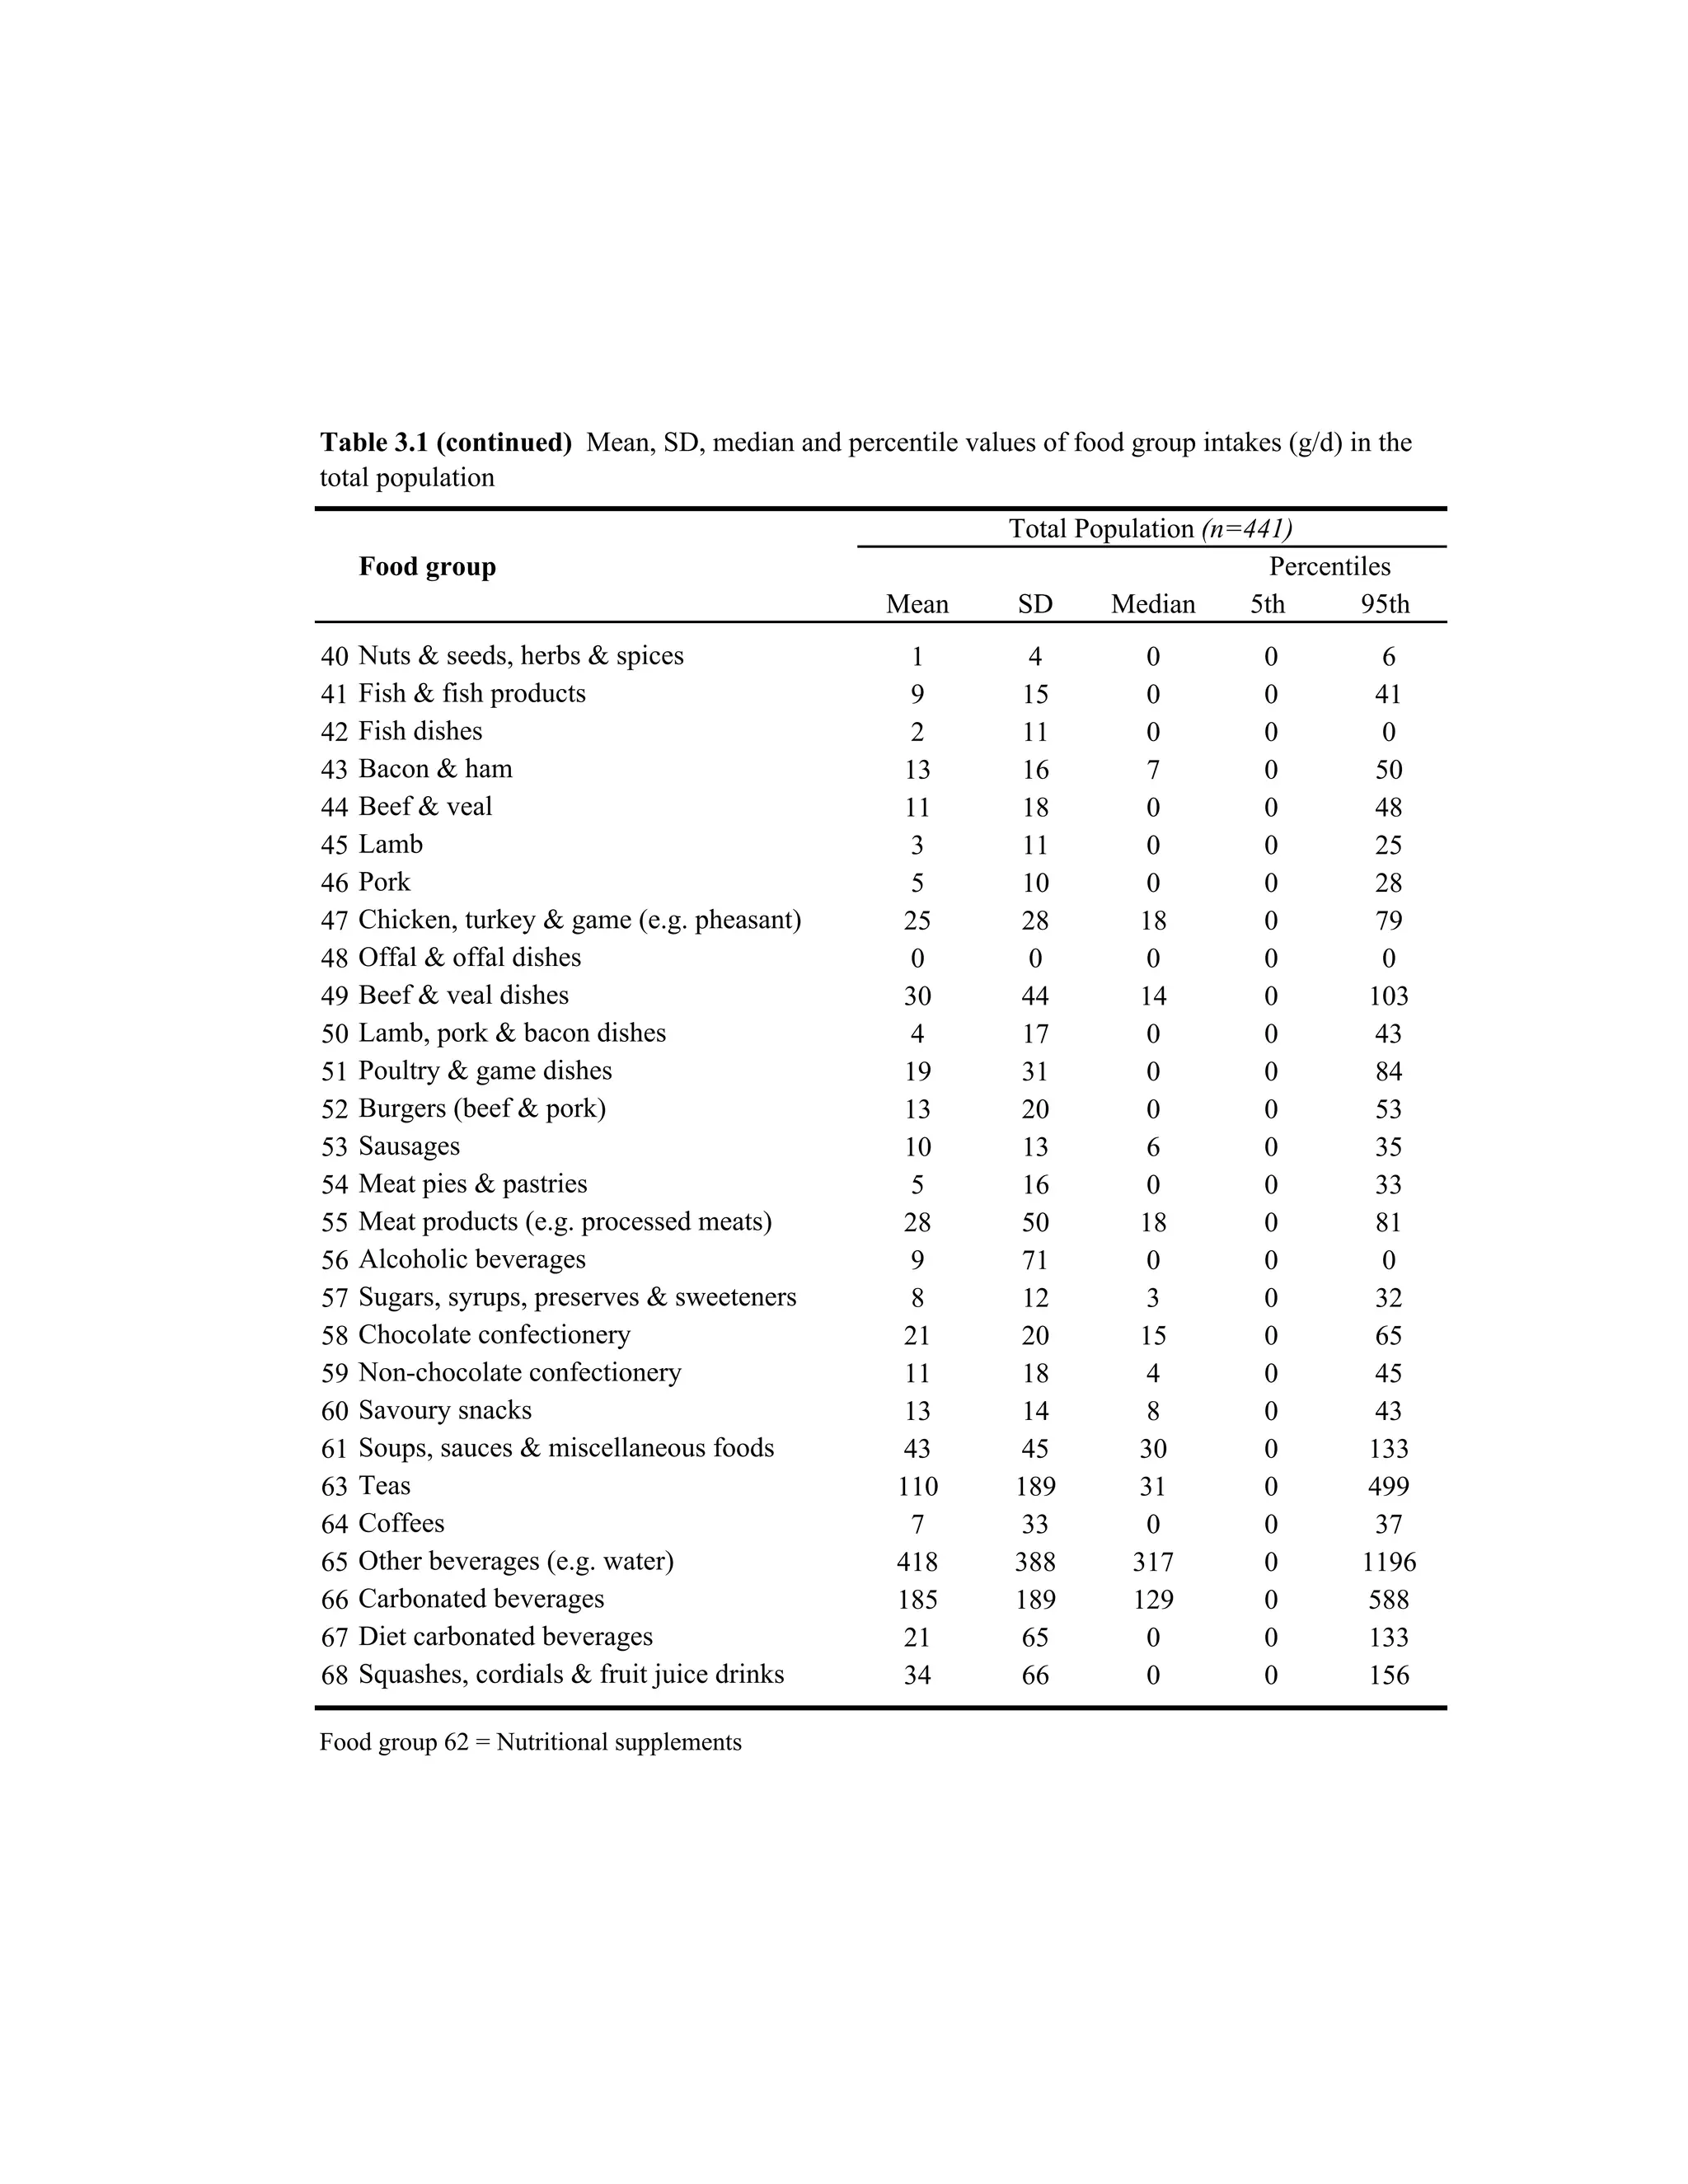
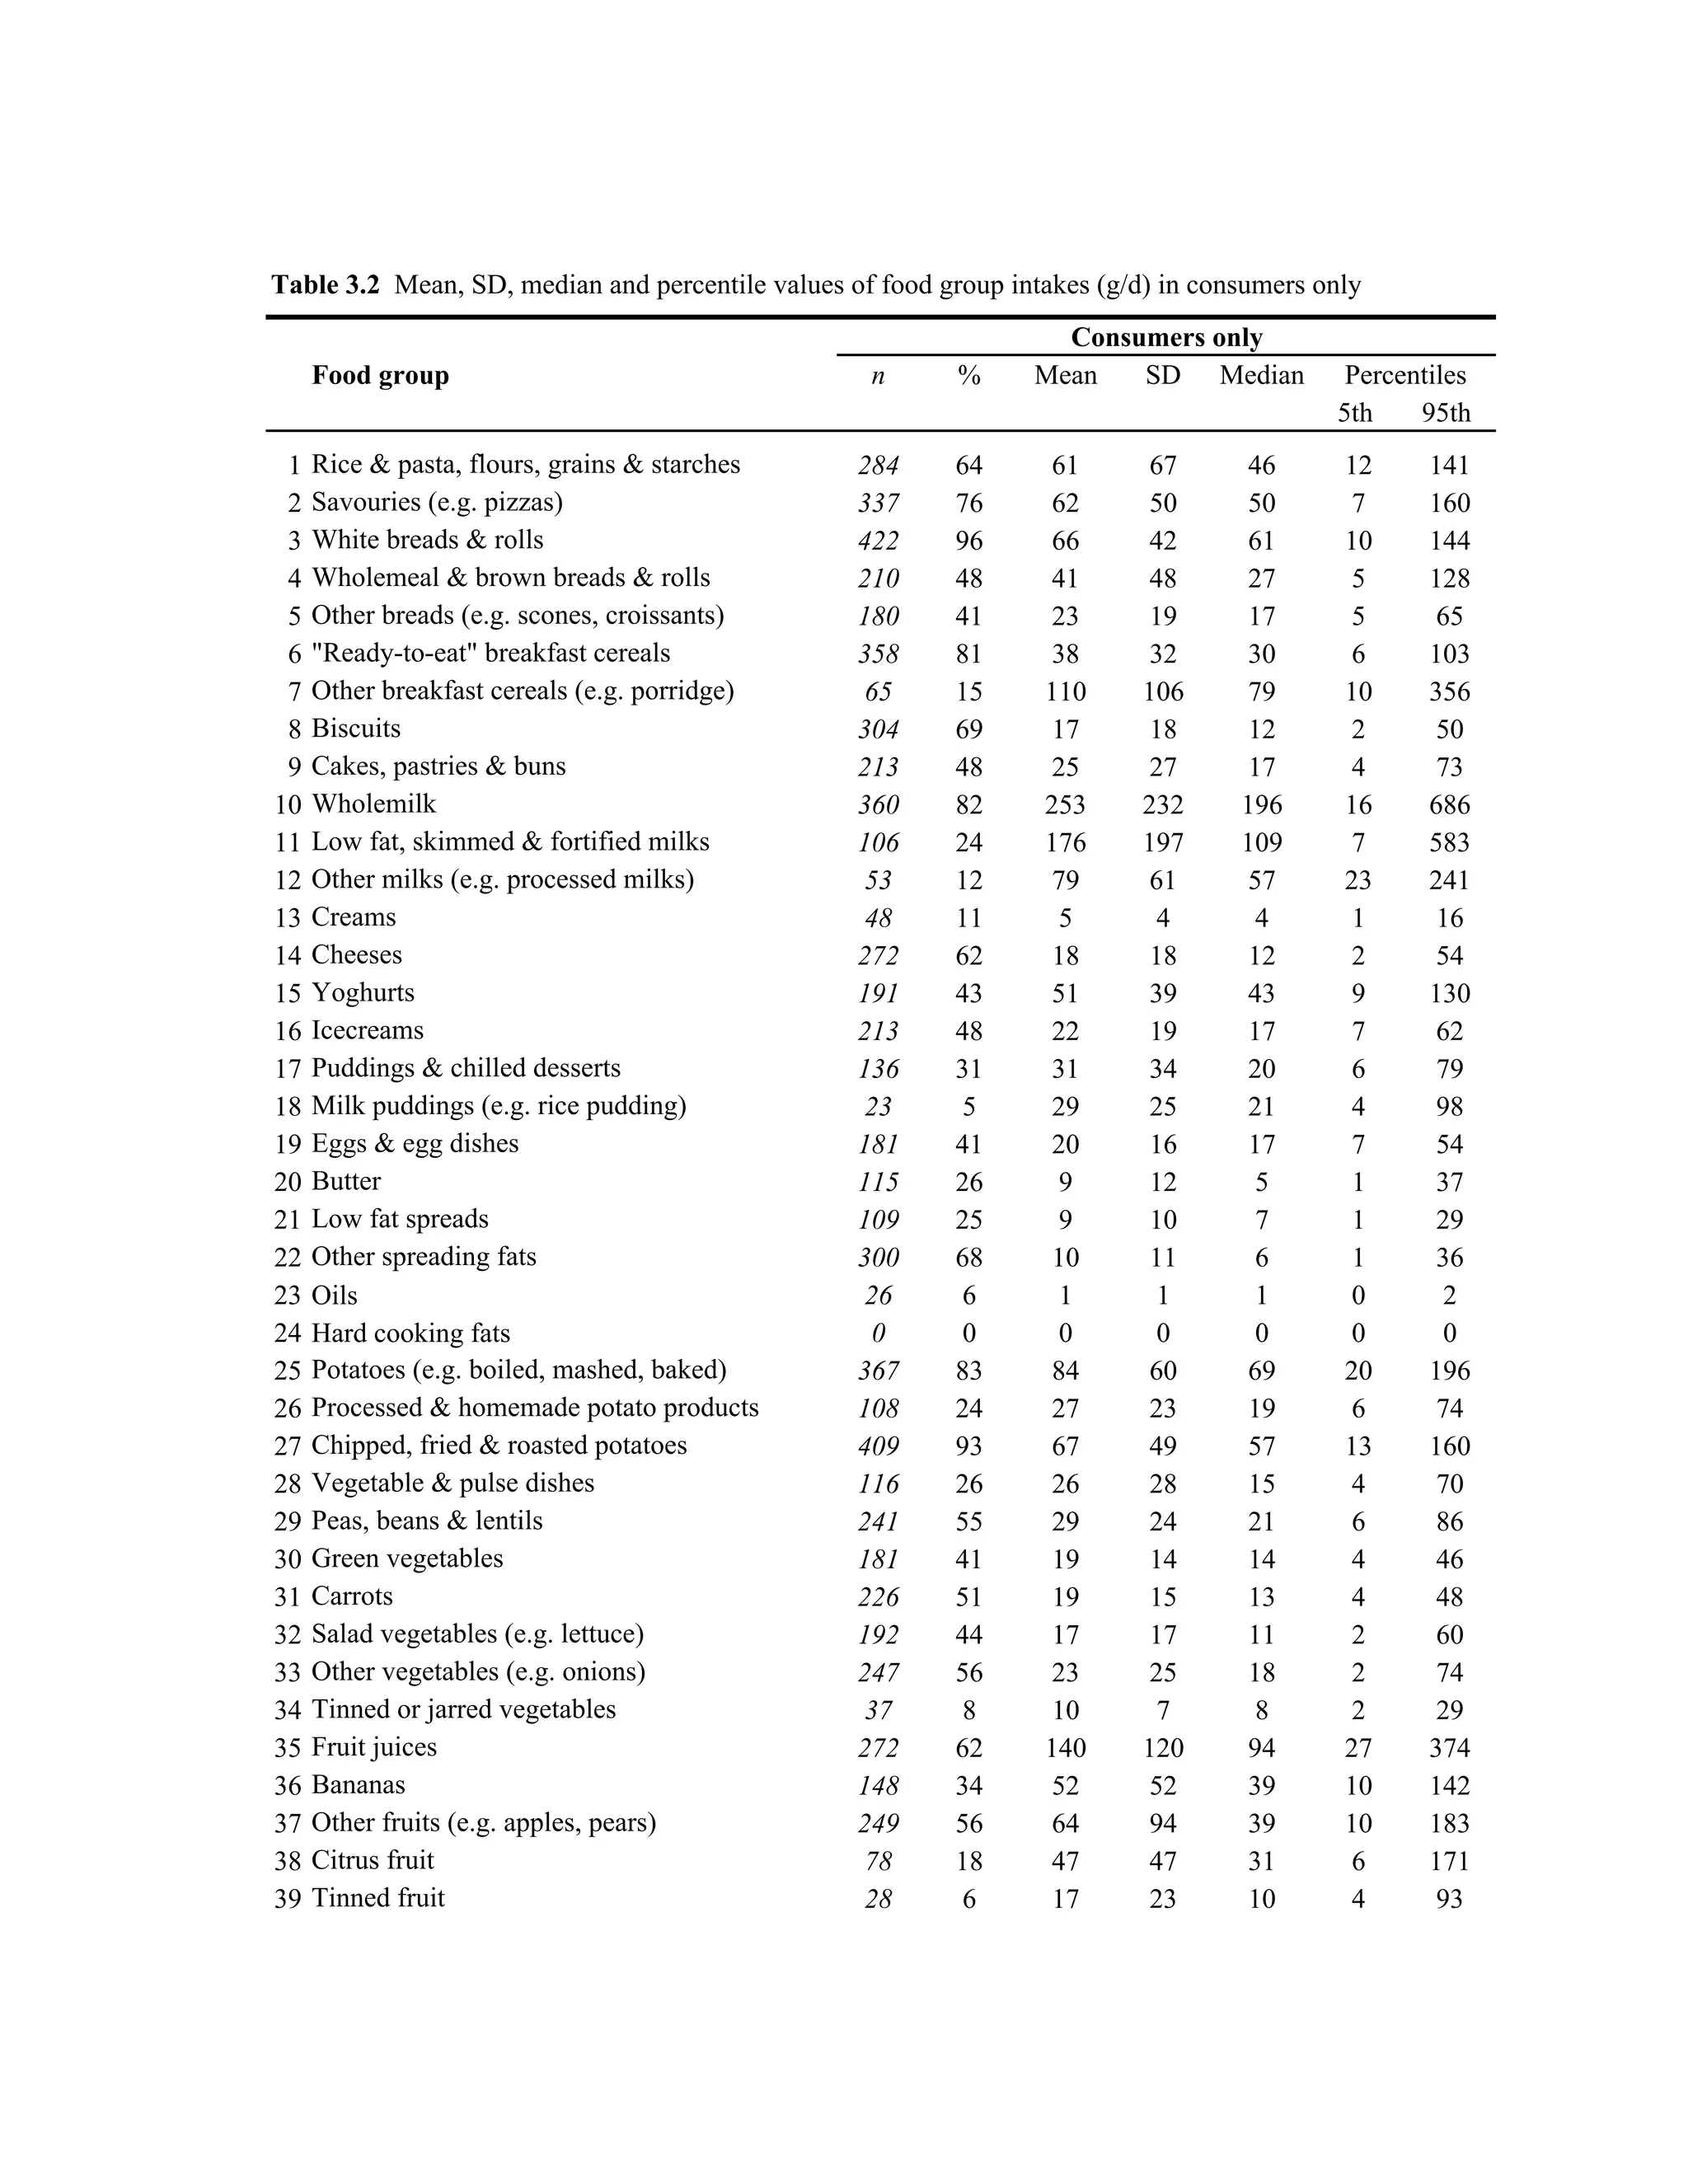
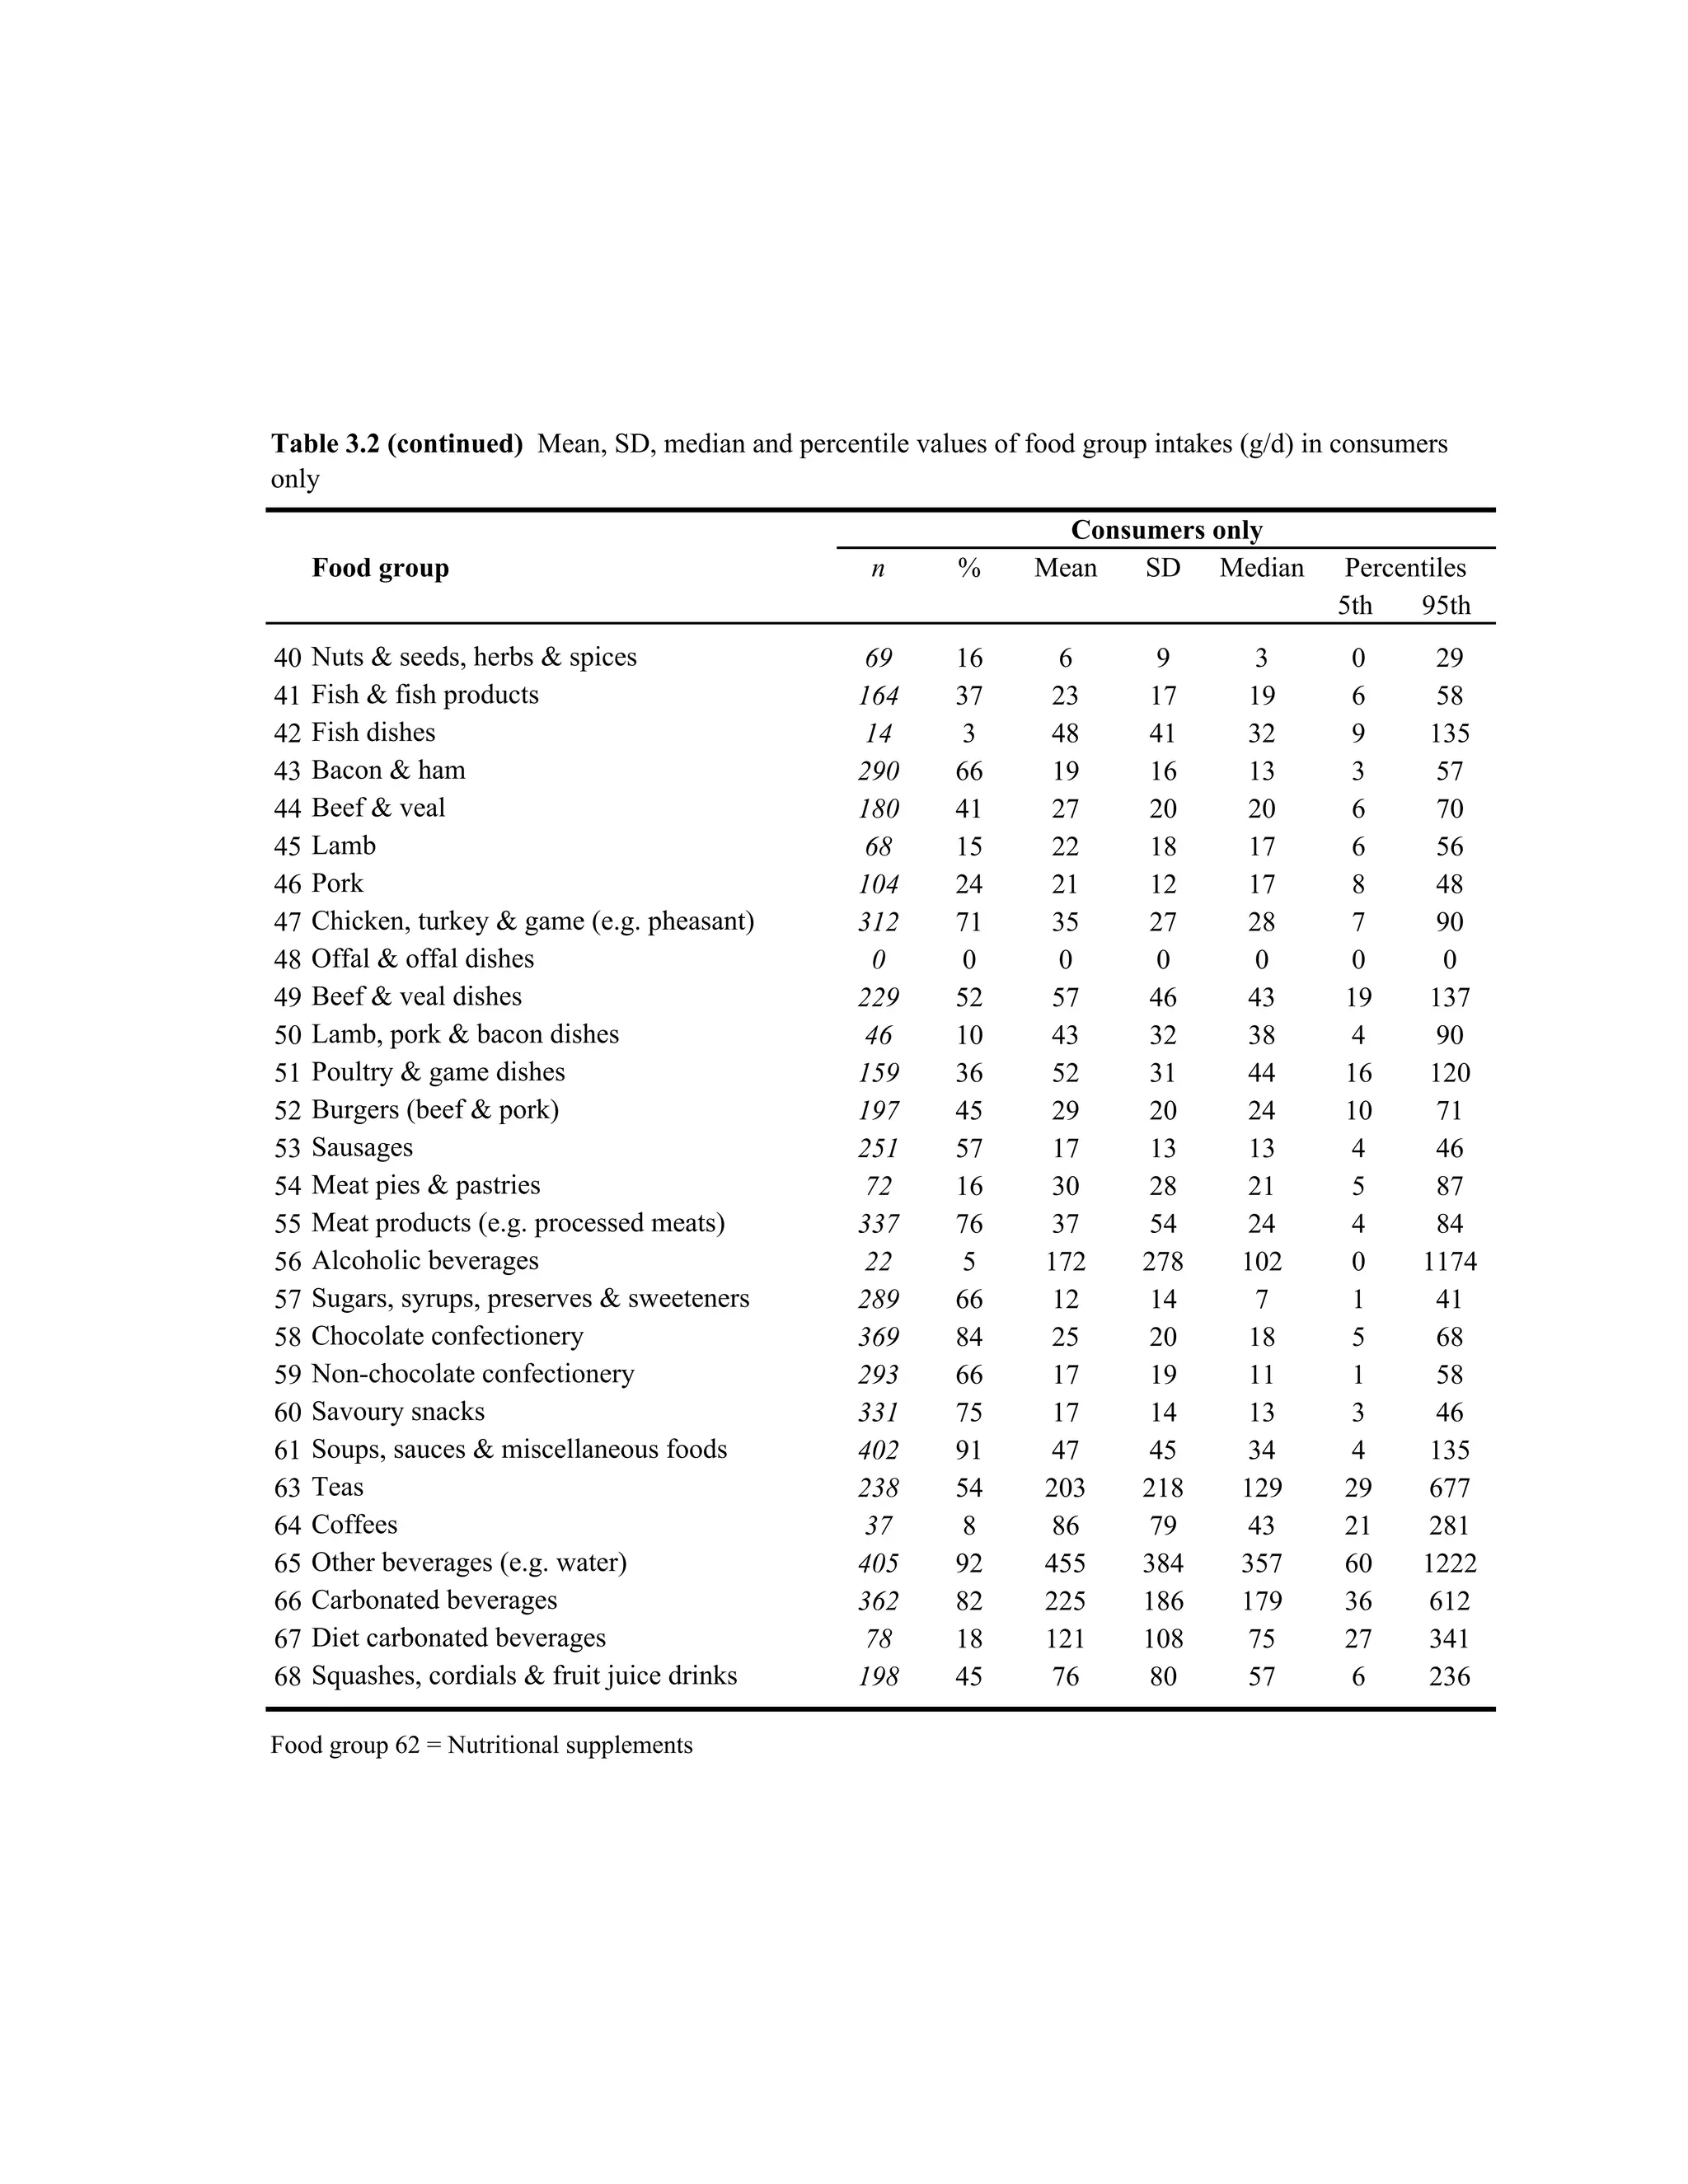

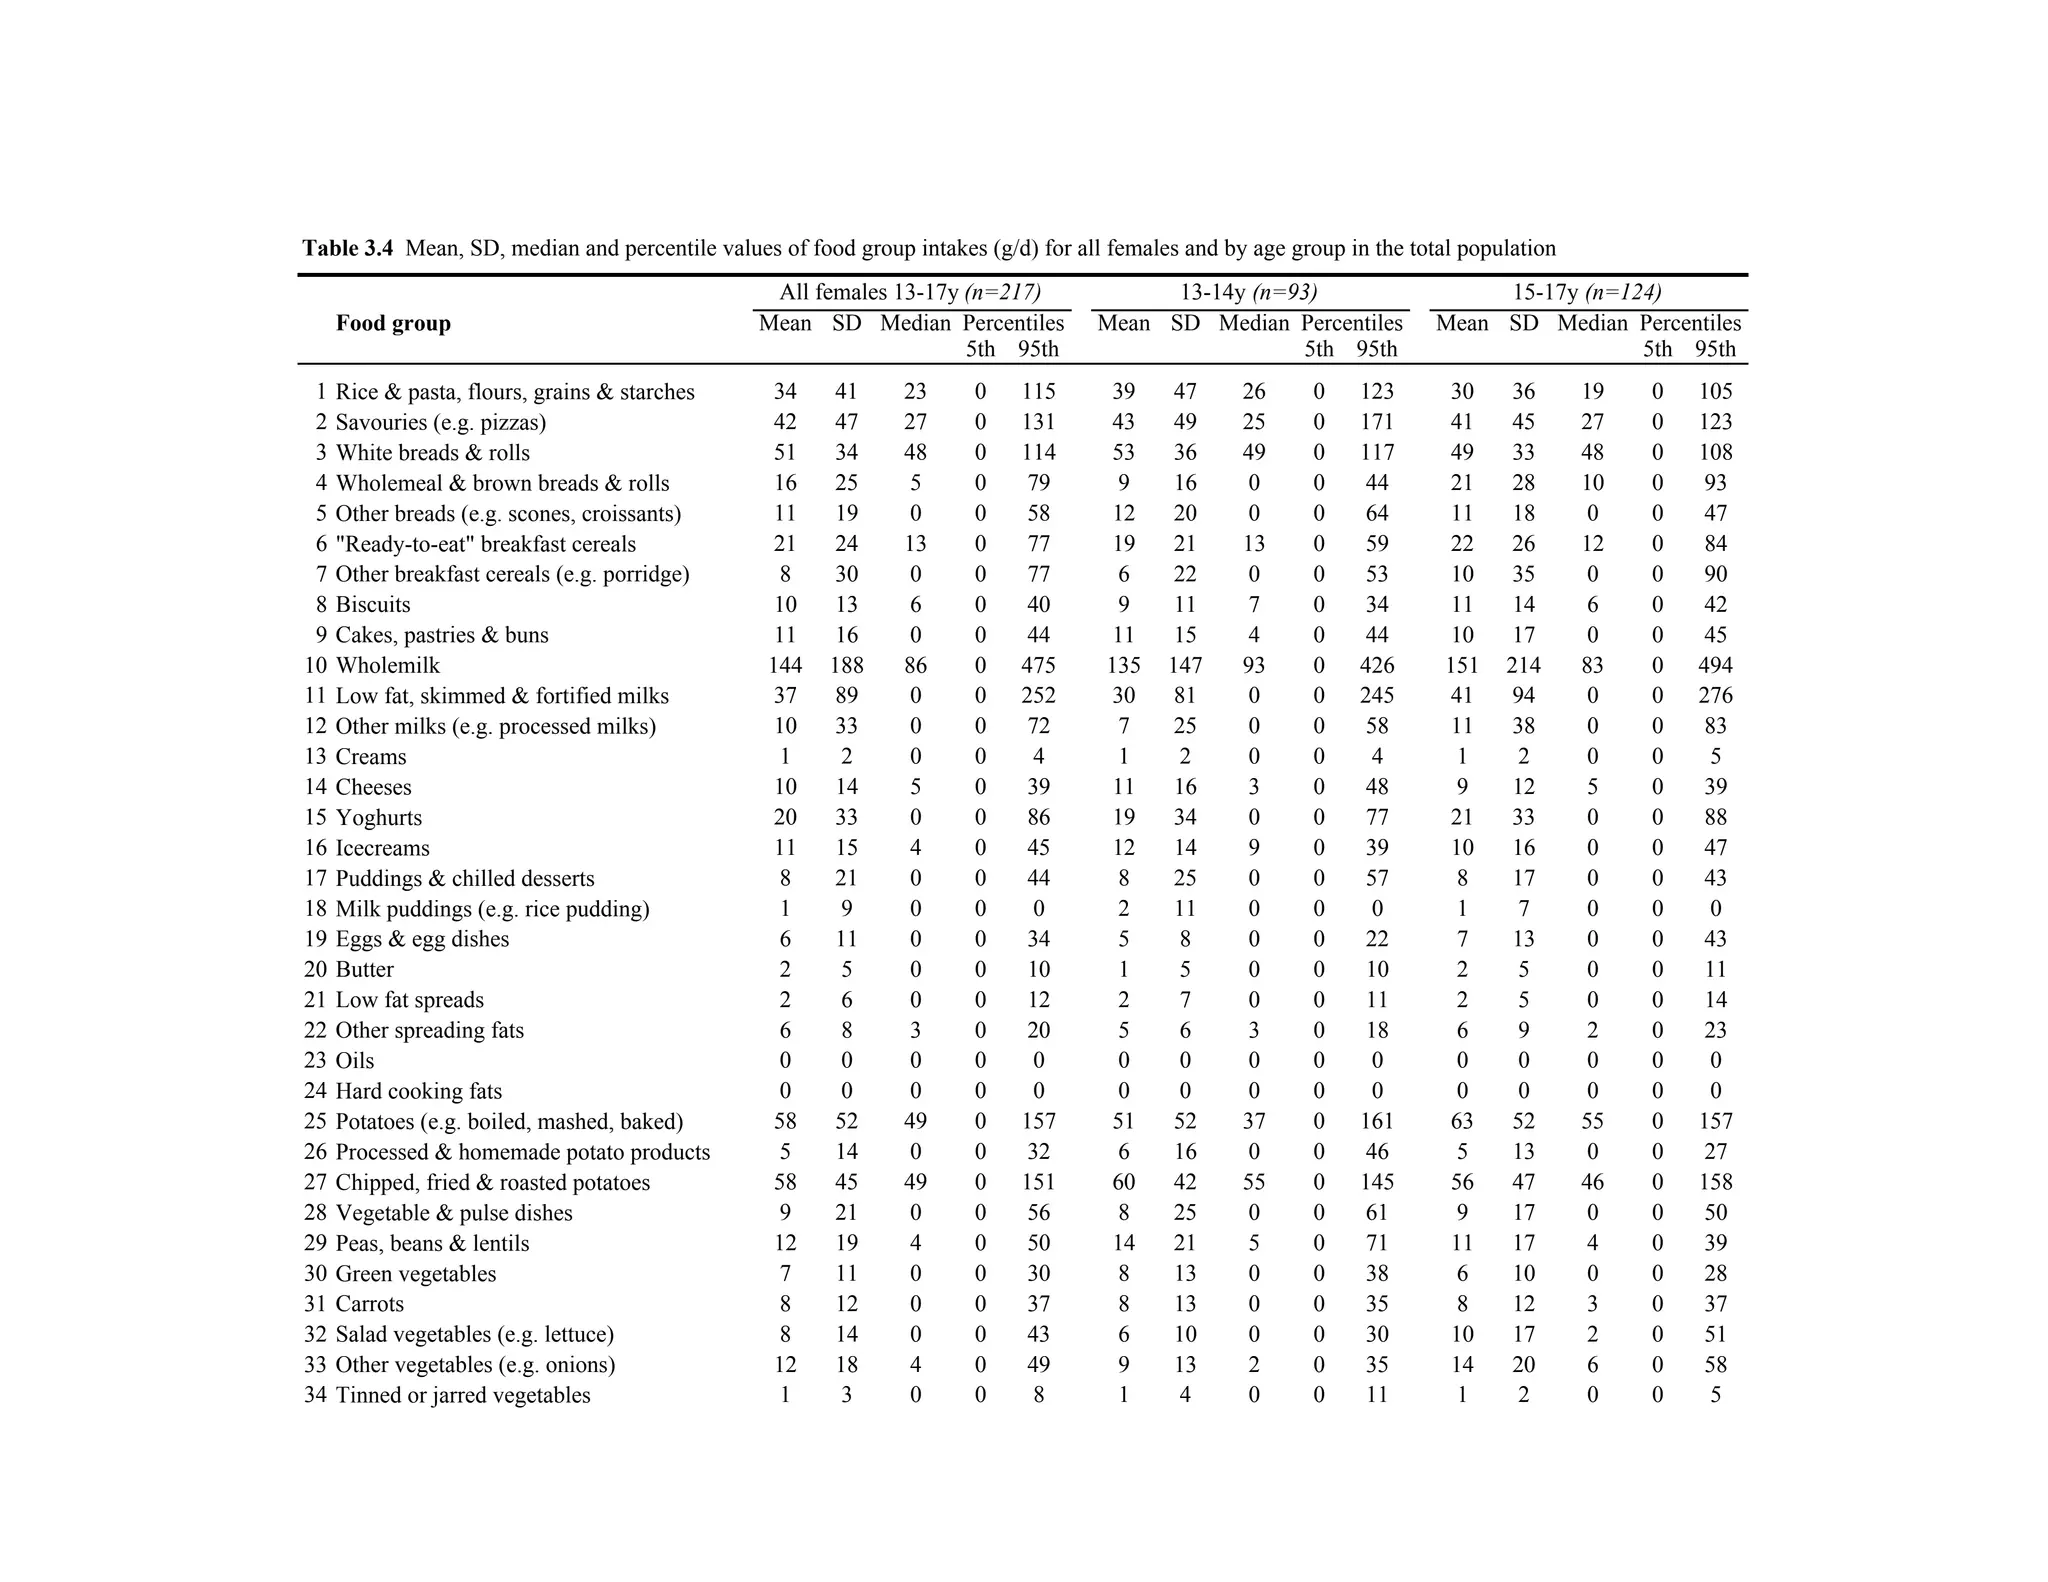

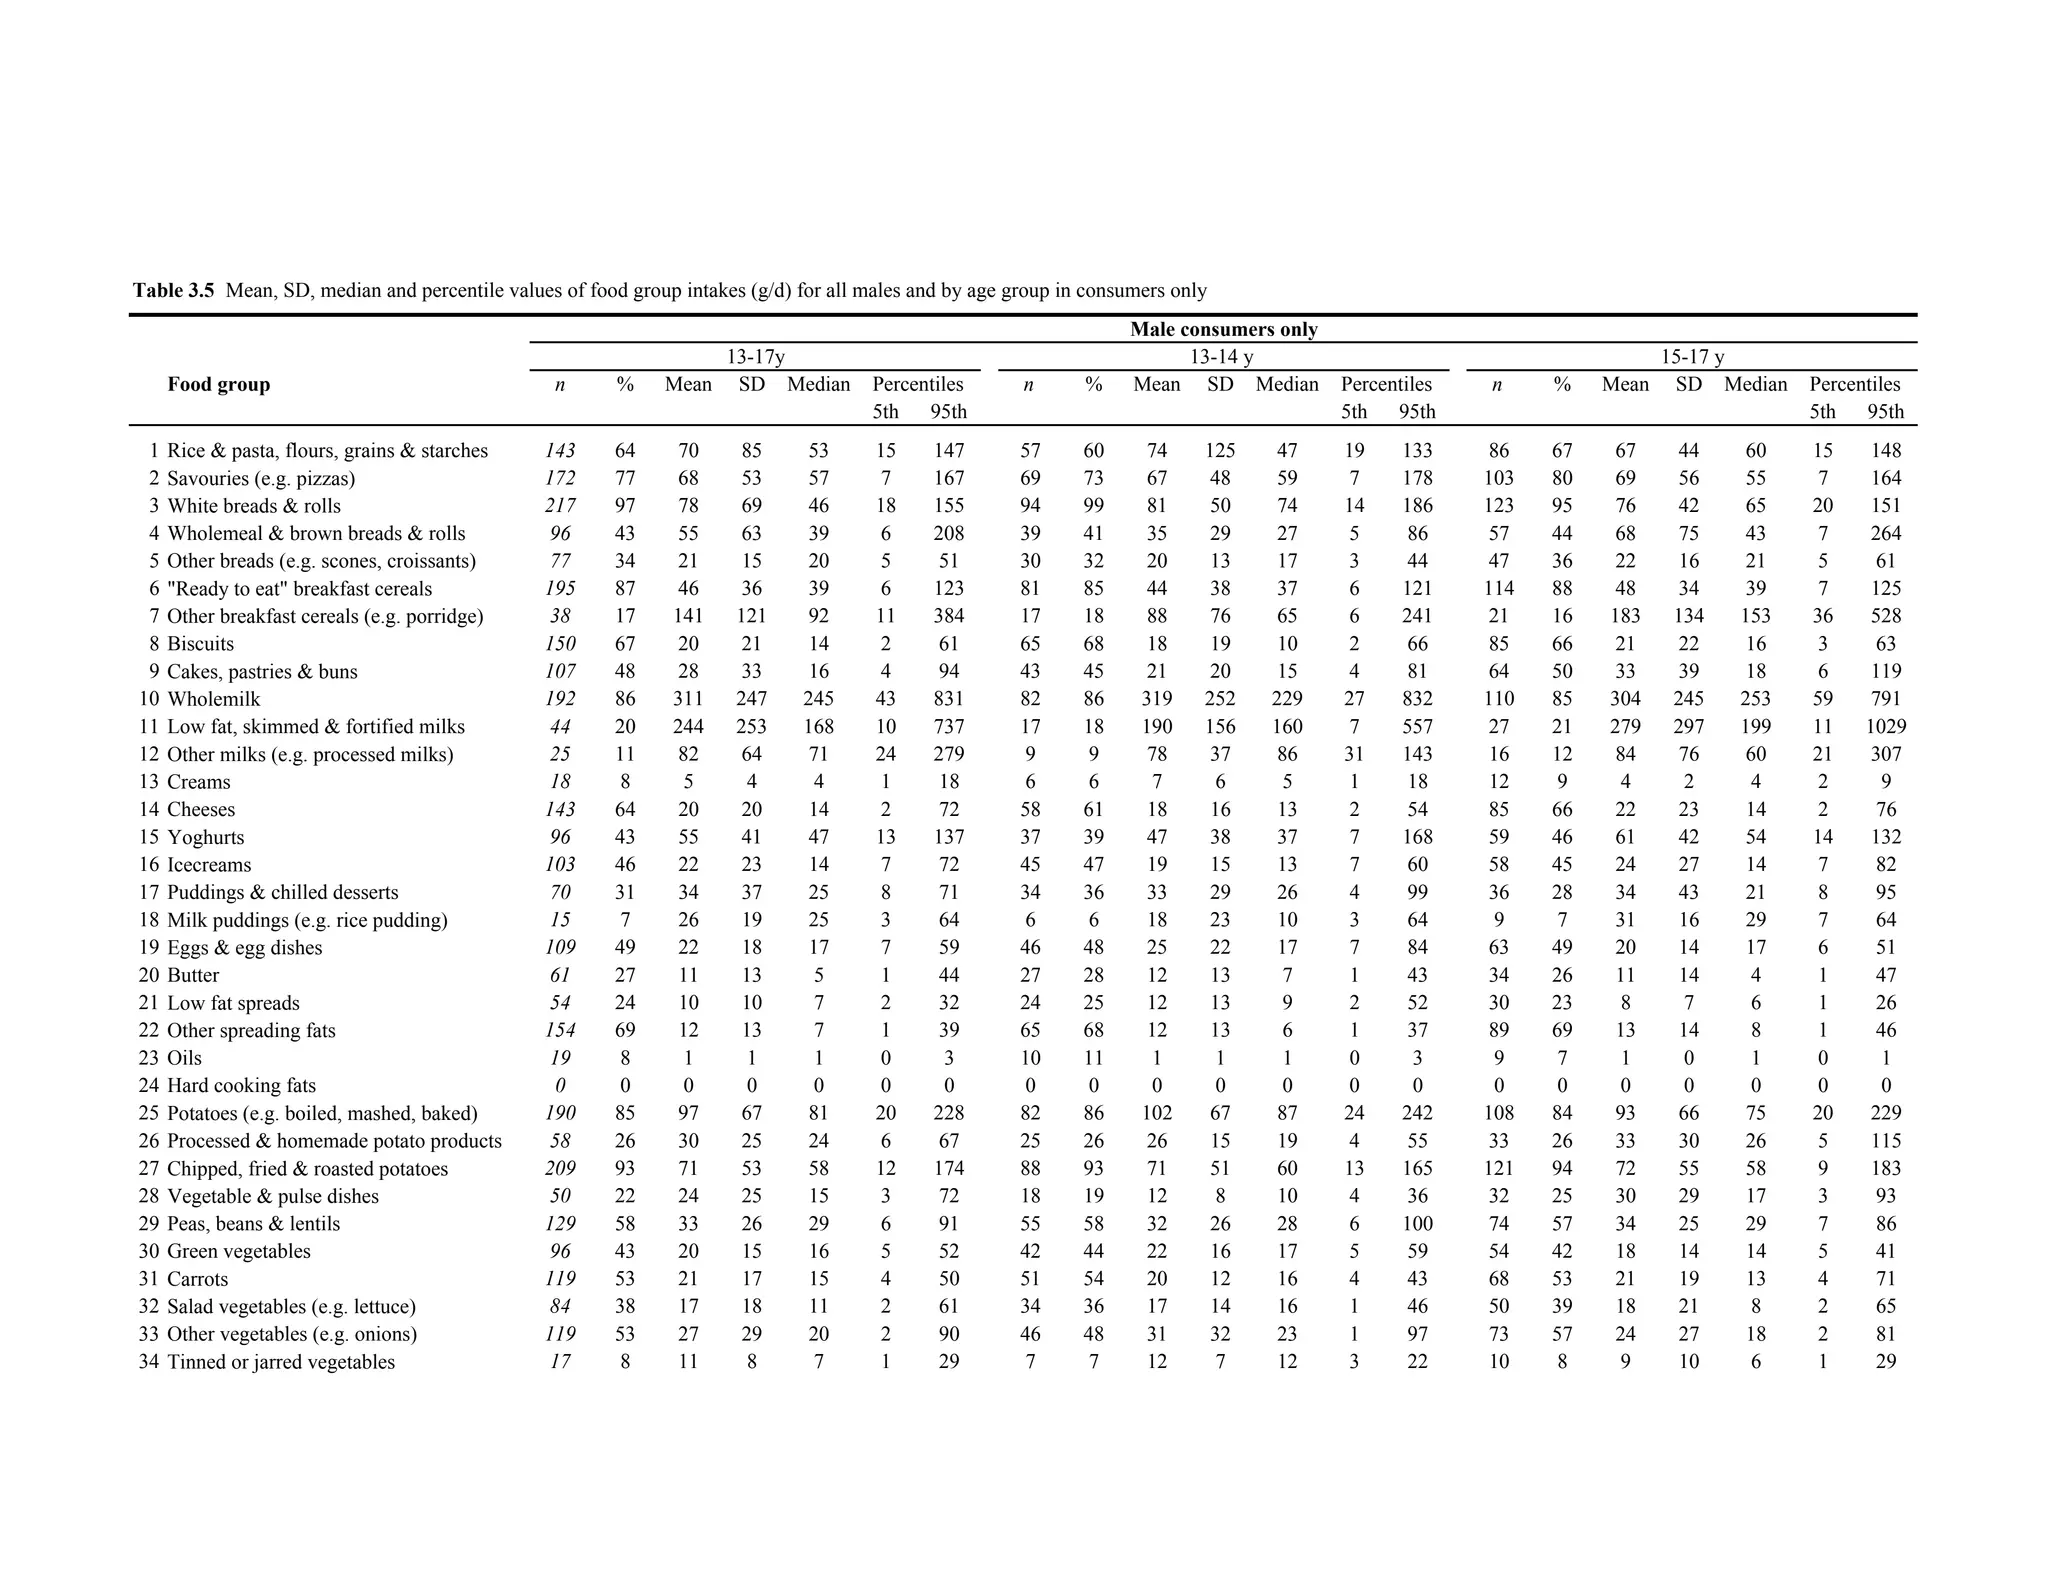


The document presents mean, standard deviation, median, and percentile values for food group intakes in grams per day for the total population studied and for consumers only. It shows that for most food groups, the mean intake is higher when only considering consumers. For example, the mean rice intake is 39g for the total population but 61g for consumers only. The median and percentile values also increase for many food groups when only considering consumers.