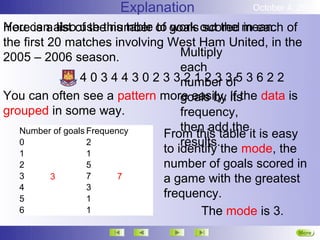
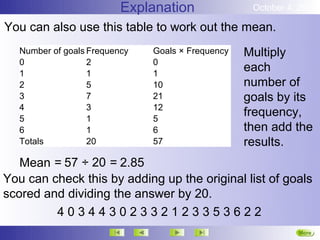
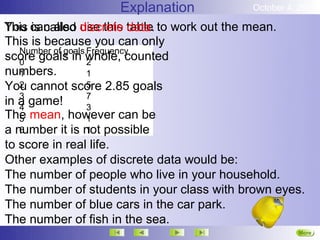
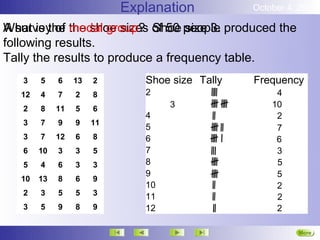
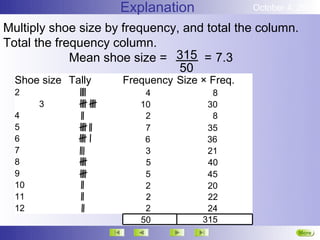
October 4, 2012

      Grouping Data


2. Grouping discrete data.


                                       Next
Explanation               October 4, 2012

Herecan alsoof the number of goals out the mean. of
You is a list use this table to work scored in each
the first 20 matches involving West Ham United, in the
2005 – 2006 season.                  Multiply
                                     each
                 4 0 3 4 4 3 0 2 3 3number 3 5 3 6 2 2
                                      2 1 2 3 of
You can often see a pattern more easily, itsthe data is
                                     goals by if
grouped in some way.                 frequency,
   Number of goals Frequency         then add the
                                 From this table it is easy
   0               2                 results.
   1               1             to identify the mode, the
   2               5             number of goals scored in
   3      3        7      7      a game with the greatest
   4               3
   5               1             frequency.
   6               1                     The mode is 3.
                                                          More
                                                          Next
Explanation               October 4, 2012

You can also use this table to work out the mean.
   Number of goals Frequency   Goals × Frequency   Multiply
   0               2           0
   1               1           1
                                                   each
   2               5           10                  number of
   3               7           21                  goals by its
   4               3           12
   5               1           5
                                                   frequency,
   6               1           6                   then add the
   Totals          20          57                  results.
   Mean = 57 ÷ 20 = 2.85
You can check this by adding up the original list of goals
scored and dividing the answer by 20.
         40344302332123353622
                                                              More
Explanation            October 4, 2012

This can also discrete table to work out the mean.
You is called use this data.
This is because you can only
   Number of goals Frequency
score goals in whole, counted
   0               2
numbers.
   1               1
You cannot score 2.85 goals
   2               5
   3               7
in a game!
   4               3
The mean, however can be
   5               1
a number it is not possible
   6               1
to score in real life.
Other examples of discrete data would be:
The number of people who live in your household.
The number of students in your class with brown eyes.
The number of blue cars in the car park.
The number of fish in the sea.
                                                     More
                                                     Next
Explanation          October 4, 2012

A survey of the shoe sizes of 50 people produced the
What is the modal group? Shoe size 3.
following results.
Tally the results to produce a frequency table.
   3    5    6    13   2       Shoe size Tally   Frequency
   12   4    7    2    8       2                      4
   2    8    11   5    6            3                10
                               4                      2
   3    7    9    9    11
                               5                      7
   3    7    12   6    8       6                      6
   6    10   3    3    5       7                      3
   5    4    6    3    3       8                      5
                               9                      5
   10   13   8    6    9
                               10                     2
   2    3    5    5    3       11                     2
   3    5    9    8    9       12                     2

                                                           More
                                                           Next
Explanation              October 4, 2012

Multiply shoe size by frequency, and total the column.
Total the frequency column.
             Mean shoe size = 315 = 7.3
                                50
  Shoe size Tally    Frequency Size × Freq.
  2                       4           8
       3                 10          30
  4                       2           8
  5                       7          35
  6                       6          36
  7                       3          21
  8                       5          40
  9                       5          45
  10                      2          20
  11                      2          22
  12                      2          24
                         50         315
                                                         More
                                                         Next
Example                       October 4, 2012

Calculate the mean number of children in each house on
Bury Road.
                                      Frequency ×
        No. of Children   Frequency
                                      No. of children
        0                 4                  0
        1                 6                  6
        2                 5                 10
        3                 7                 21
        4                 1                  4
        5                 2                 10
        Total                  20           51


       Mean Children per house = 51 = 2.55
                                 20
                                                                  More
                                                                  Next
                                                                  End

Grouping data discrete

  • 1.
    October 4, 2012 Grouping Data 2. Grouping discrete data. Next
  • 2.
    Explanation October 4, 2012 Herecan alsoof the number of goals out the mean. of You is a list use this table to work scored in each the first 20 matches involving West Ham United, in the 2005 – 2006 season. Multiply each 4 0 3 4 4 3 0 2 3 3number 3 5 3 6 2 2 2 1 2 3 of You can often see a pattern more easily, itsthe data is goals by if grouped in some way. frequency, Number of goals Frequency then add the From this table it is easy 0 2 results. 1 1 to identify the mode, the 2 5 number of goals scored in 3 3 7 7 a game with the greatest 4 3 5 1 frequency. 6 1 The mode is 3. More Next
  • 3.
    Explanation October 4, 2012 You can also use this table to work out the mean. Number of goals Frequency Goals × Frequency Multiply 0 2 0 1 1 1 each 2 5 10 number of 3 7 21 goals by its 4 3 12 5 1 5 frequency, 6 1 6 then add the Totals 20 57 results. Mean = 57 ÷ 20 = 2.85 You can check this by adding up the original list of goals scored and dividing the answer by 20. 40344302332123353622 More
  • 4.
    Explanation October 4, 2012 This can also discrete table to work out the mean. You is called use this data. This is because you can only Number of goals Frequency score goals in whole, counted 0 2 numbers. 1 1 You cannot score 2.85 goals 2 5 3 7 in a game! 4 3 The mean, however can be 5 1 a number it is not possible 6 1 to score in real life. Other examples of discrete data would be: The number of people who live in your household. The number of students in your class with brown eyes. The number of blue cars in the car park. The number of fish in the sea. More Next
  • 5.
    Explanation October 4, 2012 A survey of the shoe sizes of 50 people produced the What is the modal group? Shoe size 3. following results. Tally the results to produce a frequency table. 3 5 6 13 2 Shoe size Tally Frequency 12 4 7 2 8 2 4 2 8 11 5 6 3 10 4 2 3 7 9 9 11 5 7 3 7 12 6 8 6 6 6 10 3 3 5 7 3 5 4 6 3 3 8 5 9 5 10 13 8 6 9 10 2 2 3 5 5 3 11 2 3 5 9 8 9 12 2 More Next
  • 6.
    Explanation October 4, 2012 Multiply shoe size by frequency, and total the column. Total the frequency column. Mean shoe size = 315 = 7.3 50 Shoe size Tally Frequency Size × Freq. 2 4 8 3 10 30 4 2 8 5 7 35 6 6 36 7 3 21 8 5 40 9 5 45 10 2 20 11 2 22 12 2 24 50 315 More Next
  • 7.
    Example October 4, 2012 Calculate the mean number of children in each house on Bury Road. Frequency × No. of Children Frequency No. of children 0 4 0 1 6 6 2 5 10 3 7 21 4 1 4 5 2 10 Total 20 51 Mean Children per house = 51 = 2.55 20 More Next End