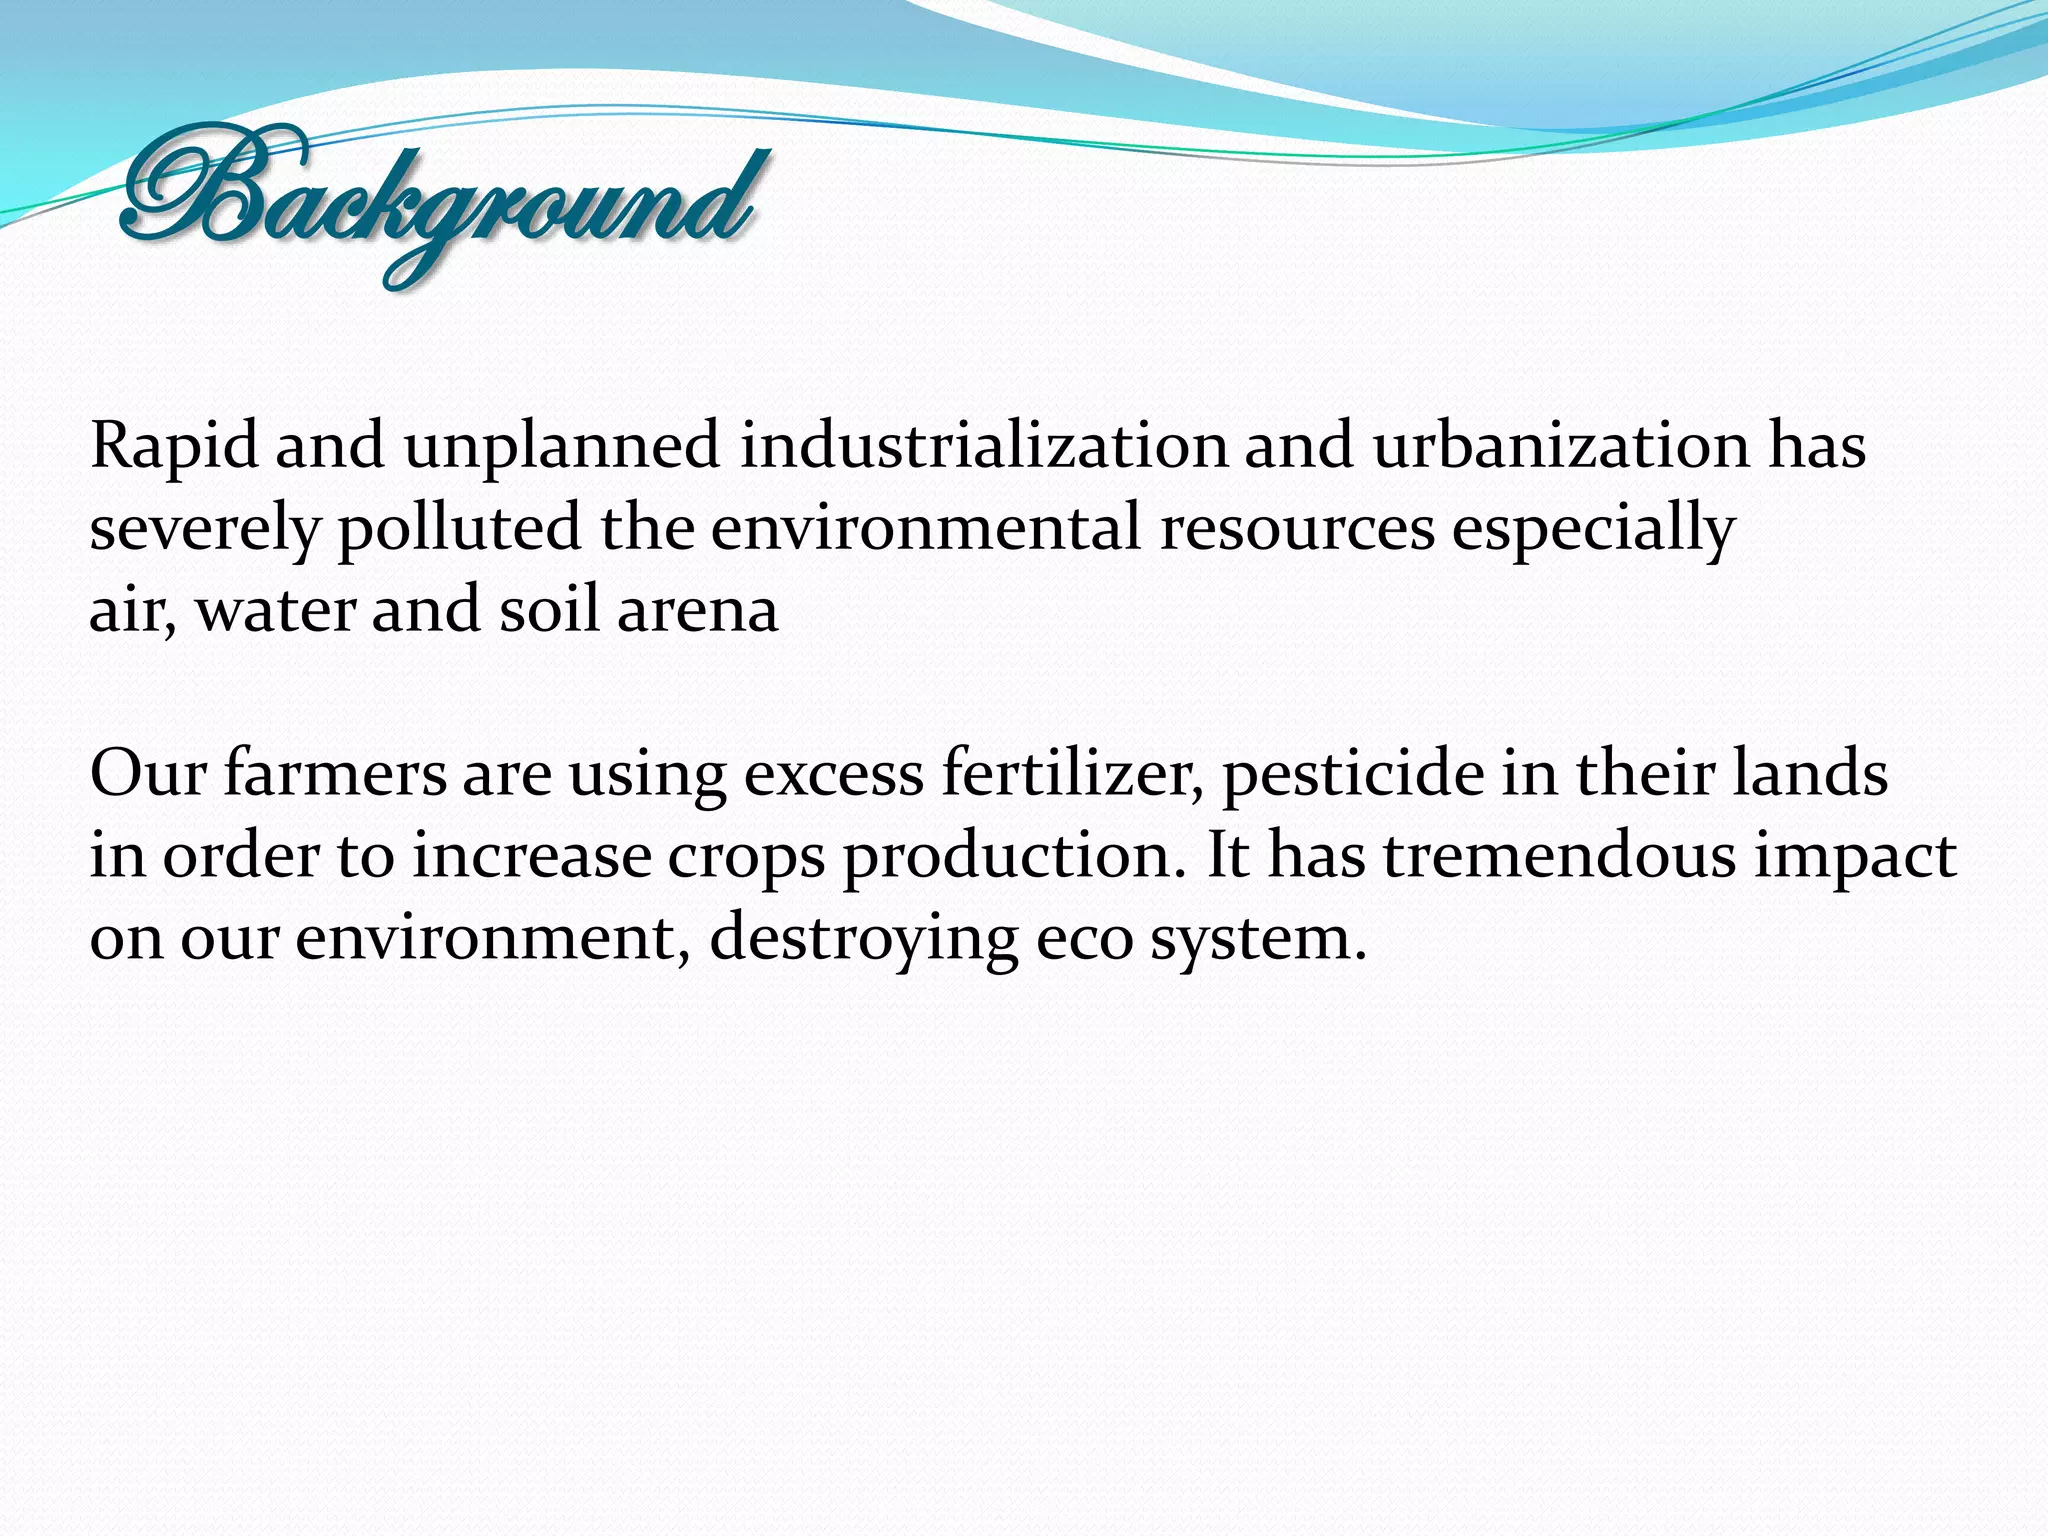
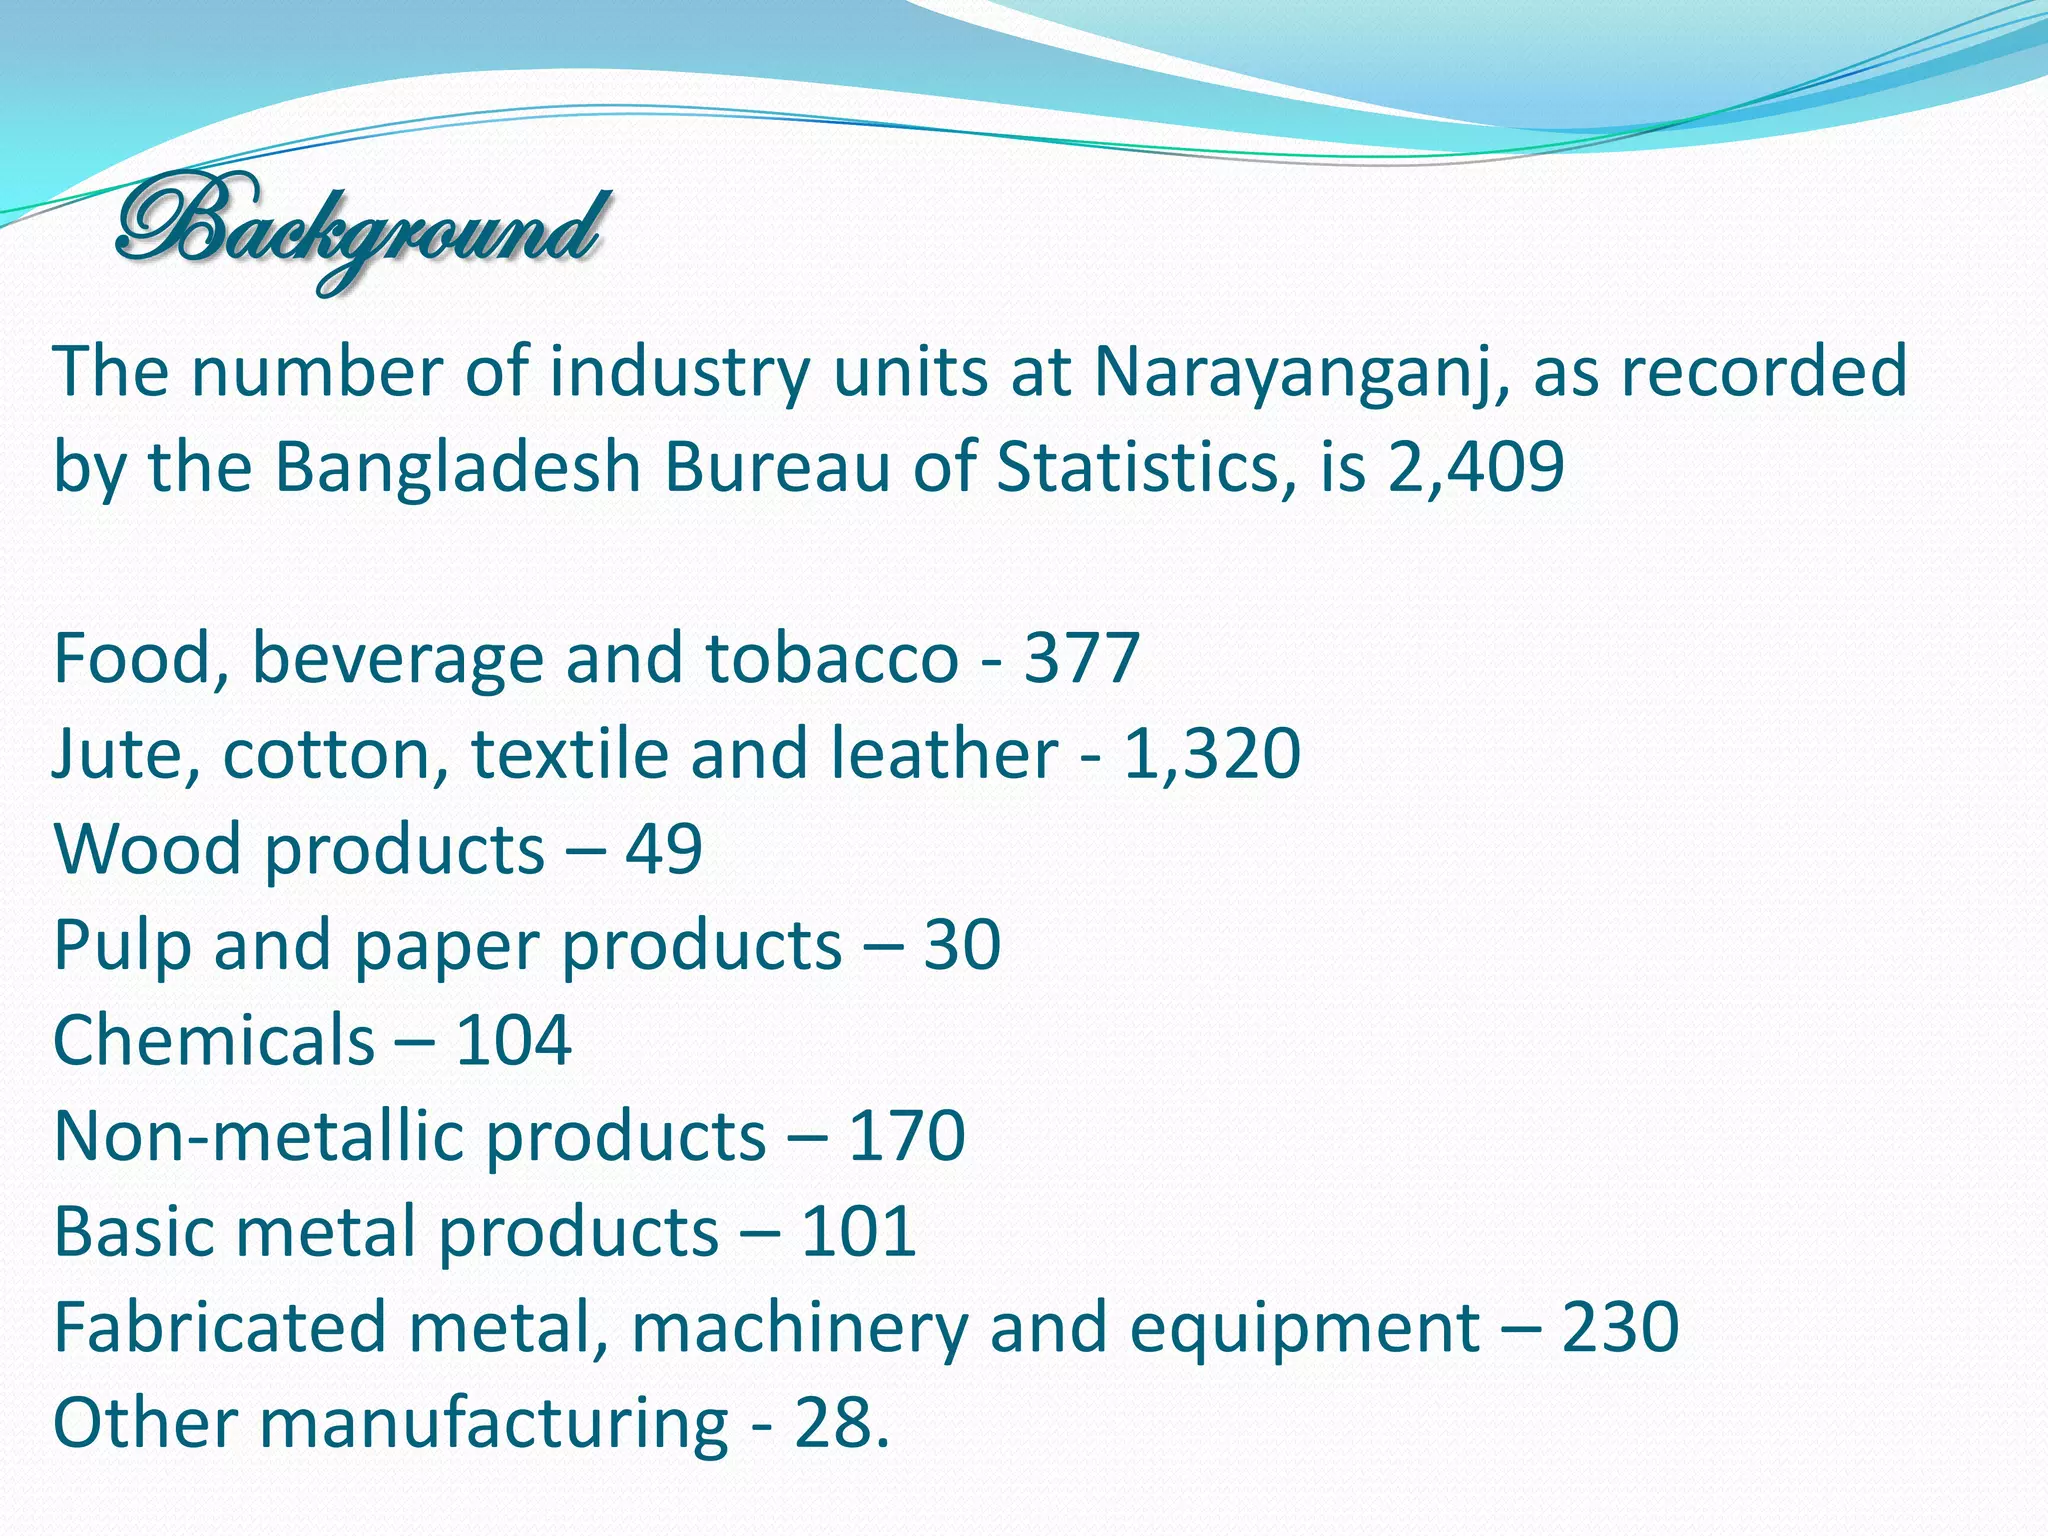
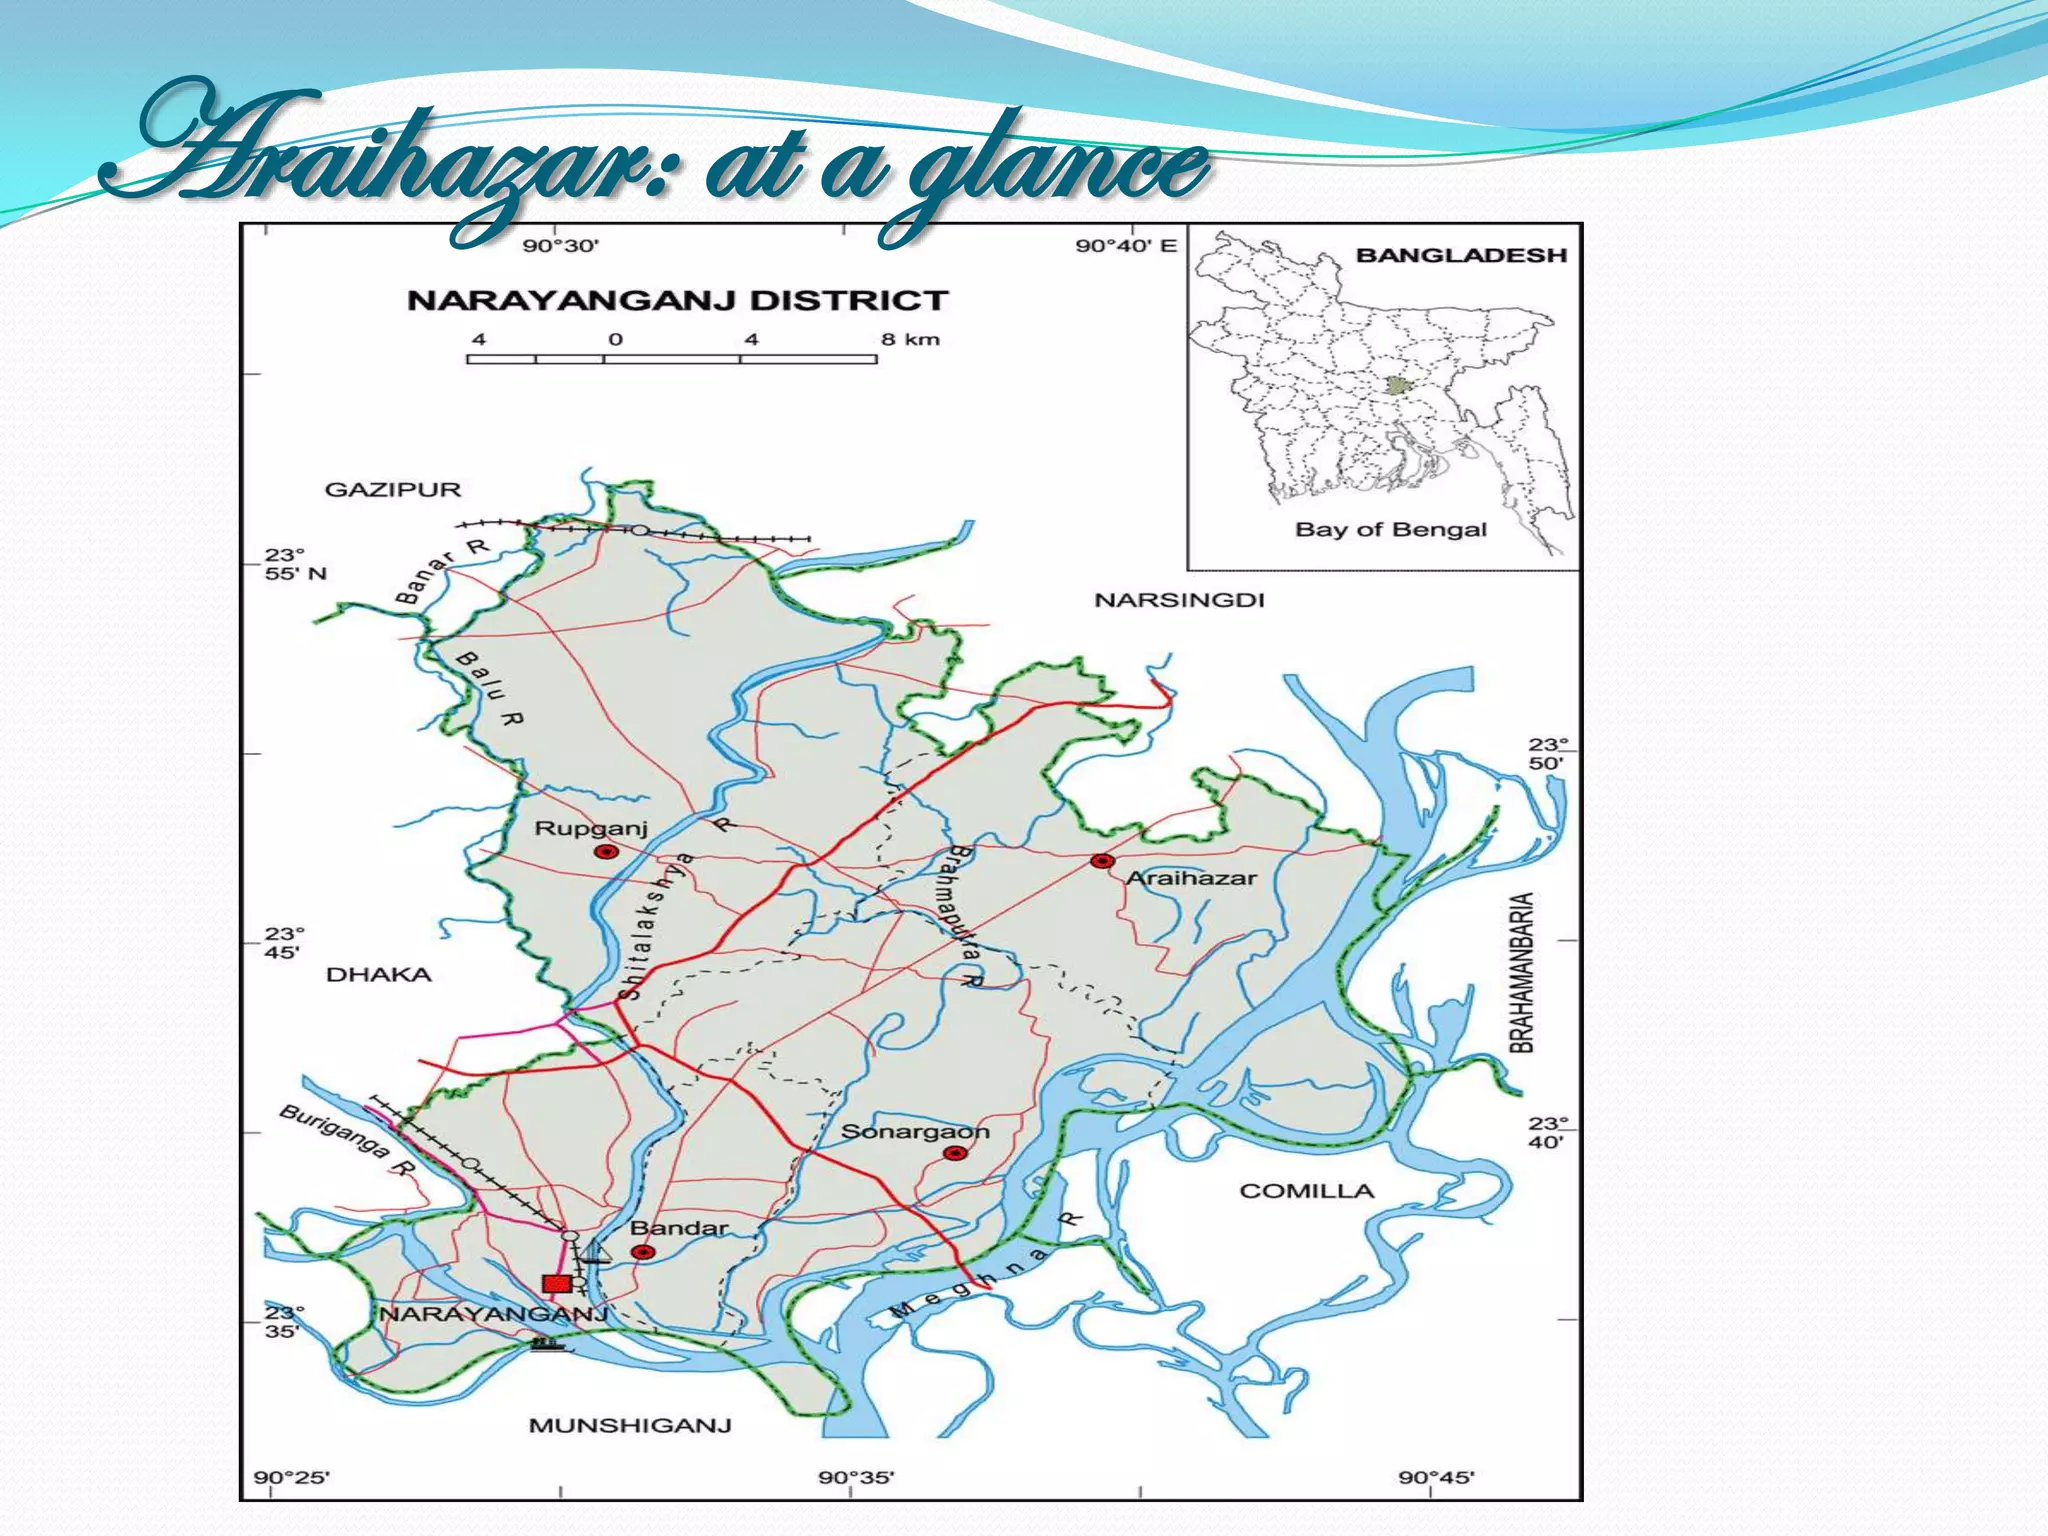
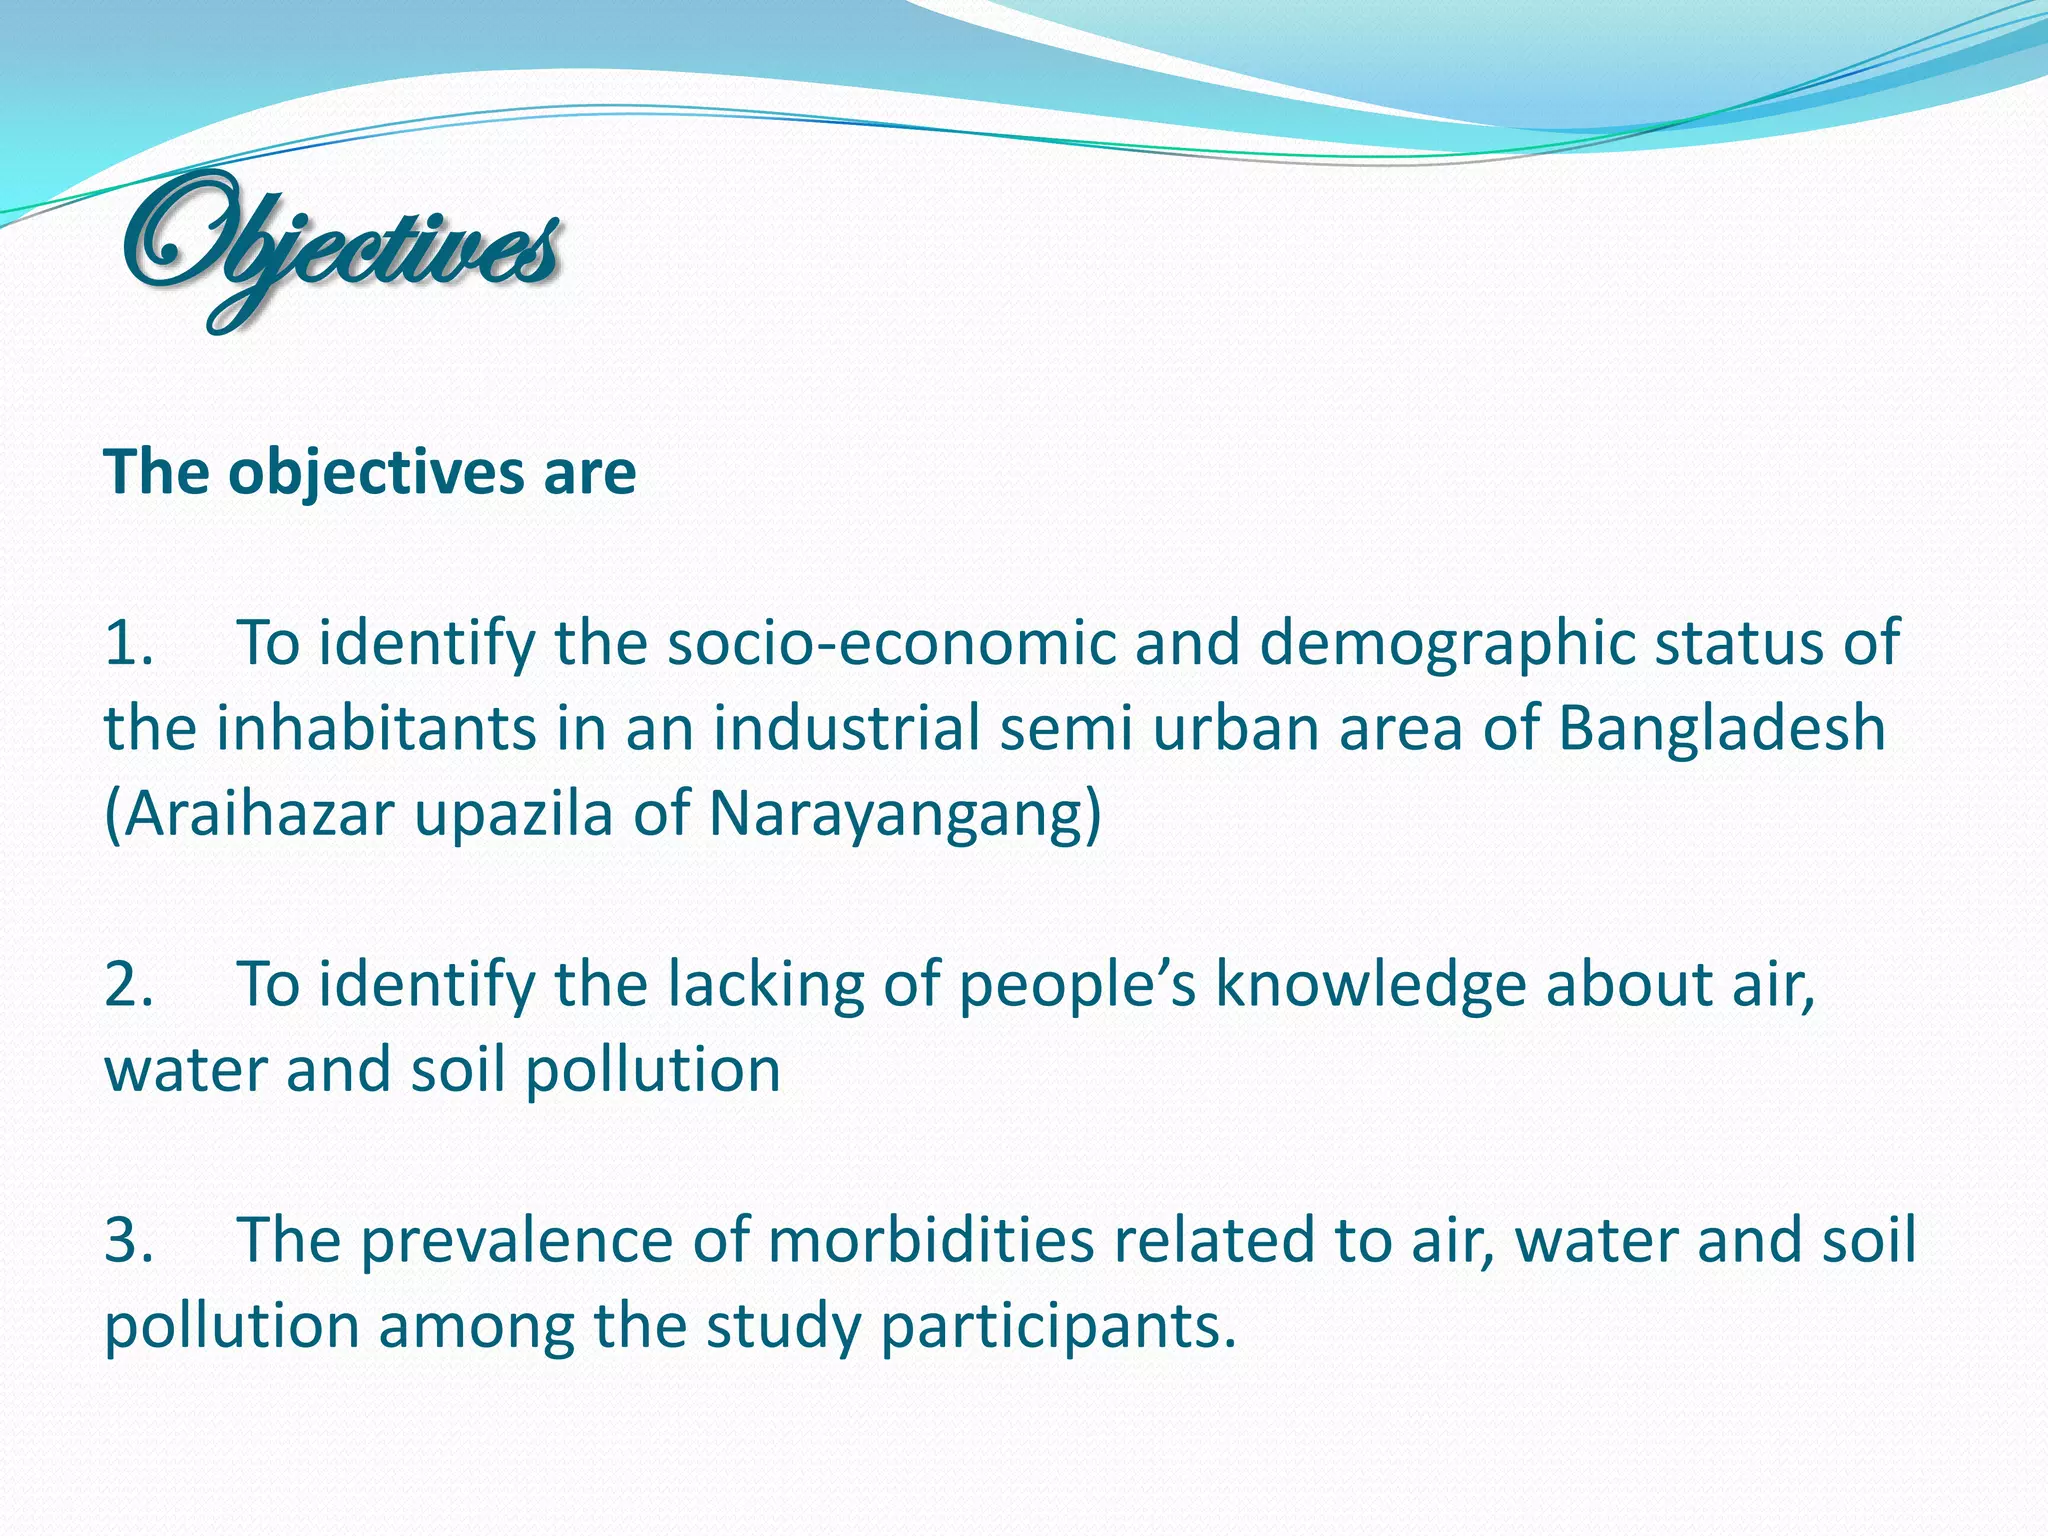
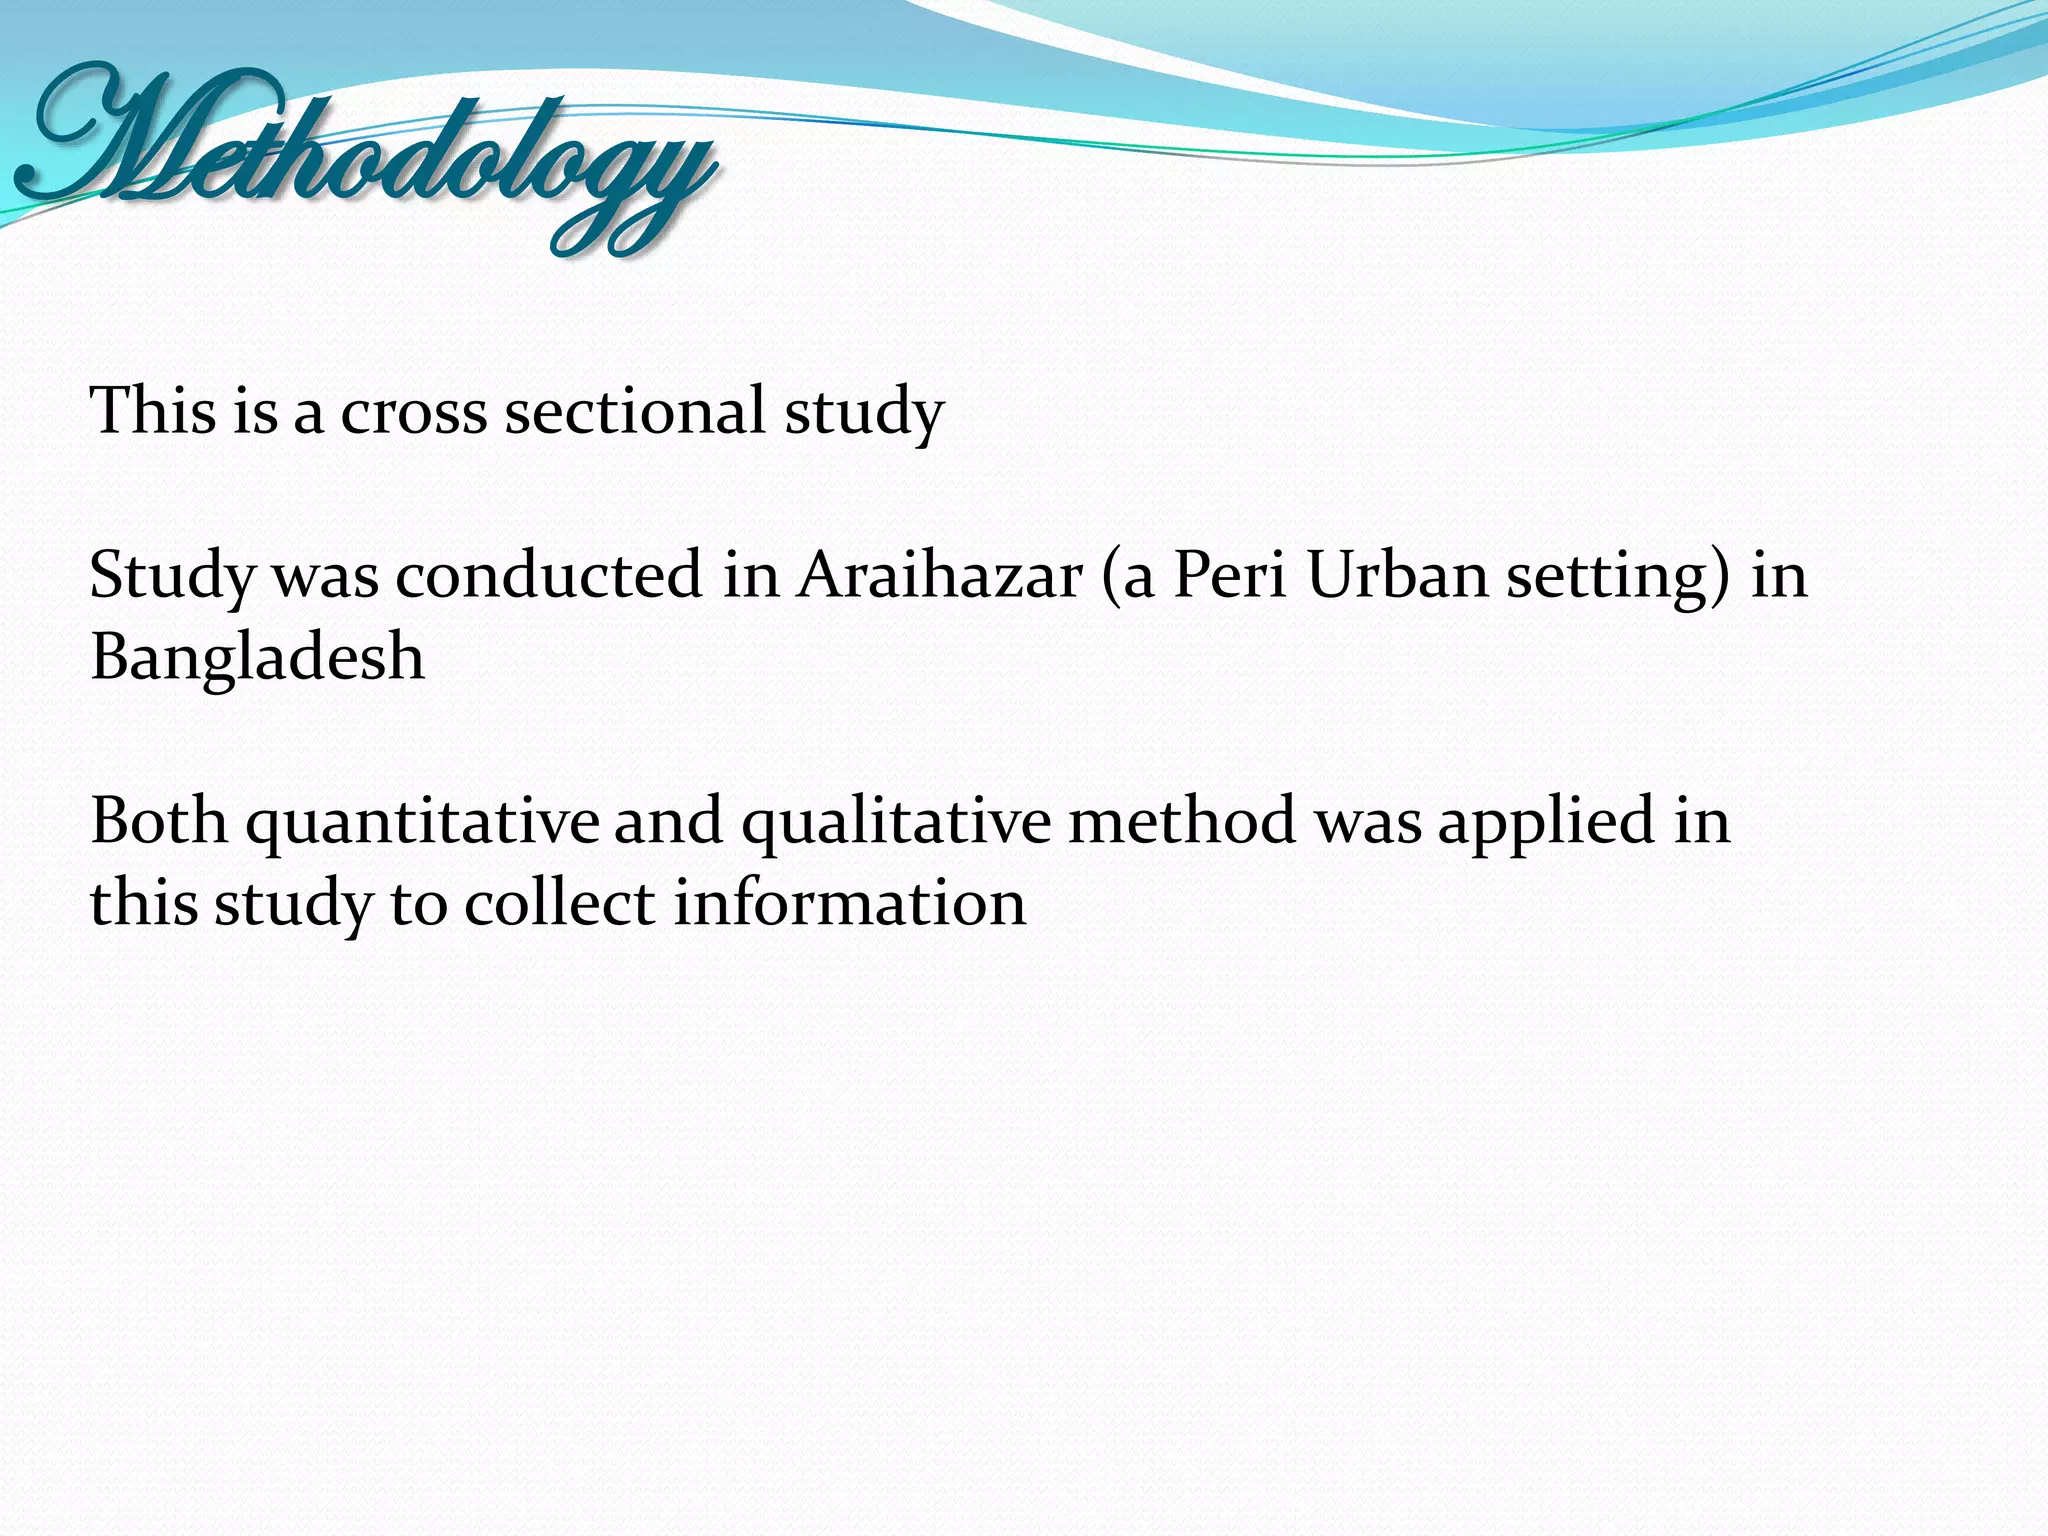
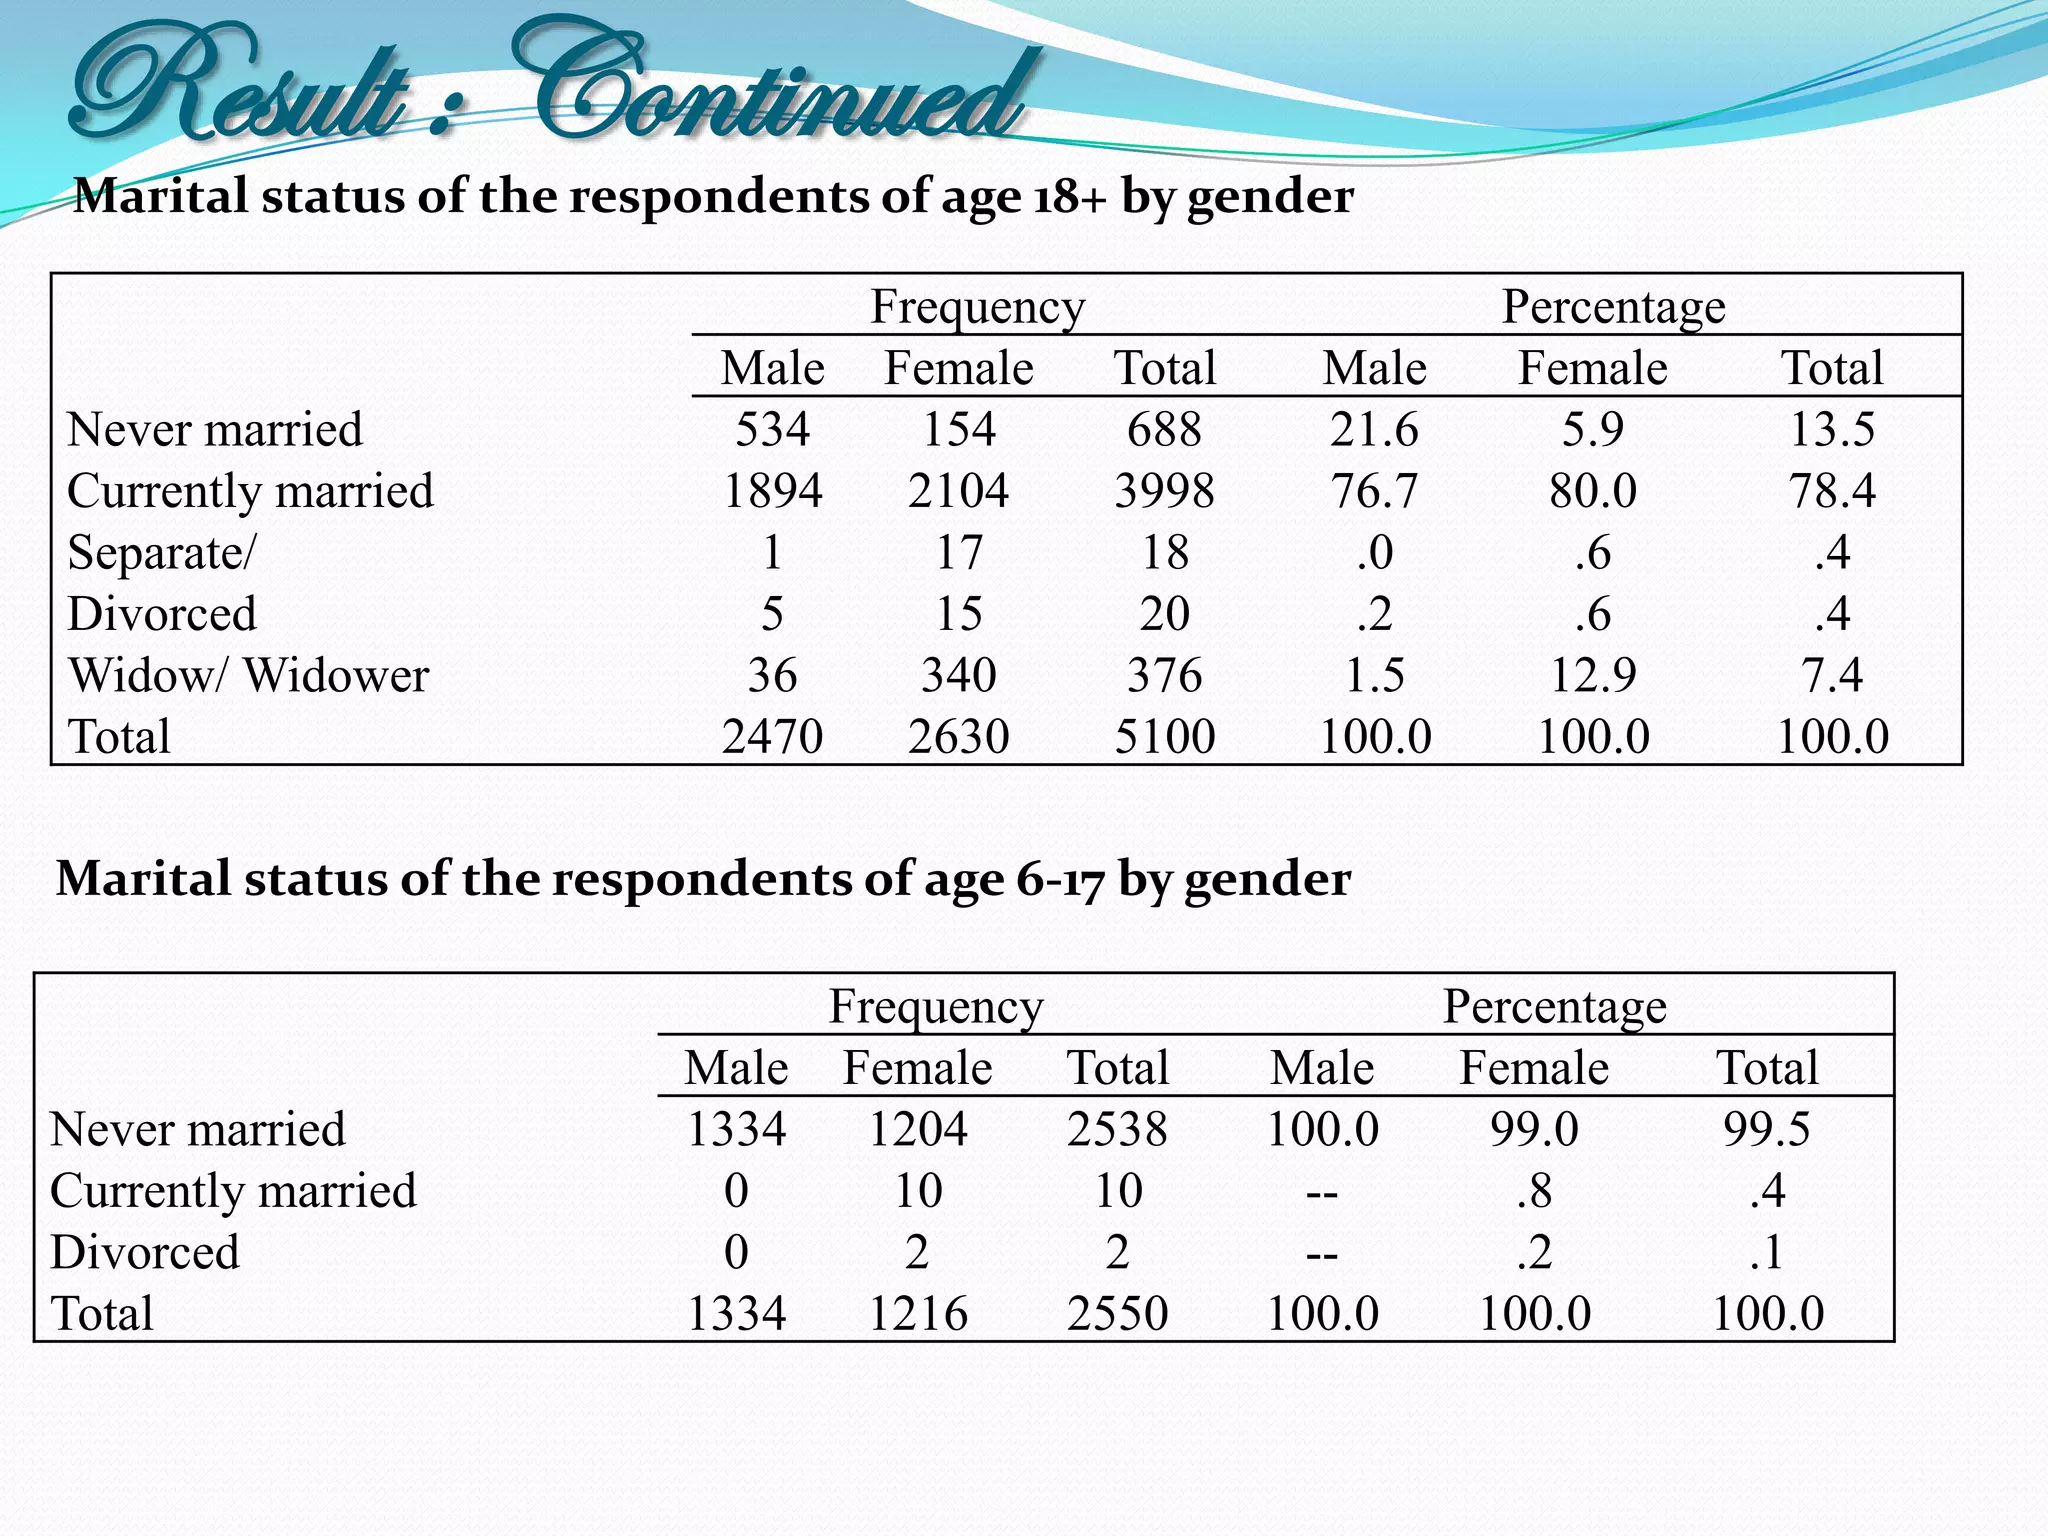
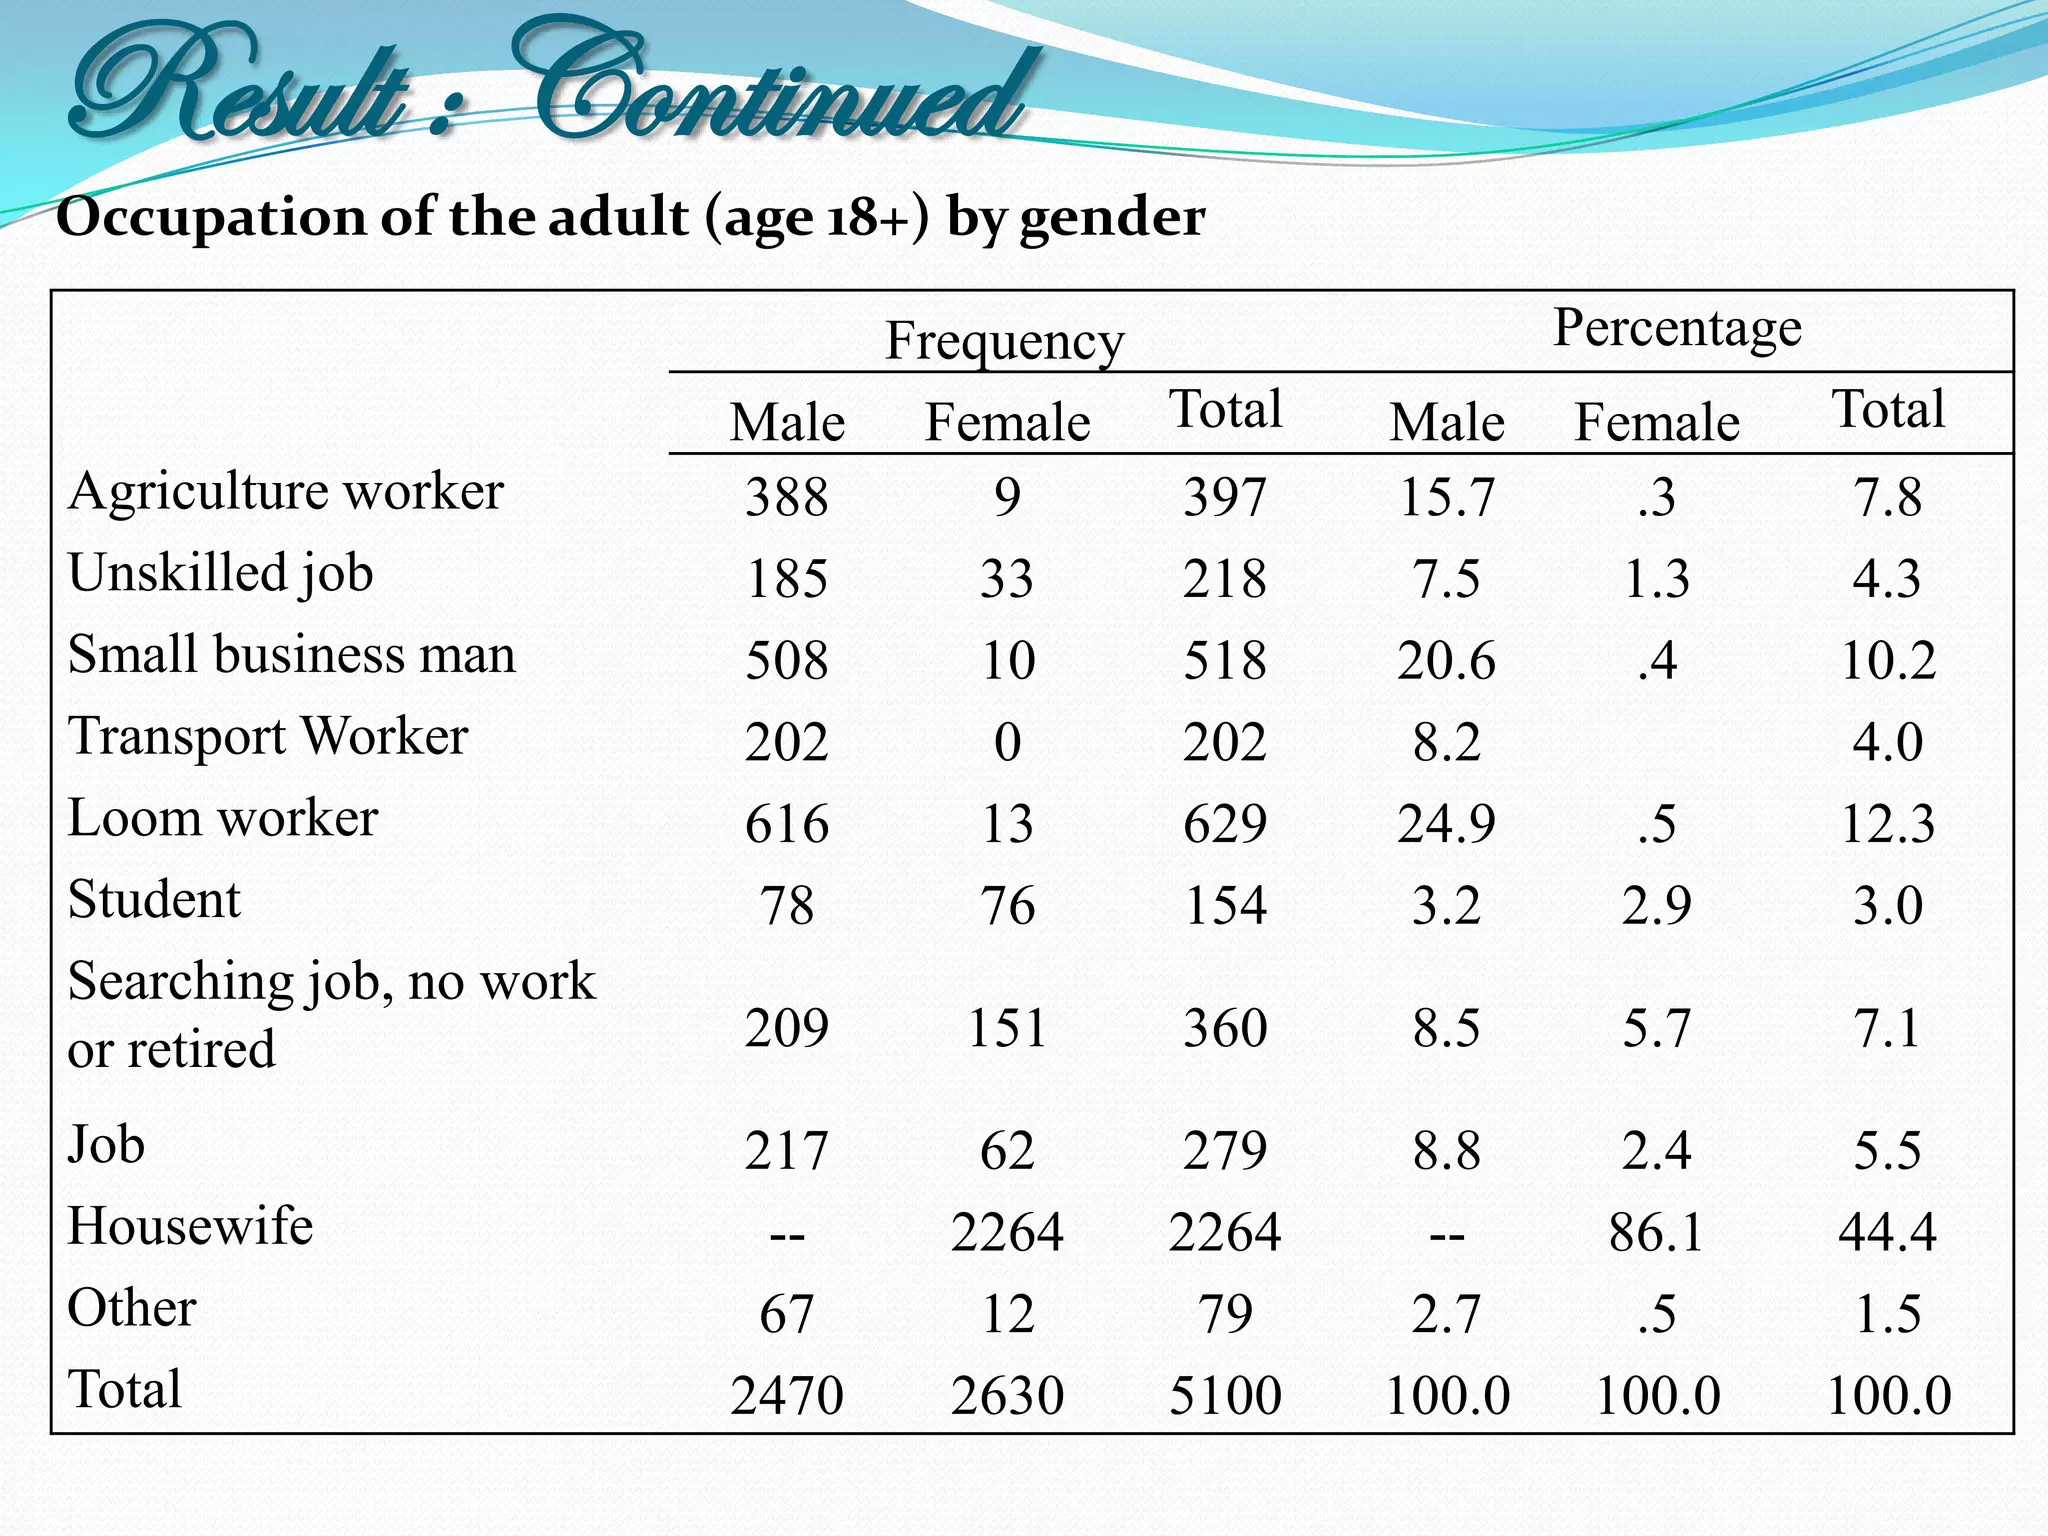
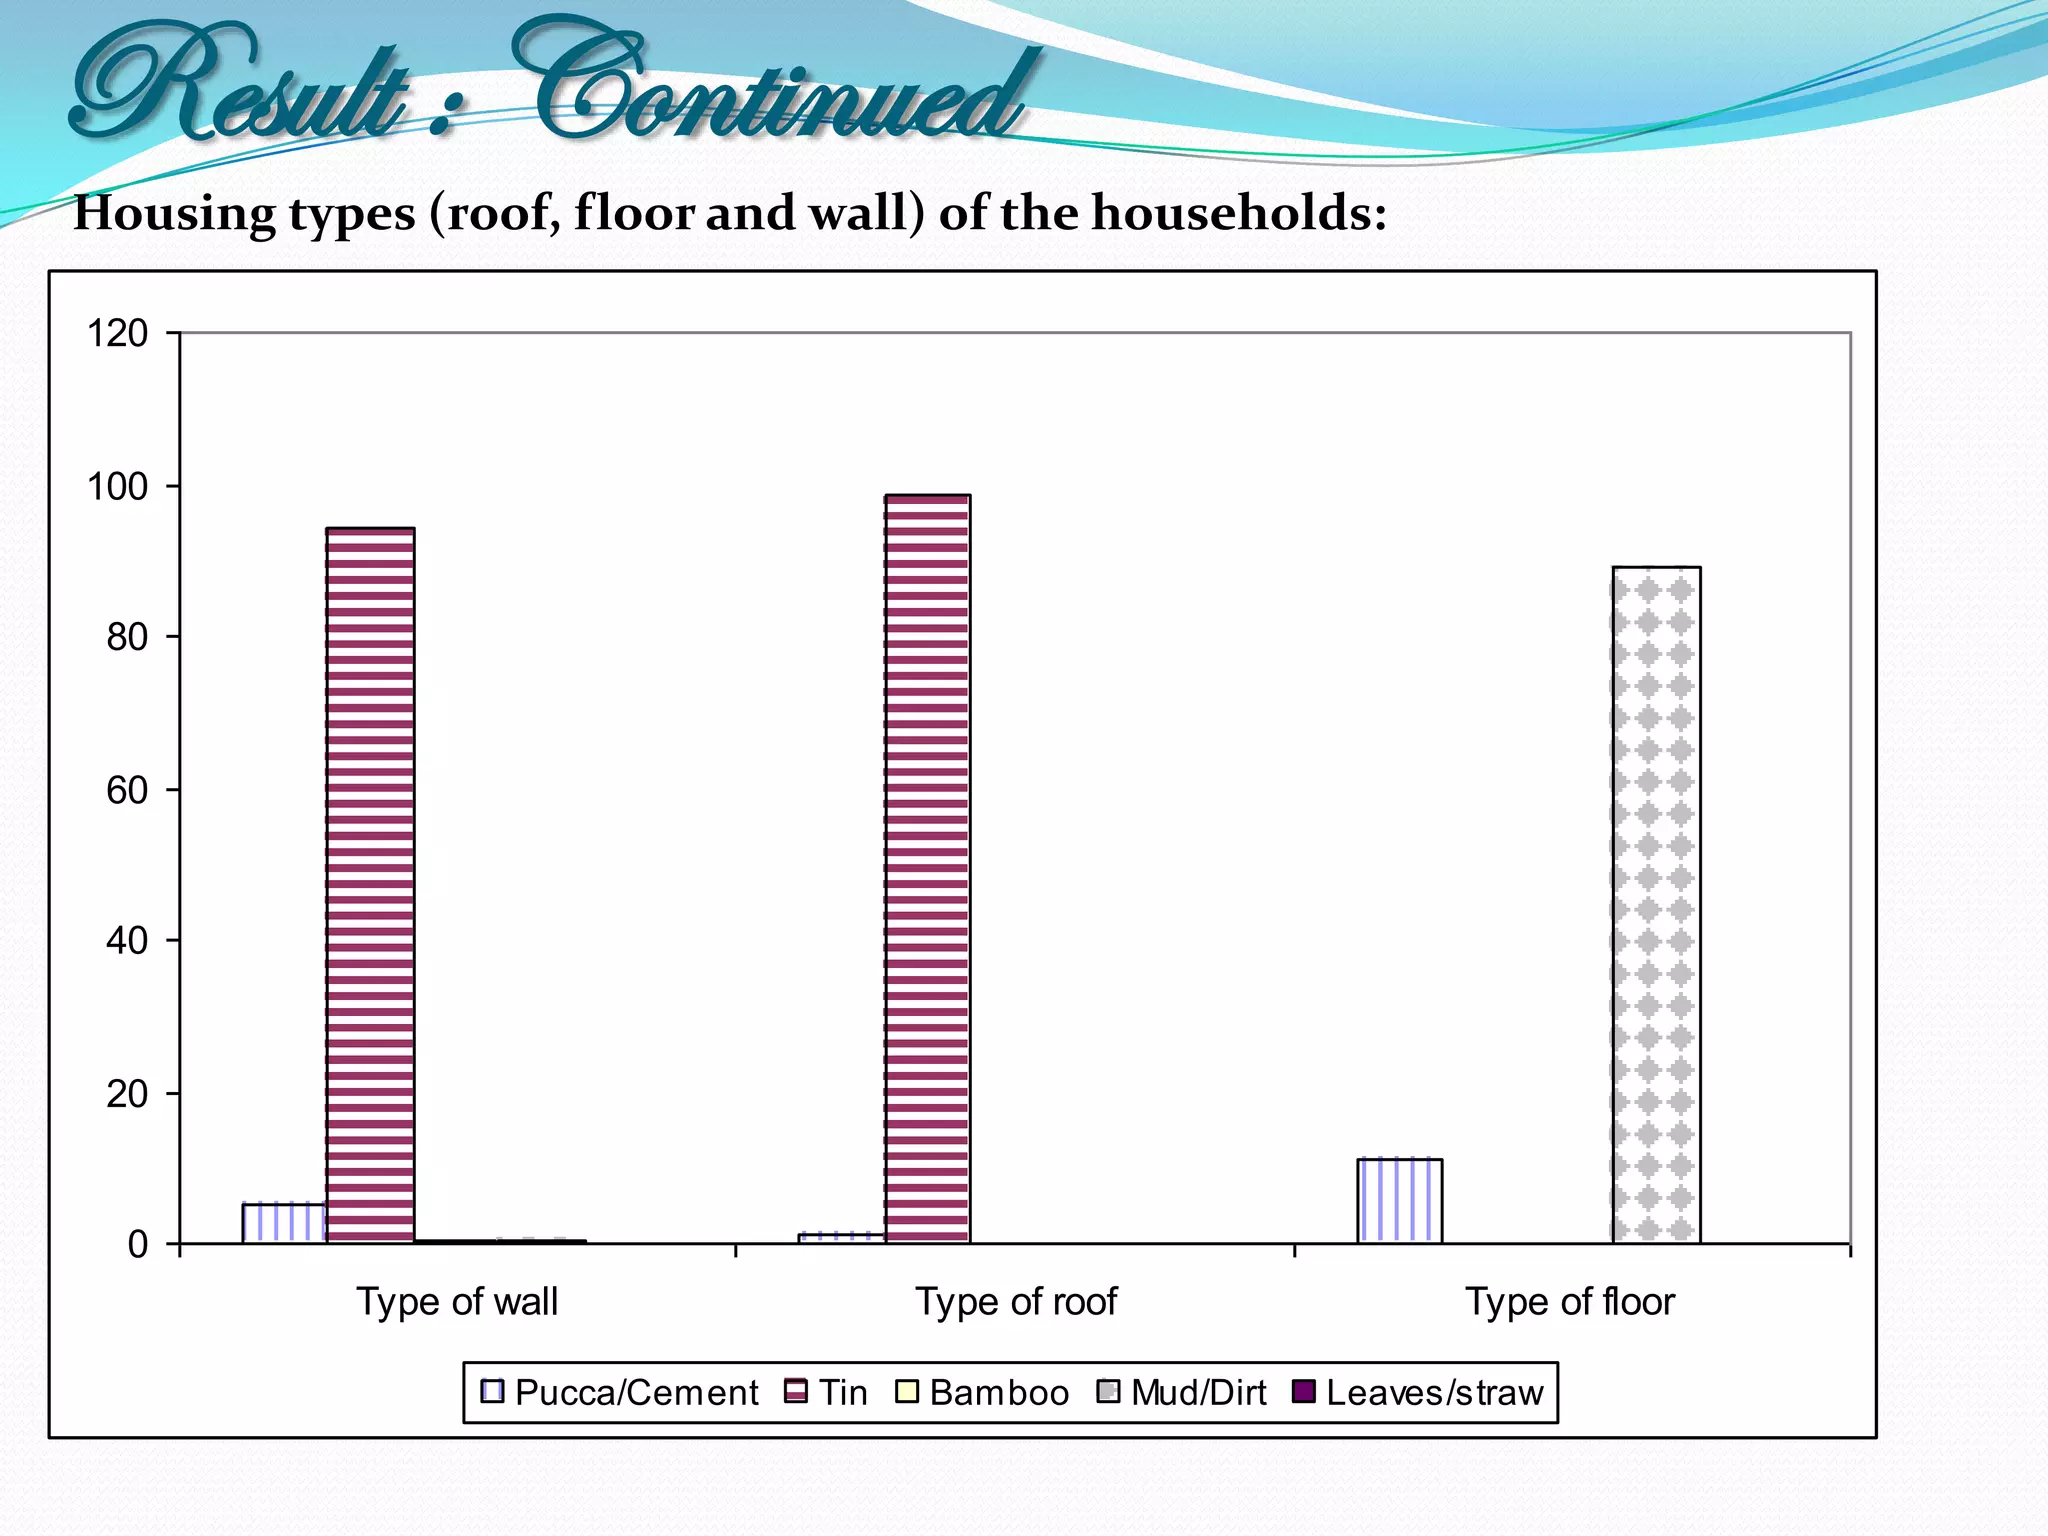
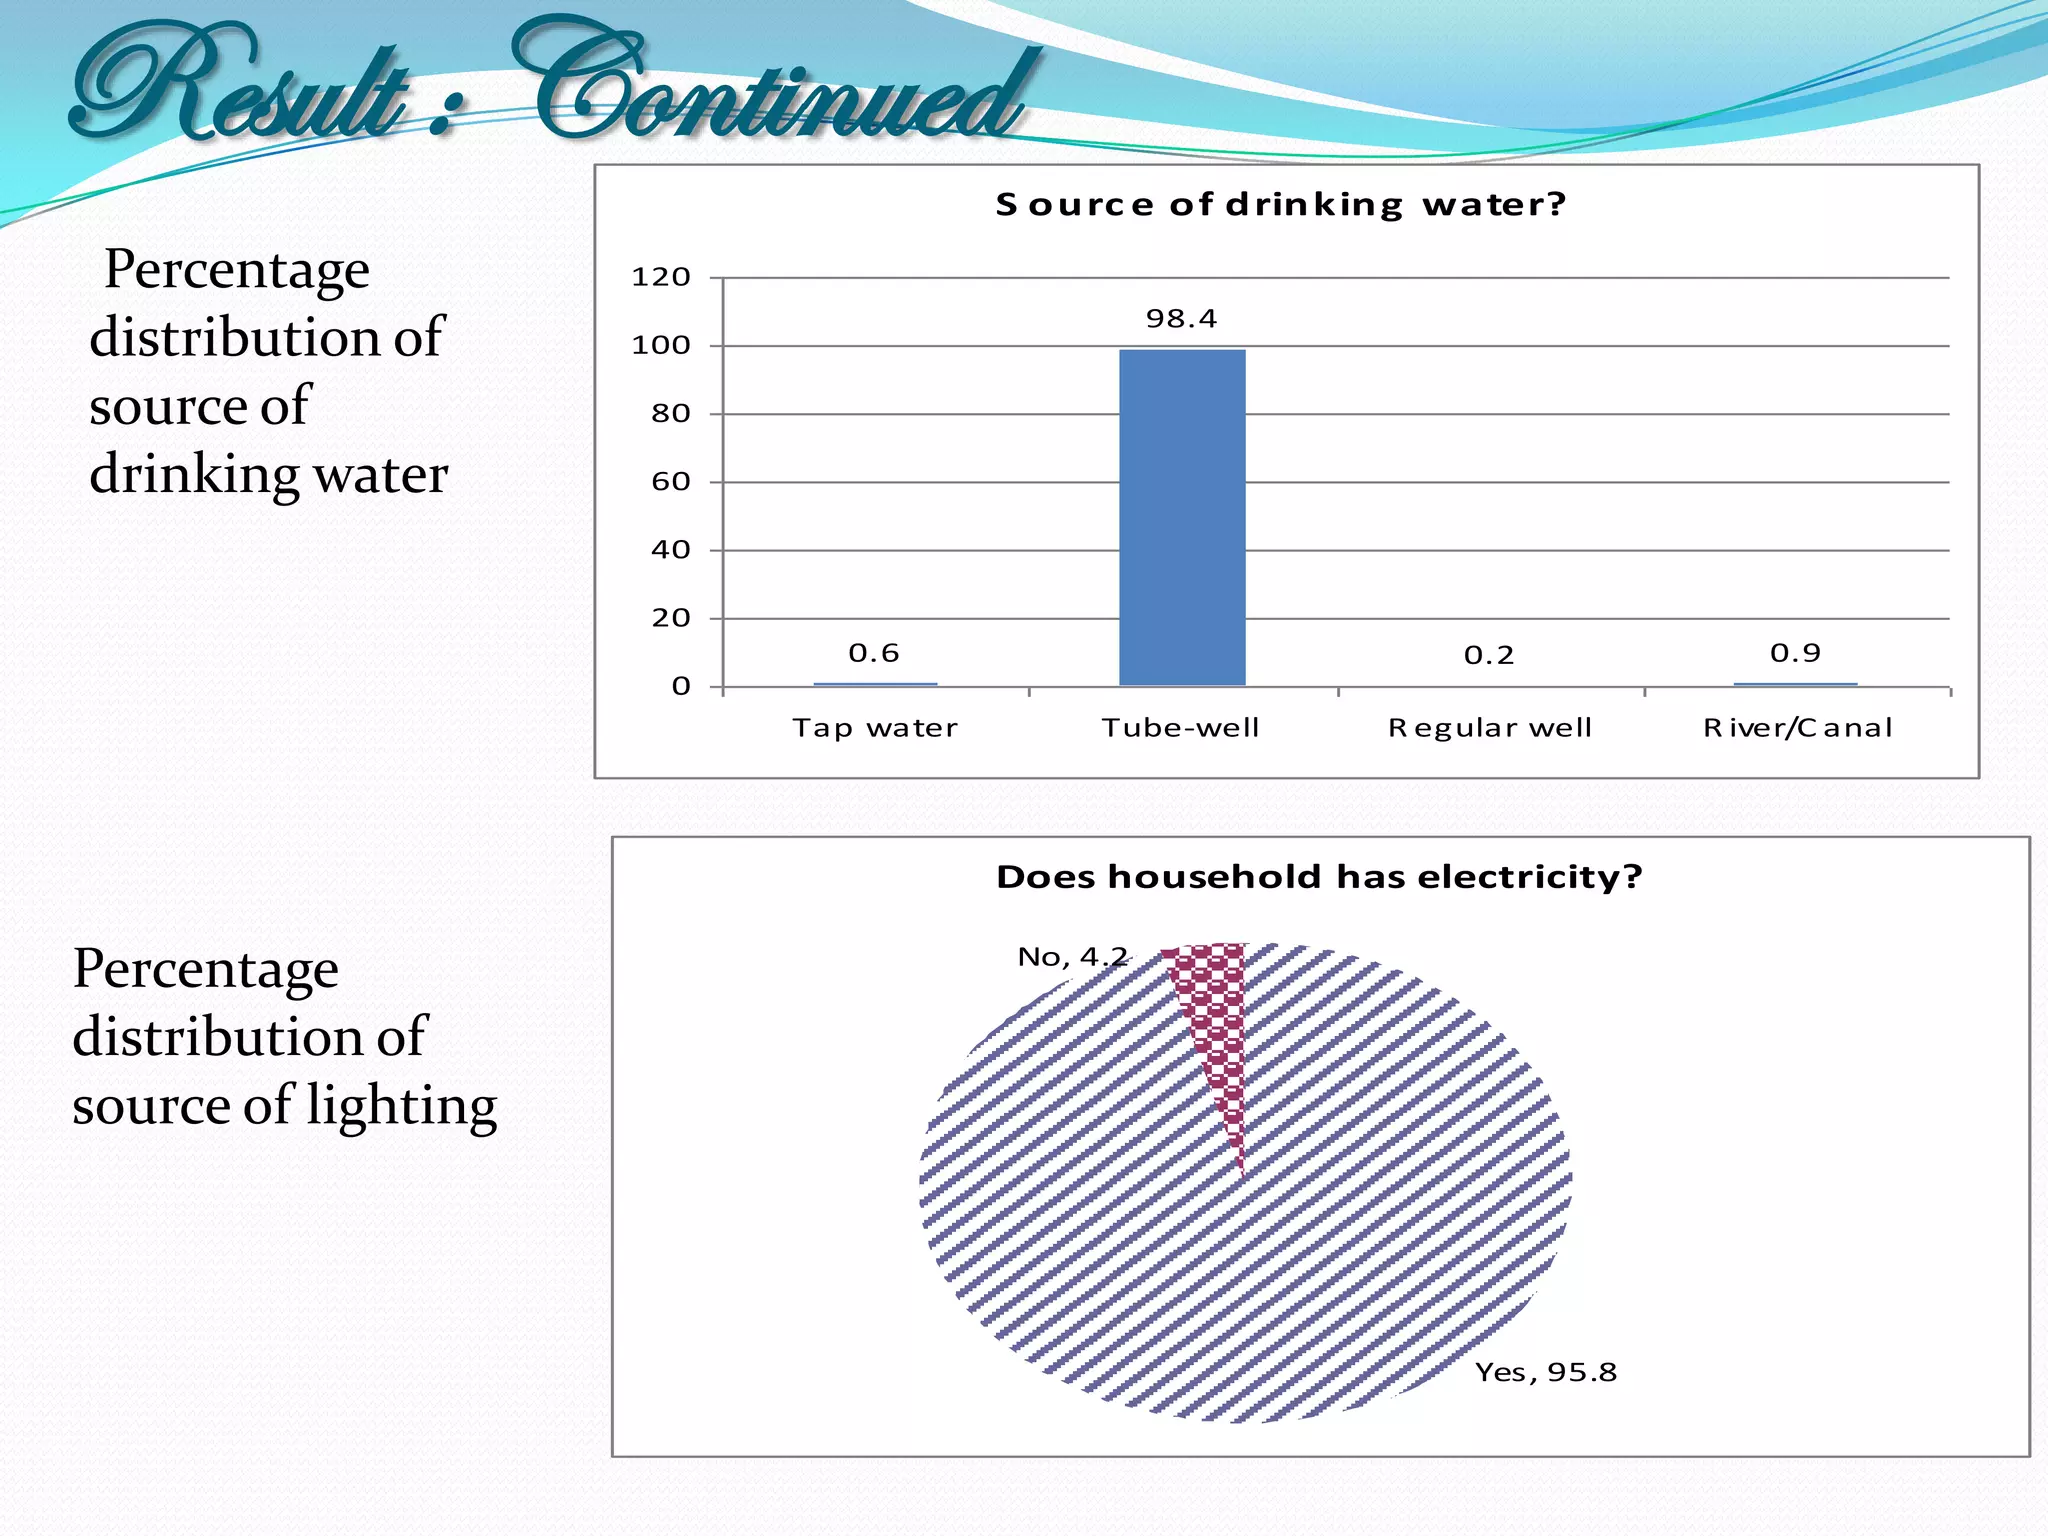
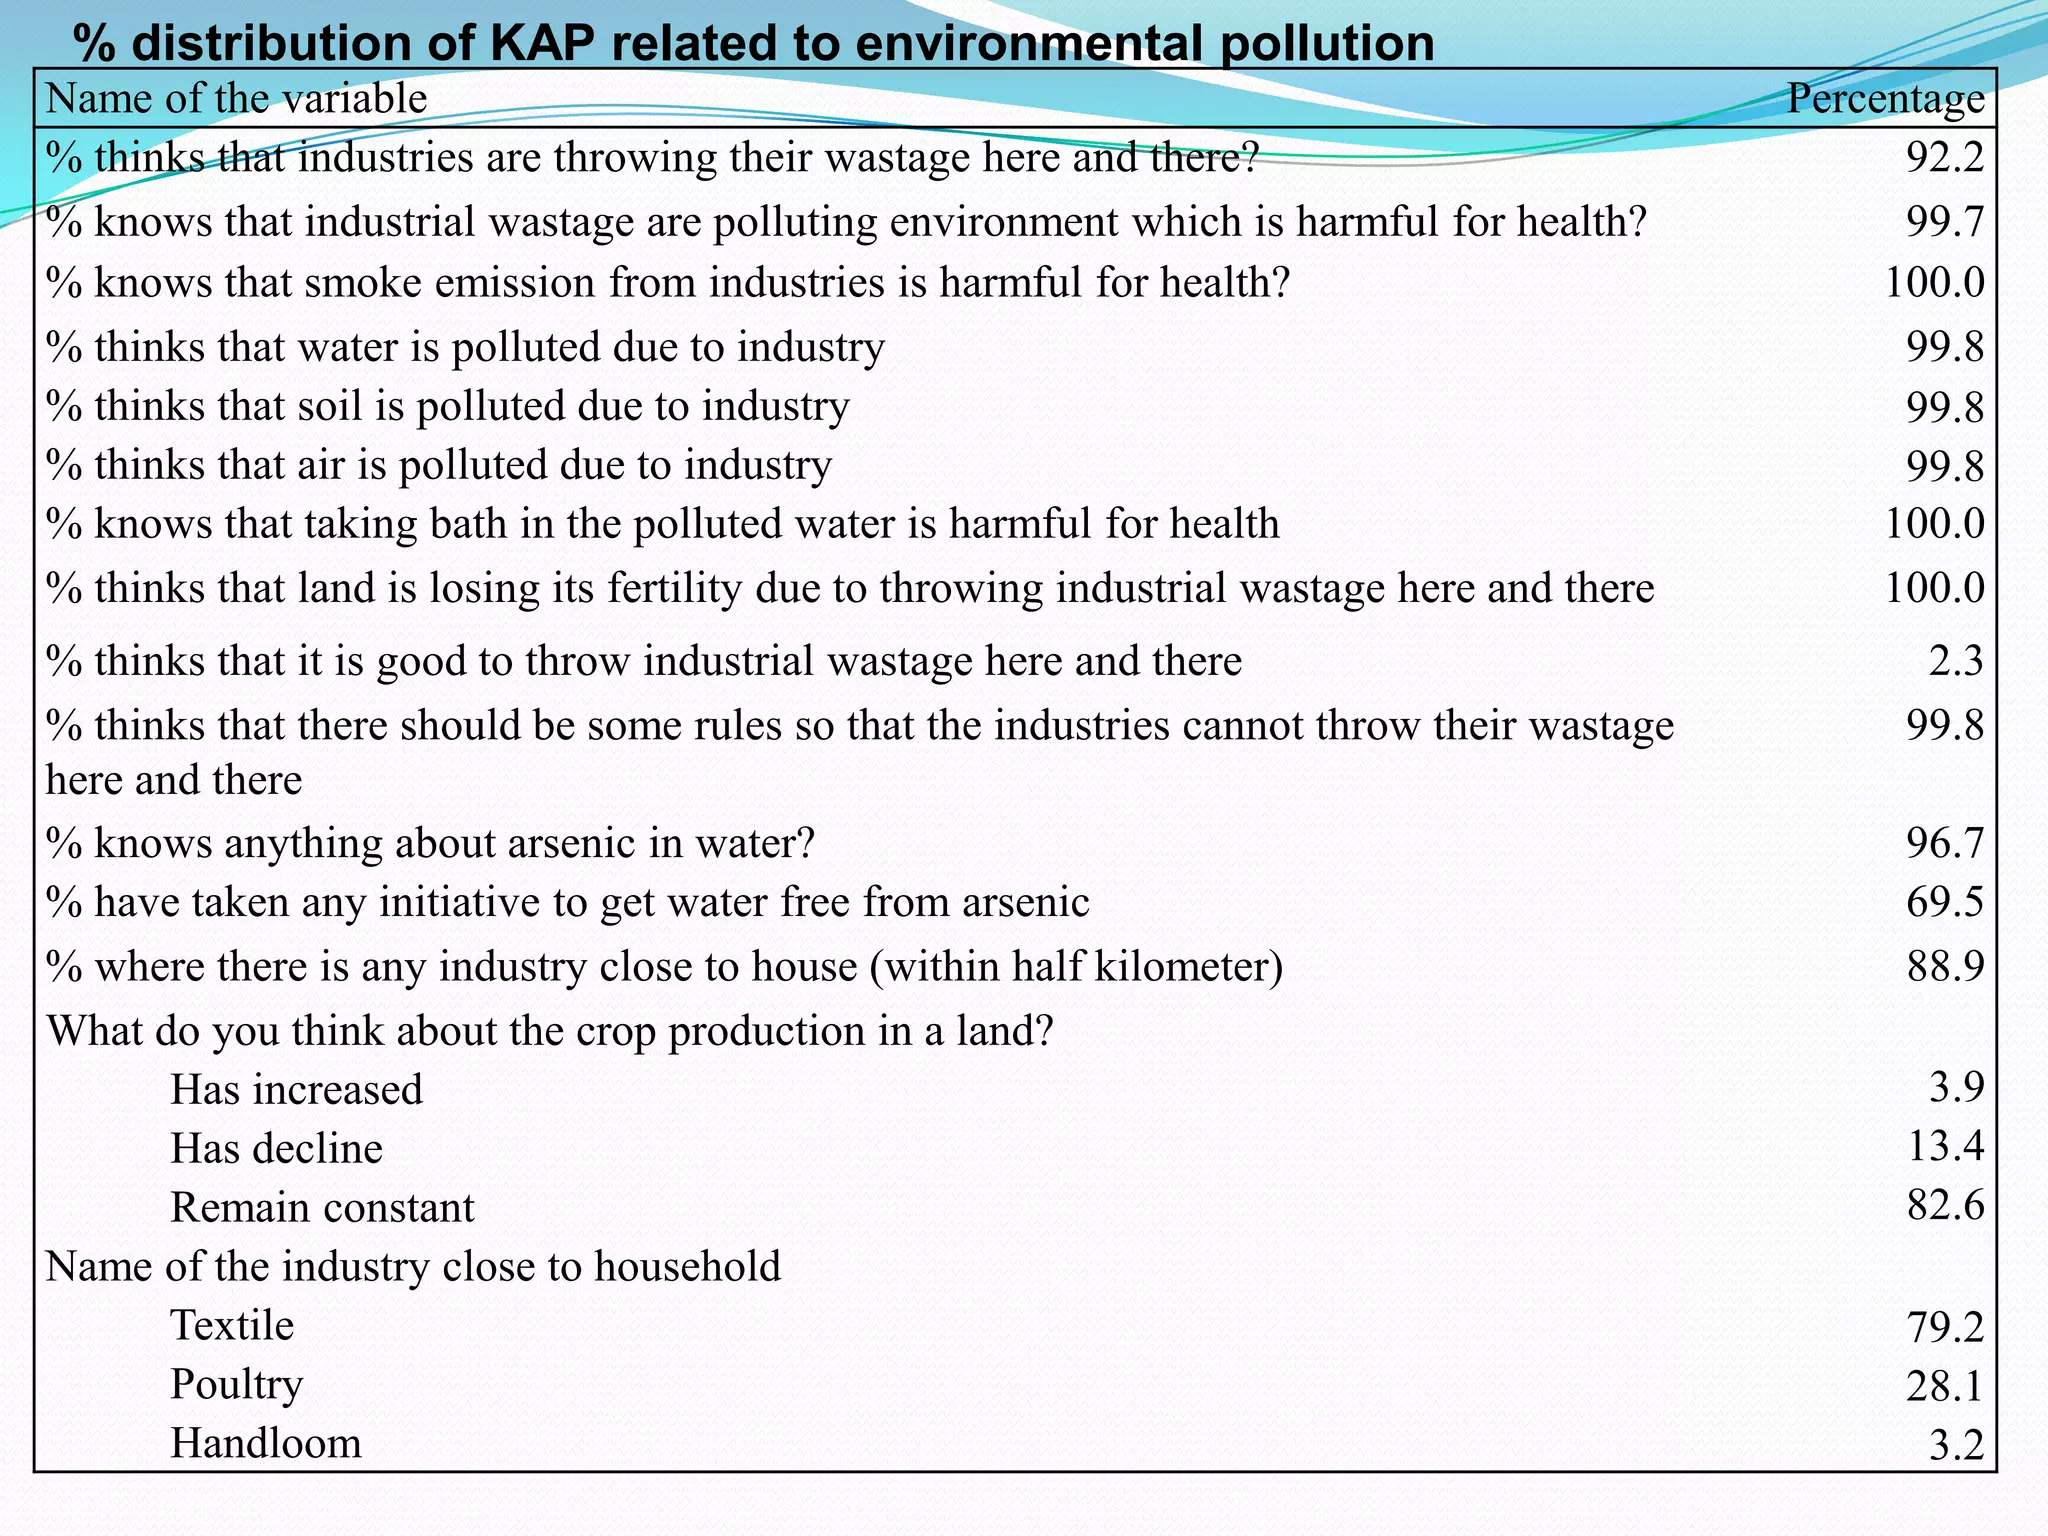
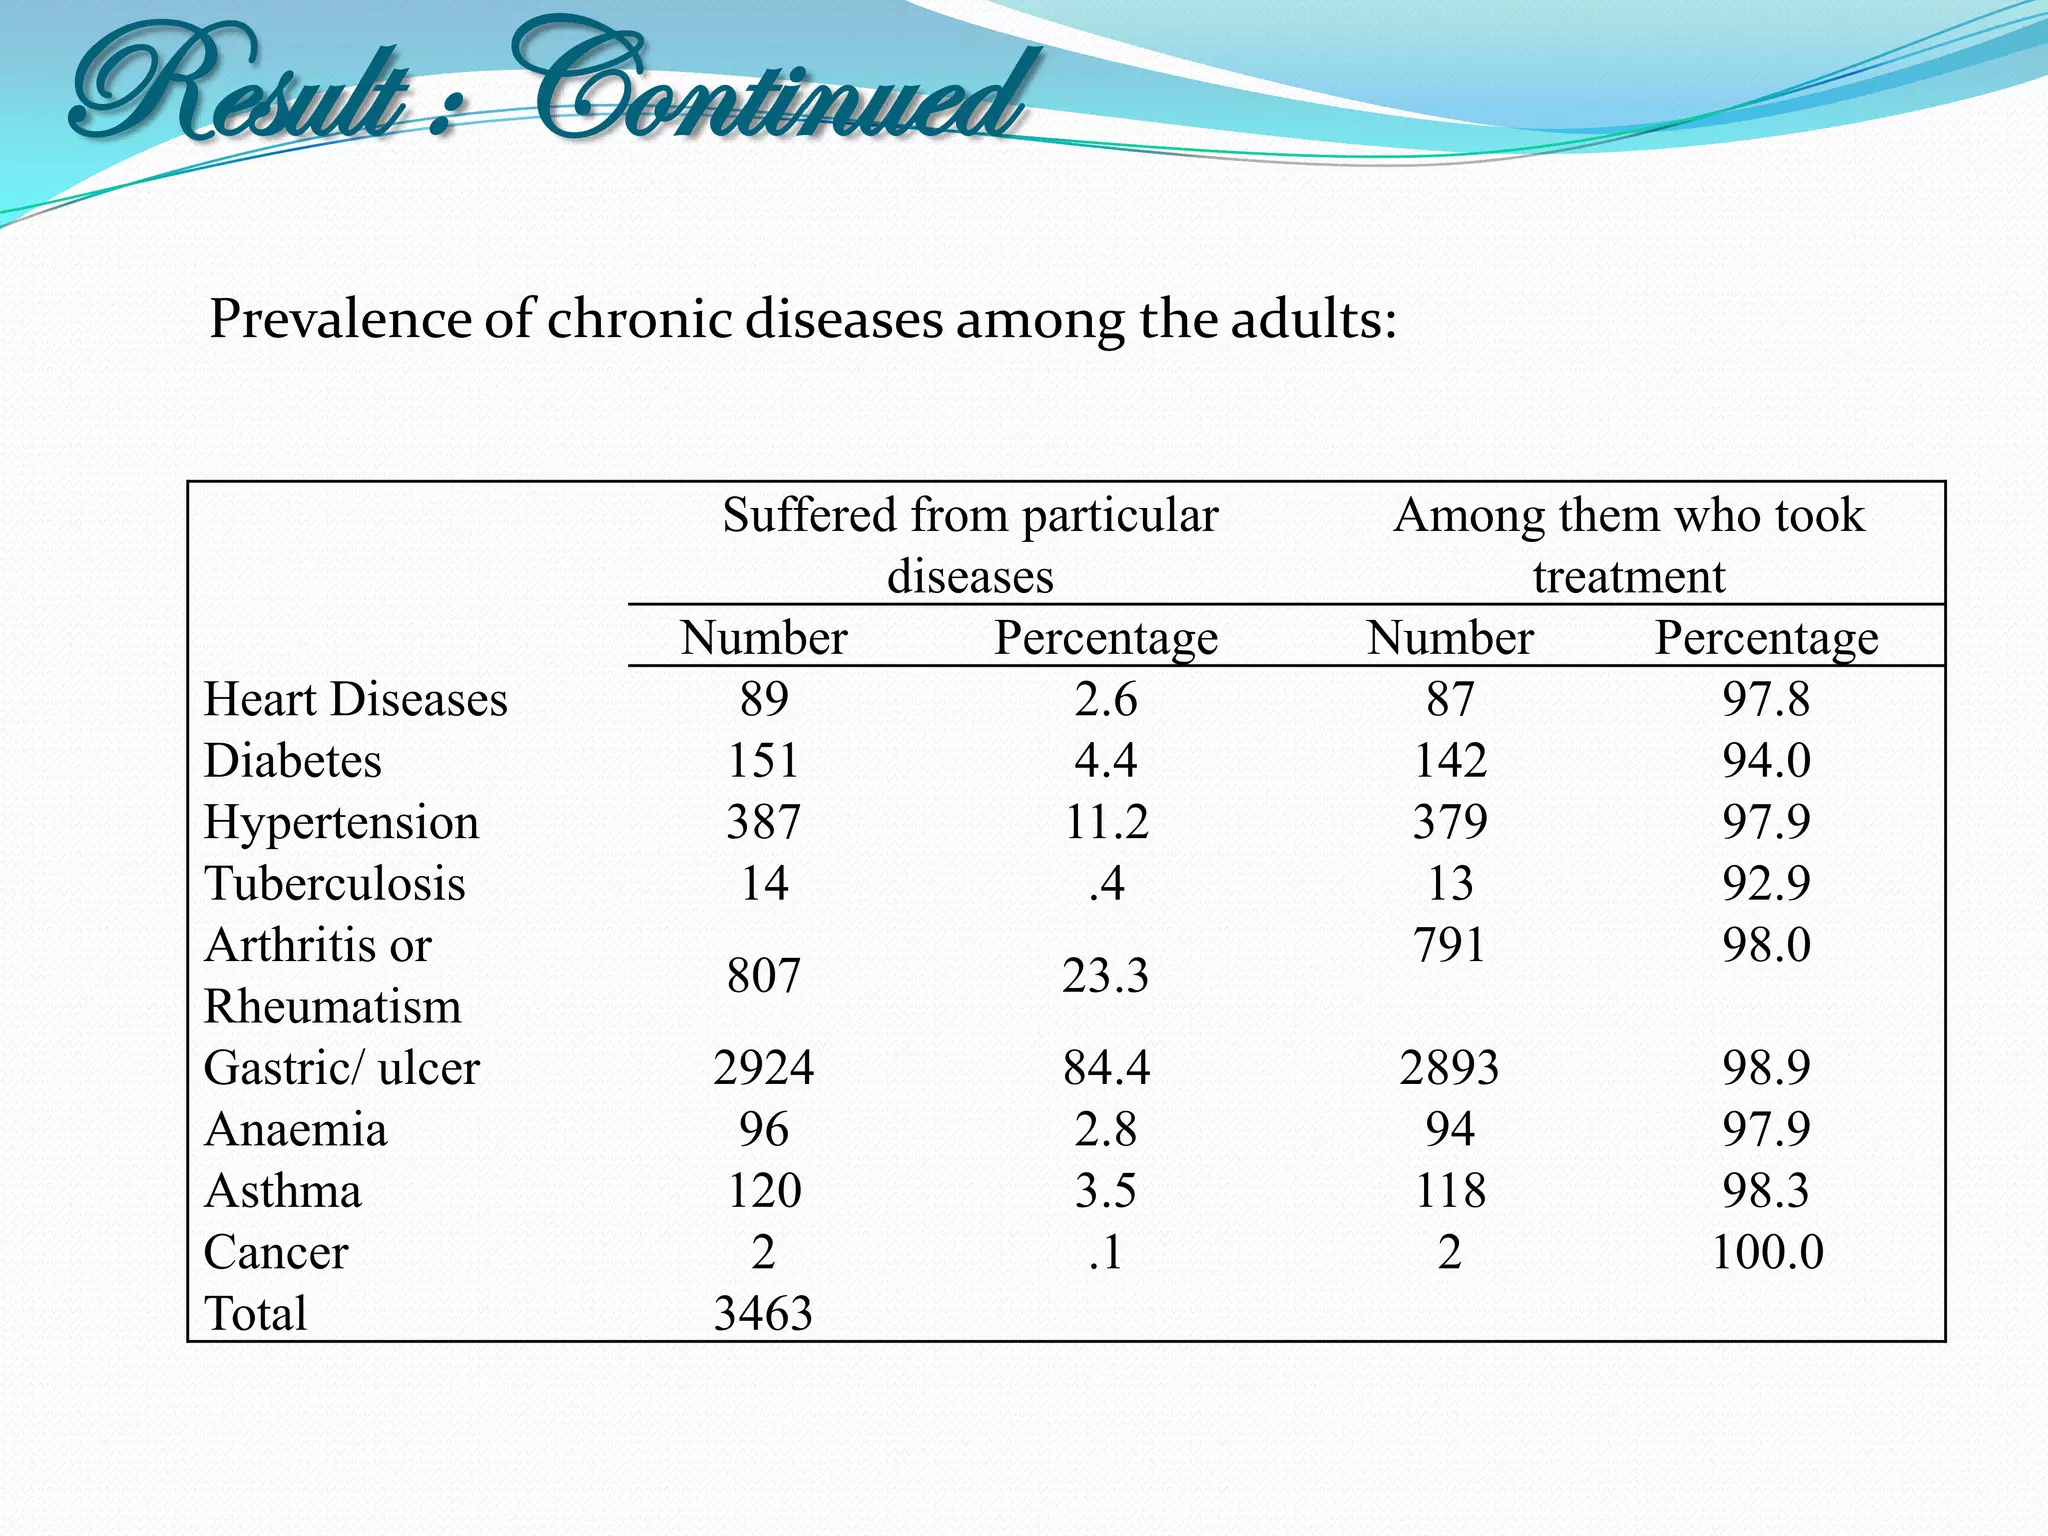
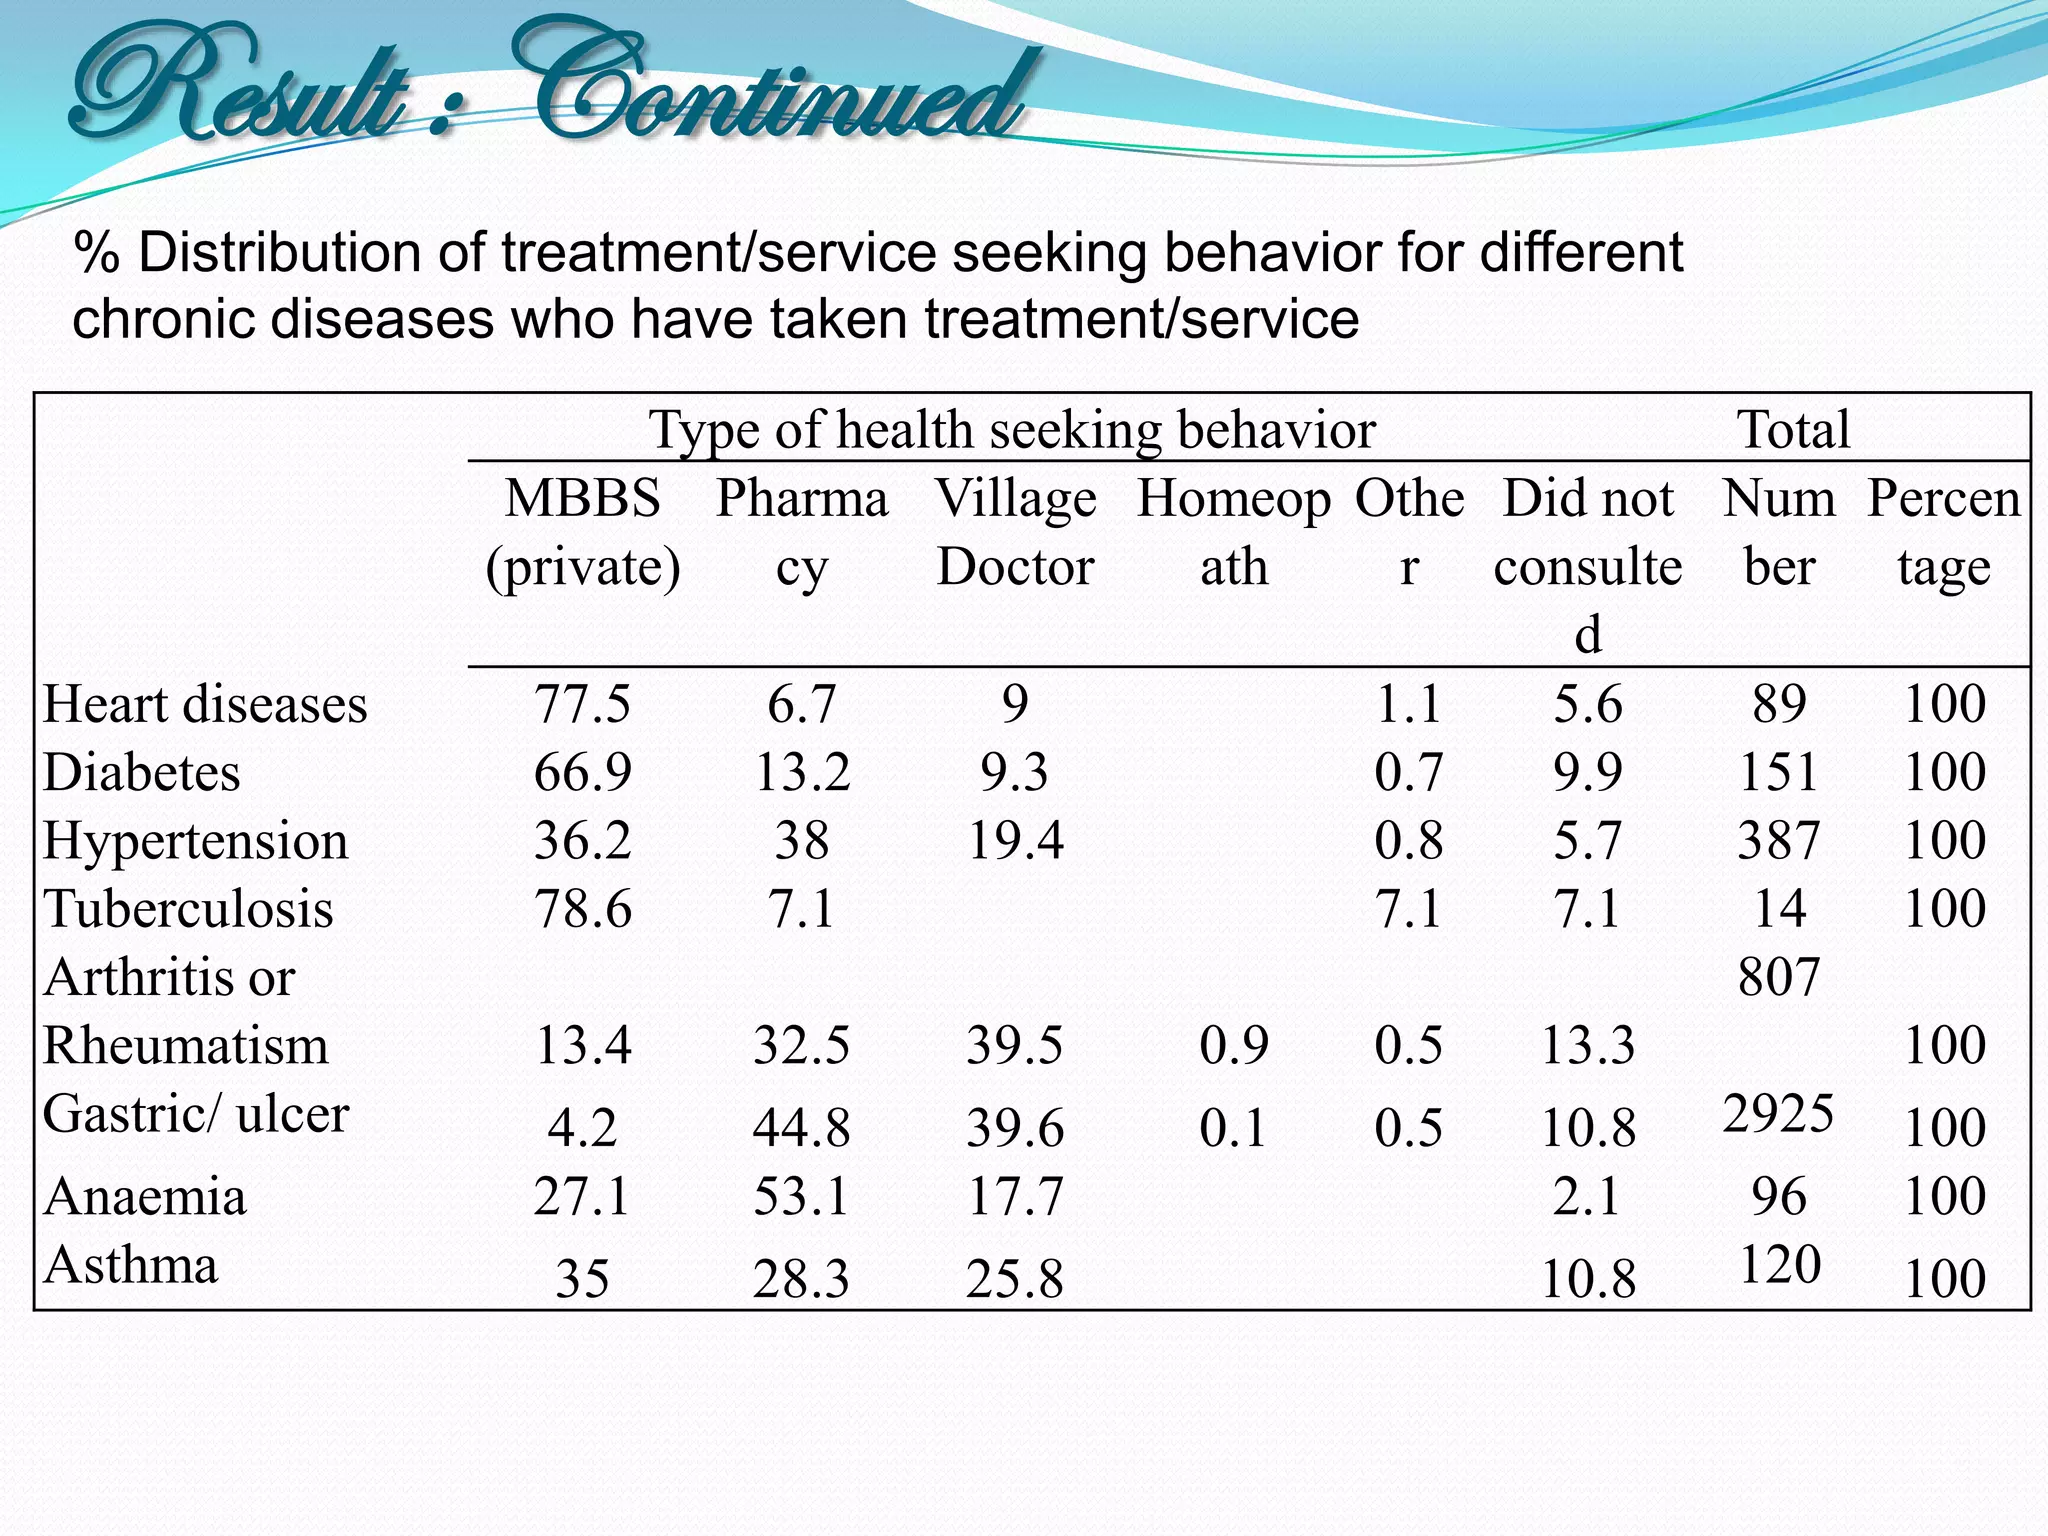
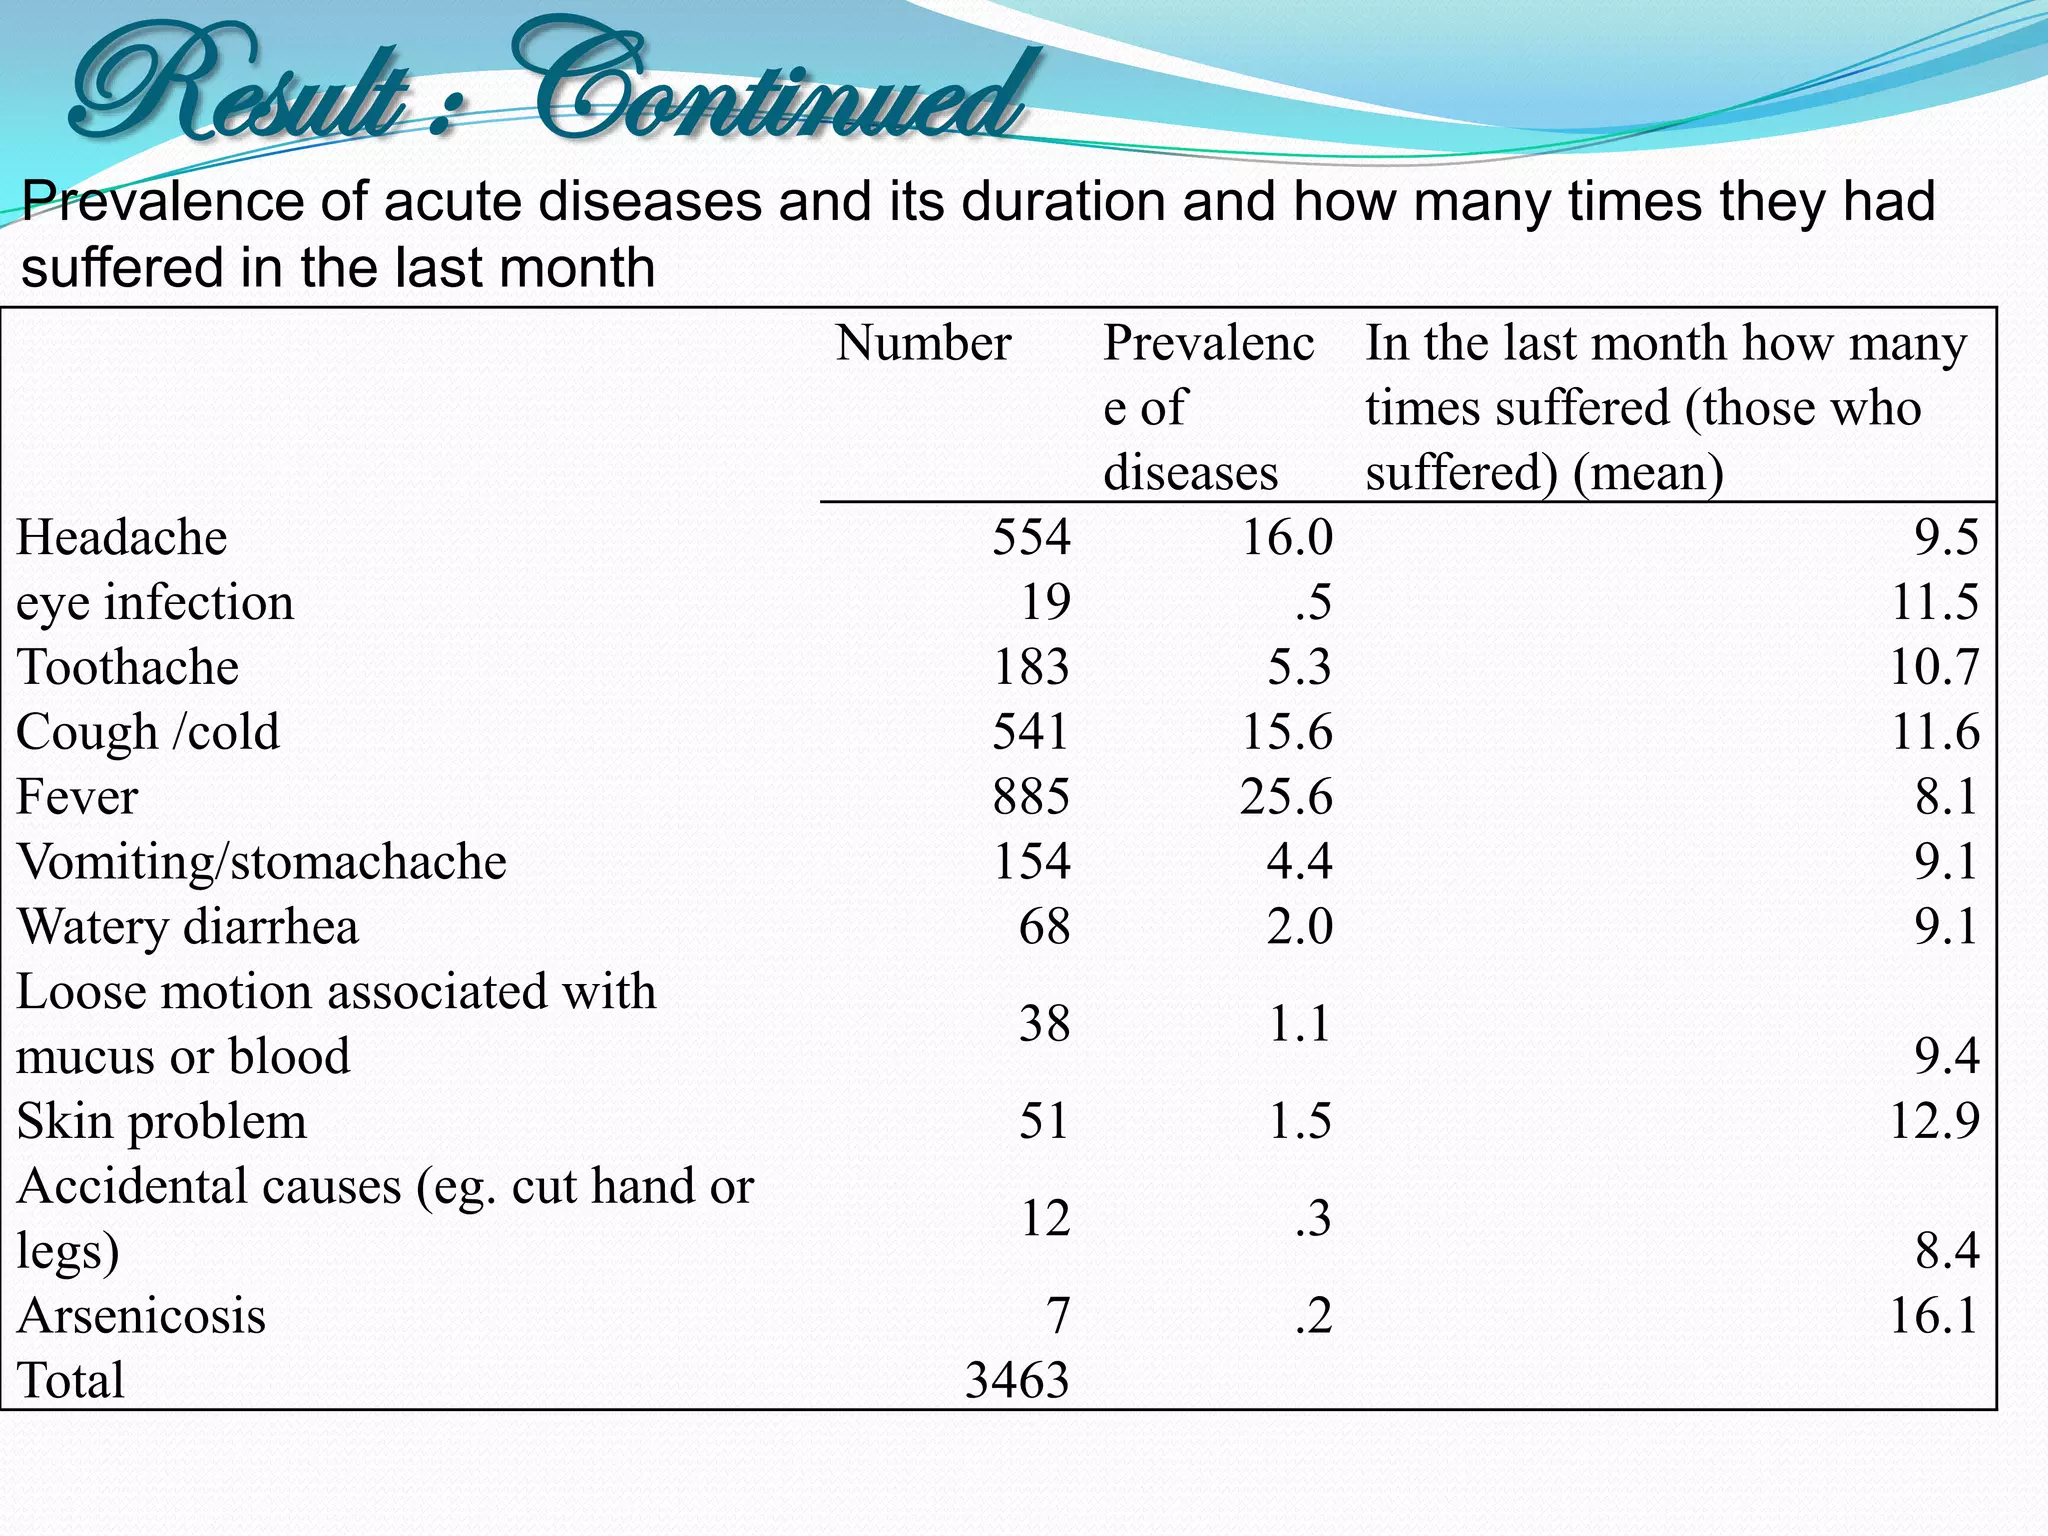
SlideShare a Scribd company logo
Roadmap of the study
  Background
  Objective
  Data and Methodology
  Result and finding
  Conclusion
  Recommendation
Background
Rapid and unplanned industrialization and urbanization has
severely polluted the environmental resources especially
air, water and soil arena

Our farmers are using excess fertilizer, pesticide in their lands
in order to increase crops production. It has tremendous impact
on our environment, destroying eco system.
Background
The number of industry units at Narayanganj, as recorded
by the Bangladesh Bureau of Statistics, is 2,409

Food, beverage and tobacco - 377
Jute, cotton, textile and leather - 1,320
Wood products – 49
Pulp and paper products – 30
Chemicals – 104
Non-metallic products – 170
Basic metal products – 101
Fabricated metal, machinery and equipment – 230
Other manufacturing - 28.
Background
 There are over 300 various effluent discharge outlets
from nine major industrial clusters including
Narayanganj
Of these, 19 outlets carry the major discharge of
domestic and industrial waste
Of the discharged untreated liquid waste, 61% are
industrial and 39% domestic waste
The lone Sewerage Treatment Plant (SWP) in Pagla in
Narayanganj can treat only 10% of the industrial waste.
It is estimated that there are over 7,000 industries in
Dhaka metropolis located mostly in three clusters --
Hazaribagh, Tejgaon and DND (Narayanganj) area
Background
A chemical oxygen demand (COD) test, carried out by
BUET, showed that the level of pollutants in the
Shitalakhya River was 28 to 128 mg, much higher than
the normal range between 4-12mg

At present in the river Buriganga contains 60 times higher
chromium than the permissible limit

Water arsenic concentrations in Araihazar were found to
range from 0.094 to 790 mg/L, WHO permissible limit
being 0.01 mg/L.
Background
Environmental factors account for as much as 22% of the
national burden of disease, principally in the form of
respiratory infections and diarrhoeal disease

However, people have little knowledge about the impact
of industrialization on environmental pollution and
human health.
Araihazar: at a glance
Area:                   183.35 sq km
Union parishads:        12
Mouzas:                 182
Villages:               315
Population: 299,855; Muslims 96.08%, Hindu
3.76%, others .16%
Religious institutions: Mosque 355, temple 7
Literacy: Average literacy 23.6%; male 28.6% and
female 17%
Araihazar: at a glance
Educational institutions: College 4, secondary school 17, primary
school 114, community school 11, satellite school 7, madrasa
36, maktab 460
Cultural organizations: Public library 1, club 65, cinema hall
3, community centre 8, playground 25
Main occupations: Agriculture 24.68%, fishing 1.65%, agricultural
labourer 10.96%, wage labourer 8.53%, commerce
14.45%, service 3.84%, weaving 20.73%, industry 1.57% and
others 13.59%
 Main crops:
Paddy, jute, wheat, corn, potato, kalai, sesame, mustard, vegetabl
es. Pan cultivation, which was once quite extensive, is now almost
extinct
 Health centre: Hospital 1, family welfare centre 4, union family
welfare centre 7
Objectives
The objectives are

1. To identify the socio-economic and demographic status of
the inhabitants in an industrial semi urban area of Bangladesh
(Araihazar upazila of Narayangang)

2. To identify the lacking of people’s knowledge about
air, water and soil pollution

3. The prevalence of morbidities related to air, water and soil
pollution among the study participants.
Methodology
 This is a cross sectional study

 Study was conducted in Araihazar (a Peri Urban setting) in
 Bangladesh

 Both quantitative and qualitative method was applied in
 this study to collect information
Methodology: Quantitative study
 Sample size:
 The formula used for these calculations is:


 (Ref: Krejcie and Morgan. 1970. “Determining Sample
 Size for Research Activities” (Educational and
 Psychological Measurement, #30, pp. 607-610))
Methodology: Quantitative study
 Using this Standard formula, the required sample for
 Araihazar Upazilla is 1511 (Household 90,000, α = .05, ME =
 0.025, P = 0.5). Increasing the sample size 20% in order to
 reduce the non response error, the sample size is 1813

 3 village was randomly selected (probability proportion to
 HH size in each village). So from 12 unions, 36 village was
 selected

 50 HH from each village was randomly selected

 Total HH size is 50 X 12 X 3 = 1800 HH
Methodology: Quantitative study
 Pre structured questionnaire was used to collect the information

 Questionnaire was tested in Gazipur before final print
 Both HH and adult questionnaire was in Bengali

 1 supervisor and 10 interviewer was appointed for data collection

 Extensive training (in house and field) was provided to the
 supervisor and interviewer

 When the investigator though that the team is ready for interview,
 they was sent for data collection
Methodology: Qualitative study
 Focus Group Discussion (FGD) method used to collect
 information
 One village was randomly selected from each union. Total 12
 FGD was conducted
 Structured guideline was followed for FGD
 6 skilled person was appointed for FGD
 FGD was conducted in the village in their convenient times
 Each FGD took around two hour
 Each FGD was recorded in tap recorder
 Finally information was analyzed
Result
Age and gender wise distribution of population (Population Pyramid)


                                              70+

                                            65-69

                                            60-64

                                            55-59

                                            50-54

                                            45-49

                                            40-44

                                            35-39

                                            30-34

                                            25-29

                                            20-24

                                            15-19

                                            10-14

                                              5-9

                                              0-4

      -20       -15       -10       -5              0          5   10   15

                                         Fem ale        Male
Result : Continued
Literate population 18 years and over by level of education by gender
                              Frequency                      Percentage
                                          Total                             Total
                      Male    Female                Male     Female
  Never attended      1061     1347       2408      43.0      51.3          47.3
  school
  Primary              307     290        597       12.5       11.0         11.7
  High School          892     852        1744      36.2      32.4         34.2
  SSC/HSC              181     135        316        7.3        5.1          6.2
  Higher               24       3          27        1.0        .1           .5
  Total               2465     2627       5092      100.0     100.0        100.0
Literate population age 6-17 years according to their education level by gender

                              Frequency                      Percentage
                     Male     Female      Total     Male     Female         Total
 Never attended     161      105        266       12.1      8.6         10.4
 school
 Primary            776      669        1445      58.2      55.0        56.7
 High School        373      414        787       28.0      34.0        30.9
 SSC or Higher      24       28         52        1.8       2.3         2.0
 Total              1334     1216       2550      100.0     100.0       100.0
Result : Continued
 Marital status of the respondents of age 18+ by gender

                                 Frequency                       Percentage
                            Male Female      Total     Male       Female    Total
Never married                534   154       688       21.6         5.9      13.5
Currently married           1894   2104      3998      76.7        80.0      78.4
Separate/                     1     17        18        .0          .6        .4
Divorced                      5     15        20        .2          .6        .4
Widow/ Widower               36    340       376        1.5        12.9      7.4
Total                       2470   2630      5100      100.0       100.0    100.0

Marital status of the respondents of age 6-17 by gender

                               Frequency                       Percentage
                          Male Female      Total     Male       Female    Total
Never married             1334   1204      2538      100.0        99.0     99.5
Currently married           0     10        10         --          .8       .4
Divorced                    0     2          2         --          .2       .1
Total                     1334   1216      2550      100.0       100.0    100.0
Result : Continued
Occupation of the adult (age 18+) by gender

                                Frequency                   Percentage
                         Male    Female     Total   Male    Female       Total
Agriculture worker       388         9      397     15.7       .3         7.8
Unskilled job            185        33      218      7.5      1.3         4.3
Small business man       508        10      518     20.6       .4        10.2
Transport Worker         202         0      202      8.2                  4.0
Loom worker              616        13      629     24.9       .5        12.3
Student                   78        76      154      3.2      2.9         3.0
Searching job, no work
or retired               209      151       360      8.5      5.7         7.1

Job                      217       62       279      8.8       2.4         5.5
Housewife                 --      2264      2264      --      86.1        44.4
Other                     67       12        79      2.7        .5         1.5
Total                    2470     2630      5100    100.0    100.0       100.0
Result : Continued
Housing types (roof, floor and wall) of the households:

120


100


 80


 60


 40


 20


  0
           Type of wall                  Type of roof                     Type of floor

                    Pucca/Cement   Tin   Bamboo         Mud/Dirt   Leaves/straw
Result : Continued                     S o u rc e o f d rin k in g water?

 Percentage          120
                                                  98.4
distribution of      100

source of             80

drinking water        60

                      40

                      20
                              0.6                                 0.2              0.9
                       0
                           Tap water         Tube-well        R egular well    R iver/C anal


                                       Does household has electricity?

Percentage                              No, 4.2


distribution of
source of lighting


                                                                   Yes, 95.8
Result : Continued
                                                            Type of fuel used for cooking

                           70
Percentage distribution    60
of type of fuel used for   50
cooking?                   40

                           30
                           20

                           10
                           0


                                   l


                                                                                                    g
                                                                                       p
                                                                   d
                                                    .


                                                                                                                    ss
                                 oa


                                                 as


                                                                                                  un
                                                                                     ro
                                                                 oo


                                                                                                                 ra
                                C


                                                G


                                                                                   /c


                                                                                                  D
                                                                W


                                                                                                                G
                                                                                 re


                                                                                               al
                                                                                tu


                                                                                              m
                                                                             ul


                                                                                           ni
                                                                            ic


                                                                                           A
                                                                          gr
                                                                         A
                                                                  Cooking place
                                                          Both, 10.8


Percentage
distribution of place of
                                       Outside the house,
cooking                                       27.4

                                                                                               Inside house, 61.8


                                                        Inside house   Outside the house   Both
Result : Continued                   Household monthly income

30


25


20


15


10


 5


 0
        0-6000               6001-8000          8001-10000             10001-12000             12000+


70


60


50                                           Percentage distribution of household by type
40
                                             of toilet facilities for different age group:
30


20


10


 0
      Septic tank /          Slab latrine        Pit latrine       Open latrine, Bush /   Hanging latrine
     Modern latrine                                                       Field

                      Adult (age>15 years)   Child (age<5 years)       Child (age>5 but <15)
Result : Continued
Percentage distribution of household members of Araihazar Upazila who wear a
sandal in the toilet
    83
    82
    81
    80
    79
    78
    77
    76
    75
    74
    73
           Adult (age>15 years)              Child (age<5 years)             Child (age>5 but <15)


   70

   60                                              Percentage distribution of household
   50
                                                   members (at different age group) who
                                                   wash their hands after visiting toilet
   40

   30

   20

   10

    0
           All the time             Sometimes               Not very often              Never

                     Adult (age>15 years )   Child (age<5 years )    Child (age>5 but <15)
Result : Continued
60


50
                    Percentage distribution of household
                    members about what they use to wash
40
                    their hands after going to toilet
30


20


10


 0
     Soap                      Ash                          Soil                    Only water

            Adult (age>15 years )    Child (age<5 years )          Child (age>5 but <15)
% distribution of KAP related to environmental pollution
Name of the variable                                                                           Percentage
% thinks that industries are throwing their wastage here and there?                                  92.2
% knows that industrial wastage are polluting environment which is harmful for health?               99.7
% knows that smoke emission from industries is harmful for health?                                  100.0
% thinks that water is polluted due to industry                                                      99.8
% thinks that soil is polluted due to industry                                                       99.8
% thinks that air is polluted due to industry                                                        99.8
% knows that taking bath in the polluted water is harmful for health                                100.0
% thinks that land is losing its fertility due to throwing industrial wastage here and there        100.0
% thinks that it is good to throw industrial wastage here and there                                  2.3
% thinks that there should be some rules so that the industries cannot throw their wastage          99.8
here and there
% knows anything about arsenic in water?                                                            96.7
% have taken any initiative to get water free from arsenic                                          69.5
% where there is any industry close to house (within half kilometer)                                88.9
What do you think about the crop production in a land?
       Has increased                                                                                 3.9
       Has decline                                                                                  13.4
       Remain constant                                                                              82.6
Name of the industry close to household
       Textile                                                                                      79.2
       Poultry                                                                                      28.1
       Handloom                                                                                      3.2
Result : Continued
  Prevalence of chronic diseases among the adults:


                      Suffered from particular    Among them who took
                              diseases                 treatment
                     Number        Percentage    Number      Percentage
  Heart Diseases       89              2.6          87          97.8
  Diabetes            151              4.4         142          94.0
  Hypertension        387              11.2        379          97.9
  Tuberculosis         14               .4          13          92.9
  Arthritis or                                     791          98.0
                       807            23.3
  Rheumatism
  Gastric/ ulcer      2924            84.4           2893      98.9
  Anaemia              96             2.8              94      97.9
  Asthma              120             3.5             118      98.3
  Cancer               2               .1              2       100.0
  Total               3463
Result : Continued
 % Distribution of treatment/service seeking behavior for different
 chronic diseases who have taken treatment/service
                        Type of health seeking behavior               Total
                  MBBS Pharma Village Homeop Othe Did not             Num Percen
                 (private)   cy     Doctor      ath     r consulte    ber tage
                                                             d
Heart diseases     77.5      6.7        9              1.1  5.6       89     100
Diabetes           66.9     13.2       9.3             0.7  9.9       151    100
Hypertension       36.2      38       19.4             0.8  5.7       387    100
Tuberculosis       78.6      7.1                       7.1  7.1       14     100
Arthritis or                                                          807
Rheumatism         13.4     32.5     39.5      0.9    0.5    13.3            100
Gastric/ ulcer      4.2     44.8     39.6      0.1    0.5    10.8     2925   100
Anaemia            27.1     53.1     17.7                     2.1      96    100
Asthma              35      28.3     25.8                    10.8      120   100
Result : Continued
Prevalence of acute diseases and its duration and how many times they had
suffered in the last month
                                     Number        Prevalenc In the last month how many
                                                   e of        times suffered (those who
                                                   diseases    suffered) (mean)
Headache                                  554            16.0                           9.5
eye infection                              19               .5                         11.5
Toothache                                 183             5.3                          10.7
Cough /cold                               541            15.6                          11.6
Fever                                     885            25.6                           8.1
Vomiting/stomachache                      154             4.4                           9.1
Watery diarrhea                            68             2.0                           9.1
Loose motion associated with
                                              38          1.1
mucus or blood                                                                         9.4
Skin problem                                  51          1.5                         12.9
Accidental causes (eg. cut hand or
                                              12           .3
legs)                                                                                  8.4
Arsenicosis                                 7              .2                         16.1
Total                                    3463
Conclusion
 Industries has increased in this study area including textile mills, power
 loom factory, handloom, sizing factory, spinning mill, cotton mill, dyeing
 factories, brick field and so on

 Almost all Inhabitants think that industries are polluting their air, water
 and soil

 Burning industrial waste materials, smoke from different industries and
 cooking are the main reasons for air pollution

 This has also important implications for the health of population in that
 area
 People keep dusts from animal farms (poultry/cow), waste materials from
 industries (dyeing, textile, etc.) and household wastages here and there

 Besides use of chemical fertilizers; pesticides has reduced productivity of
 lands in their area
Conclusion
 In some cases industrial wastages (e.g. dyeing factories) are drained
 out in river sometimes household wastages are thrown in spoiled
 ponds, although knowing that it’s not a good practice

 Besides irrigation project, fertilizers get mixed with river water, wastes
 from poultry farms are used as fish food in fisheries, and they think
 these practices are polluting water seriously

 Therefore diarrhea and skin diseases have become more frequent in
 their area

 As observed, most of them have a good knowledge on environment
 pollution. Their attitude is also good to avoid environmental pollution

 However, their practices are not good enough
Recommandations
 1. Government should exact rules and regulations so that industries
 cannot throw wastage everywhere.

 2. Owners of different industries should play a major role in raising
 awareness on pollution and health hazards. Industries need to develop
 a proper and hygienic waste disposal system by following government
 laws.

 3. Water contamination with chemicals should be locally maintained.

 4. Government needs to take some serious actions to control and
 manage the condition to prevent environment as early as possible.

 5. Control of air pollution is needed.
Recommandations
 6. Promotion of policy in order to reduce the effect of environment
 pollution through behavior change communication (BCC) in an
 industrial semi-urban area.

 7. People are drinking water from tube-wells with red marking knowing
 that this water is arsenic contaminated. Implantation of alternative
 source of pure drinking water is needed.

 8. Safe water supply provision by govt. or non govt. initiative is urgent.

 9. Nutrition education should be given to ensure healthy lifestyle and
 prevent environment pollution.

 10. Environment pollution and destruction should be under regular
 monitoring and prevention process.
Thank you

More Related Content

Similar to A Pilot study on KAP of the people in Araihazar Upazilla

Kebijakan Kependudukan Sumatera Selatan Berkaitan Hasil SDKI 2012
Kebijakan Kependudukan Sumatera Selatan Berkaitan Hasil SDKI 2012Kebijakan Kependudukan Sumatera Selatan Berkaitan Hasil SDKI 2012
Kebijakan Kependudukan Sumatera Selatan Berkaitan Hasil SDKI 2012Faharuddin Fahar
 
Child labour in cotton growing haryana 23 feb
Child labour in cotton growing haryana 23 febChild labour in cotton growing haryana 23 feb
Child labour in cotton growing haryana 23 feb
bsmihd
 
Characteristics of Older Households in Malaysia CST PERKKS2021 final.pdf
Characteristics of Older Households in Malaysia CST PERKKS2021 final.pdfCharacteristics of Older Households in Malaysia CST PERKKS2021 final.pdf
Characteristics of Older Households in Malaysia CST PERKKS2021 final.pdf
chez1978
 
Gender differences of internet use among young people in Hong Kong: Implicati...
Gender differences of internet use among young people in Hong Kong: Implicati...Gender differences of internet use among young people in Hong Kong: Implicati...
Gender differences of internet use among young people in Hong Kong: Implicati...
husITa
 
2019ICS_Key_findings_main_launch_Myanmar
2019ICS_Key_findings_main_launch_Myanmar2019ICS_Key_findings_main_launch_Myanmar
2019ICS_Key_findings_main_launch_Myanmar
KhaingKhaingSoe
 
Transport And Aging In Black America
Transport And Aging In Black AmericaTransport And Aging In Black America
Transport And Aging In Black America
bgward
 
Peterman widowassets v2
Peterman widowassets v2Peterman widowassets v2
Peterman widowassets v2IFPRI Gender
 
1) 1999, 2001, and 2008 CIRP Frequency Distribution Trend Results of CMU Resp...
1) 1999, 2001, and 2008 CIRP Frequency Distribution Trend Results of CMU Resp...1) 1999, 2001, and 2008 CIRP Frequency Distribution Trend Results of CMU Resp...
1) 1999, 2001, and 2008 CIRP Frequency Distribution Trend Results of CMU Resp...Digithead
 
1) 1999, 2001, and 2008 CIRP Frequency Distribution Trend Results of CMU Resp...
1) 1999, 2001, and 2008 CIRP Frequency Distribution Trend Results of CMU Resp...1) 1999, 2001, and 2008 CIRP Frequency Distribution Trend Results of CMU Resp...
1) 1999, 2001, and 2008 CIRP Frequency Distribution Trend Results of CMU Resp...
Digithead
 
Desempleo Por Edad
Desempleo Por EdadDesempleo Por Edad
Desempleo Por Edad
Aisart
 
Improving Family Planning Service Delivery to Adolescents in Ghana: Evidence ...
Improving Family Planning Service Delivery to Adolescents in Ghana: Evidence ...Improving Family Planning Service Delivery to Adolescents in Ghana: Evidence ...
Improving Family Planning Service Delivery to Adolescents in Ghana: Evidence ...MEASURE Evaluation
 
2011 SAIR It's not about pie when it comes to the facts
2011 SAIR It's not about pie when it comes to the facts2011 SAIR It's not about pie when it comes to the facts
2011 SAIR It's not about pie when it comes to the facts
David Onder
 
Panel Introduction
Panel IntroductionPanel Introduction
Panel Introduction
Qingbin
 
Presentation circ srtt baseline1
Presentation circ srtt baseline1Presentation circ srtt baseline1
Presentation circ srtt baseline1
Satyendra Singh
 
Socialization of elderly people- Serbian expirience
Socialization of elderly people- Serbian expirienceSocialization of elderly people- Serbian expirience

Similar to A Pilot study on KAP of the people in Araihazar Upazilla (20)

Kebijakan Kependudukan Sumatera Selatan Berkaitan Hasil SDKI 2012
Kebijakan Kependudukan Sumatera Selatan Berkaitan Hasil SDKI 2012Kebijakan Kependudukan Sumatera Selatan Berkaitan Hasil SDKI 2012
Kebijakan Kependudukan Sumatera Selatan Berkaitan Hasil SDKI 2012
 
Ga mtn rentalrecap
Ga mtn rentalrecapGa mtn rentalrecap
Ga mtn rentalrecap
 
Child labour in cotton growing haryana 23 feb
Child labour in cotton growing haryana 23 febChild labour in cotton growing haryana 23 feb
Child labour in cotton growing haryana 23 feb
 
Characteristics of Older Households in Malaysia CST PERKKS2021 final.pdf
Characteristics of Older Households in Malaysia CST PERKKS2021 final.pdfCharacteristics of Older Households in Malaysia CST PERKKS2021 final.pdf
Characteristics of Older Households in Malaysia CST PERKKS2021 final.pdf
 
Gender differences of internet use among young people in Hong Kong: Implicati...
Gender differences of internet use among young people in Hong Kong: Implicati...Gender differences of internet use among young people in Hong Kong: Implicati...
Gender differences of internet use among young people in Hong Kong: Implicati...
 
2019ICS_Key_findings_main_launch_Myanmar
2019ICS_Key_findings_main_launch_Myanmar2019ICS_Key_findings_main_launch_Myanmar
2019ICS_Key_findings_main_launch_Myanmar
 
Transport And Aging In Black America
Transport And Aging In Black AmericaTransport And Aging In Black America
Transport And Aging In Black America
 
Peterman widowassets v2
Peterman widowassets v2Peterman widowassets v2
Peterman widowassets v2
 
1) 1999, 2001, and 2008 CIRP Frequency Distribution Trend Results of CMU Resp...
1) 1999, 2001, and 2008 CIRP Frequency Distribution Trend Results of CMU Resp...1) 1999, 2001, and 2008 CIRP Frequency Distribution Trend Results of CMU Resp...
1) 1999, 2001, and 2008 CIRP Frequency Distribution Trend Results of CMU Resp...
 
1) 1999, 2001, and 2008 CIRP Frequency Distribution Trend Results of CMU Resp...
1) 1999, 2001, and 2008 CIRP Frequency Distribution Trend Results of CMU Resp...1) 1999, 2001, and 2008 CIRP Frequency Distribution Trend Results of CMU Resp...
1) 1999, 2001, and 2008 CIRP Frequency Distribution Trend Results of CMU Resp...
 
Cs3 p8 dyck listenning to the voices of rural mb
Cs3 p8 dyck listenning to the voices of rural mbCs3 p8 dyck listenning to the voices of rural mb
Cs3 p8 dyck listenning to the voices of rural mb
 
Desempleo Por Edad
Desempleo Por EdadDesempleo Por Edad
Desempleo Por Edad
 
Improving Family Planning Service Delivery to Adolescents in Ghana: Evidence ...
Improving Family Planning Service Delivery to Adolescents in Ghana: Evidence ...Improving Family Planning Service Delivery to Adolescents in Ghana: Evidence ...
Improving Family Planning Service Delivery to Adolescents in Ghana: Evidence ...
 
11
1111
11
 
2011 SAIR It's not about pie when it comes to the facts
2011 SAIR It's not about pie when it comes to the facts2011 SAIR It's not about pie when it comes to the facts
2011 SAIR It's not about pie when it comes to the facts
 
Panel Introduction
Panel IntroductionPanel Introduction
Panel Introduction
 
Presentation circ srtt baseline1
Presentation circ srtt baseline1Presentation circ srtt baseline1
Presentation circ srtt baseline1
 
Socialization of elderly people- Serbian expirience
Socialization of elderly people- Serbian expirienceSocialization of elderly people- Serbian expirience
Socialization of elderly people- Serbian expirience
 
Teenager
TeenagerTeenager
Teenager
 
Teenager
TeenagerTeenager
Teenager
 

Recently uploaded

Chapter 3 - Islamic Banking Products and Services.pptx
Chapter 3 - Islamic Banking Products and Services.pptxChapter 3 - Islamic Banking Products and Services.pptx
Chapter 3 - Islamic Banking Products and Services.pptx
Mohd Adib Abd Muin, Senior Lecturer at Universiti Utara Malaysia
 
Polish students' mobility in the Czech Republic
Polish students' mobility in the Czech RepublicPolish students' mobility in the Czech Republic
Polish students' mobility in the Czech Republic
Anna Sz.
 
678020731-Sumas-y-Restas-Para-Colorear.pdf
678020731-Sumas-y-Restas-Para-Colorear.pdf678020731-Sumas-y-Restas-Para-Colorear.pdf
678020731-Sumas-y-Restas-Para-Colorear.pdf
CarlosHernanMontoyab2
 
Guidance_and_Counselling.pdf B.Ed. 4th Semester
Guidance_and_Counselling.pdf B.Ed. 4th SemesterGuidance_and_Counselling.pdf B.Ed. 4th Semester
Guidance_and_Counselling.pdf B.Ed. 4th Semester
Atul Kumar Singh
 
CACJapan - GROUP Presentation 1- Wk 4.pdf
CACJapan - GROUP Presentation 1- Wk 4.pdfCACJapan - GROUP Presentation 1- Wk 4.pdf
CACJapan - GROUP Presentation 1- Wk 4.pdf
camakaiclarkmusic
 
CLASS 11 CBSE B.St Project AIDS TO TRADE - INSURANCE
CLASS 11 CBSE B.St Project AIDS TO TRADE - INSURANCECLASS 11 CBSE B.St Project AIDS TO TRADE - INSURANCE
CLASS 11 CBSE B.St Project AIDS TO TRADE - INSURANCE
BhavyaRajput3
 
June 3, 2024 Anti-Semitism Letter Sent to MIT President Kornbluth and MIT Cor...
June 3, 2024 Anti-Semitism Letter Sent to MIT President Kornbluth and MIT Cor...June 3, 2024 Anti-Semitism Letter Sent to MIT President Kornbluth and MIT Cor...
June 3, 2024 Anti-Semitism Letter Sent to MIT President Kornbluth and MIT Cor...
Levi Shapiro
 
Home assignment II on Spectroscopy 2024 Answers.pdf
Home assignment II on Spectroscopy 2024 Answers.pdfHome assignment II on Spectroscopy 2024 Answers.pdf
Home assignment II on Spectroscopy 2024 Answers.pdf
Tamralipta Mahavidyalaya
 
How libraries can support authors with open access requirements for UKRI fund...
How libraries can support authors with open access requirements for UKRI fund...How libraries can support authors with open access requirements for UKRI fund...
How libraries can support authors with open access requirements for UKRI fund...
Jisc
 
How to Make a Field invisible in Odoo 17
How to Make a Field invisible in Odoo 17How to Make a Field invisible in Odoo 17
How to Make a Field invisible in Odoo 17
Celine George
 
Acetabularia Information For Class 9 .docx
Acetabularia Information For Class 9  .docxAcetabularia Information For Class 9  .docx
Acetabularia Information For Class 9 .docx
vaibhavrinwa19
 
Biological Screening of Herbal Drugs in detailed.
Biological Screening of Herbal Drugs in detailed.Biological Screening of Herbal Drugs in detailed.
Biological Screening of Herbal Drugs in detailed.
Ashokrao Mane college of Pharmacy Peth-Vadgaon
 
The geography of Taylor Swift - some ideas
The geography of Taylor Swift - some ideasThe geography of Taylor Swift - some ideas
The geography of Taylor Swift - some ideas
GeoBlogs
 
Unit 2- Research Aptitude (UGC NET Paper I).pdf
Unit 2- Research Aptitude (UGC NET Paper I).pdfUnit 2- Research Aptitude (UGC NET Paper I).pdf
Unit 2- Research Aptitude (UGC NET Paper I).pdf
Thiyagu K
 
Introduction to AI for Nonprofits with Tapp Network
Introduction to AI for Nonprofits with Tapp NetworkIntroduction to AI for Nonprofits with Tapp Network
Introduction to AI for Nonprofits with Tapp Network
TechSoup
 
Welcome to TechSoup New Member Orientation and Q&A (May 2024).pdf
Welcome to TechSoup   New Member Orientation and Q&A (May 2024).pdfWelcome to TechSoup   New Member Orientation and Q&A (May 2024).pdf
Welcome to TechSoup New Member Orientation and Q&A (May 2024).pdf
TechSoup
 
2024.06.01 Introducing a competency framework for languag learning materials ...
2024.06.01 Introducing a competency framework for languag learning materials ...2024.06.01 Introducing a competency framework for languag learning materials ...
2024.06.01 Introducing a competency framework for languag learning materials ...
Sandy Millin
 
Thesis Statement for students diagnonsed withADHD.ppt
Thesis Statement for students diagnonsed withADHD.pptThesis Statement for students diagnonsed withADHD.ppt
Thesis Statement for students diagnonsed withADHD.ppt
EverAndrsGuerraGuerr
 
BÀI TẬP BỔ TRỢ TIẾNG ANH GLOBAL SUCCESS LỚP 3 - CẢ NĂM (CÓ FILE NGHE VÀ ĐÁP Á...
BÀI TẬP BỔ TRỢ TIẾNG ANH GLOBAL SUCCESS LỚP 3 - CẢ NĂM (CÓ FILE NGHE VÀ ĐÁP Á...BÀI TẬP BỔ TRỢ TIẾNG ANH GLOBAL SUCCESS LỚP 3 - CẢ NĂM (CÓ FILE NGHE VÀ ĐÁP Á...
BÀI TẬP BỔ TRỢ TIẾNG ANH GLOBAL SUCCESS LỚP 3 - CẢ NĂM (CÓ FILE NGHE VÀ ĐÁP Á...
Nguyen Thanh Tu Collection
 
Palestine last event orientationfvgnh .pptx
Palestine last event orientationfvgnh .pptxPalestine last event orientationfvgnh .pptx
Palestine last event orientationfvgnh .pptx
RaedMohamed3
 

Recently uploaded (20)

Chapter 3 - Islamic Banking Products and Services.pptx
Chapter 3 - Islamic Banking Products and Services.pptxChapter 3 - Islamic Banking Products and Services.pptx
Chapter 3 - Islamic Banking Products and Services.pptx
 
Polish students' mobility in the Czech Republic
Polish students' mobility in the Czech RepublicPolish students' mobility in the Czech Republic
Polish students' mobility in the Czech Republic
 
678020731-Sumas-y-Restas-Para-Colorear.pdf
678020731-Sumas-y-Restas-Para-Colorear.pdf678020731-Sumas-y-Restas-Para-Colorear.pdf
678020731-Sumas-y-Restas-Para-Colorear.pdf
 
Guidance_and_Counselling.pdf B.Ed. 4th Semester
Guidance_and_Counselling.pdf B.Ed. 4th SemesterGuidance_and_Counselling.pdf B.Ed. 4th Semester
Guidance_and_Counselling.pdf B.Ed. 4th Semester
 
CACJapan - GROUP Presentation 1- Wk 4.pdf
CACJapan - GROUP Presentation 1- Wk 4.pdfCACJapan - GROUP Presentation 1- Wk 4.pdf
CACJapan - GROUP Presentation 1- Wk 4.pdf
 
CLASS 11 CBSE B.St Project AIDS TO TRADE - INSURANCE
CLASS 11 CBSE B.St Project AIDS TO TRADE - INSURANCECLASS 11 CBSE B.St Project AIDS TO TRADE - INSURANCE
CLASS 11 CBSE B.St Project AIDS TO TRADE - INSURANCE
 
June 3, 2024 Anti-Semitism Letter Sent to MIT President Kornbluth and MIT Cor...
June 3, 2024 Anti-Semitism Letter Sent to MIT President Kornbluth and MIT Cor...June 3, 2024 Anti-Semitism Letter Sent to MIT President Kornbluth and MIT Cor...
June 3, 2024 Anti-Semitism Letter Sent to MIT President Kornbluth and MIT Cor...
 
Home assignment II on Spectroscopy 2024 Answers.pdf
Home assignment II on Spectroscopy 2024 Answers.pdfHome assignment II on Spectroscopy 2024 Answers.pdf
Home assignment II on Spectroscopy 2024 Answers.pdf
 
How libraries can support authors with open access requirements for UKRI fund...
How libraries can support authors with open access requirements for UKRI fund...How libraries can support authors with open access requirements for UKRI fund...
How libraries can support authors with open access requirements for UKRI fund...
 
How to Make a Field invisible in Odoo 17
How to Make a Field invisible in Odoo 17How to Make a Field invisible in Odoo 17
How to Make a Field invisible in Odoo 17
 
Acetabularia Information For Class 9 .docx
Acetabularia Information For Class 9  .docxAcetabularia Information For Class 9  .docx
Acetabularia Information For Class 9 .docx
 
Biological Screening of Herbal Drugs in detailed.
Biological Screening of Herbal Drugs in detailed.Biological Screening of Herbal Drugs in detailed.
Biological Screening of Herbal Drugs in detailed.
 
The geography of Taylor Swift - some ideas
The geography of Taylor Swift - some ideasThe geography of Taylor Swift - some ideas
The geography of Taylor Swift - some ideas
 
Unit 2- Research Aptitude (UGC NET Paper I).pdf
Unit 2- Research Aptitude (UGC NET Paper I).pdfUnit 2- Research Aptitude (UGC NET Paper I).pdf
Unit 2- Research Aptitude (UGC NET Paper I).pdf
 
Introduction to AI for Nonprofits with Tapp Network
Introduction to AI for Nonprofits with Tapp NetworkIntroduction to AI for Nonprofits with Tapp Network
Introduction to AI for Nonprofits with Tapp Network
 
Welcome to TechSoup New Member Orientation and Q&A (May 2024).pdf
Welcome to TechSoup   New Member Orientation and Q&A (May 2024).pdfWelcome to TechSoup   New Member Orientation and Q&A (May 2024).pdf
Welcome to TechSoup New Member Orientation and Q&A (May 2024).pdf
 
2024.06.01 Introducing a competency framework for languag learning materials ...
2024.06.01 Introducing a competency framework for languag learning materials ...2024.06.01 Introducing a competency framework for languag learning materials ...
2024.06.01 Introducing a competency framework for languag learning materials ...
 
Thesis Statement for students diagnonsed withADHD.ppt
Thesis Statement for students diagnonsed withADHD.pptThesis Statement for students diagnonsed withADHD.ppt
Thesis Statement for students diagnonsed withADHD.ppt
 
BÀI TẬP BỔ TRỢ TIẾNG ANH GLOBAL SUCCESS LỚP 3 - CẢ NĂM (CÓ FILE NGHE VÀ ĐÁP Á...
BÀI TẬP BỔ TRỢ TIẾNG ANH GLOBAL SUCCESS LỚP 3 - CẢ NĂM (CÓ FILE NGHE VÀ ĐÁP Á...BÀI TẬP BỔ TRỢ TIẾNG ANH GLOBAL SUCCESS LỚP 3 - CẢ NĂM (CÓ FILE NGHE VÀ ĐÁP Á...
BÀI TẬP BỔ TRỢ TIẾNG ANH GLOBAL SUCCESS LỚP 3 - CẢ NĂM (CÓ FILE NGHE VÀ ĐÁP Á...
 
Palestine last event orientationfvgnh .pptx
Palestine last event orientationfvgnh .pptxPalestine last event orientationfvgnh .pptx
Palestine last event orientationfvgnh .pptx
 

A Pilot study on KAP of the people in Araihazar Upazilla

  • 1.
  • 2. Roadmap of the study  Background  Objective  Data and Methodology  Result and finding  Conclusion  Recommendation
  • 3. Background Rapid and unplanned industrialization and urbanization has severely polluted the environmental resources especially air, water and soil arena Our farmers are using excess fertilizer, pesticide in their lands in order to increase crops production. It has tremendous impact on our environment, destroying eco system.
  • 4. Background The number of industry units at Narayanganj, as recorded by the Bangladesh Bureau of Statistics, is 2,409 Food, beverage and tobacco - 377 Jute, cotton, textile and leather - 1,320 Wood products – 49 Pulp and paper products – 30 Chemicals – 104 Non-metallic products – 170 Basic metal products – 101 Fabricated metal, machinery and equipment – 230 Other manufacturing - 28.
  • 5. Background There are over 300 various effluent discharge outlets from nine major industrial clusters including Narayanganj Of these, 19 outlets carry the major discharge of domestic and industrial waste Of the discharged untreated liquid waste, 61% are industrial and 39% domestic waste The lone Sewerage Treatment Plant (SWP) in Pagla in Narayanganj can treat only 10% of the industrial waste. It is estimated that there are over 7,000 industries in Dhaka metropolis located mostly in three clusters -- Hazaribagh, Tejgaon and DND (Narayanganj) area
  • 6. Background A chemical oxygen demand (COD) test, carried out by BUET, showed that the level of pollutants in the Shitalakhya River was 28 to 128 mg, much higher than the normal range between 4-12mg At present in the river Buriganga contains 60 times higher chromium than the permissible limit Water arsenic concentrations in Araihazar were found to range from 0.094 to 790 mg/L, WHO permissible limit being 0.01 mg/L.
  • 7. Background Environmental factors account for as much as 22% of the national burden of disease, principally in the form of respiratory infections and diarrhoeal disease However, people have little knowledge about the impact of industrialization on environmental pollution and human health.
  • 9. Araihazar: at a glance Area: 183.35 sq km Union parishads: 12 Mouzas: 182 Villages: 315 Population: 299,855; Muslims 96.08%, Hindu 3.76%, others .16% Religious institutions: Mosque 355, temple 7 Literacy: Average literacy 23.6%; male 28.6% and female 17%
  • 10. Araihazar: at a glance Educational institutions: College 4, secondary school 17, primary school 114, community school 11, satellite school 7, madrasa 36, maktab 460 Cultural organizations: Public library 1, club 65, cinema hall 3, community centre 8, playground 25 Main occupations: Agriculture 24.68%, fishing 1.65%, agricultural labourer 10.96%, wage labourer 8.53%, commerce 14.45%, service 3.84%, weaving 20.73%, industry 1.57% and others 13.59% Main crops: Paddy, jute, wheat, corn, potato, kalai, sesame, mustard, vegetabl es. Pan cultivation, which was once quite extensive, is now almost extinct Health centre: Hospital 1, family welfare centre 4, union family welfare centre 7
  • 11. Objectives The objectives are 1. To identify the socio-economic and demographic status of the inhabitants in an industrial semi urban area of Bangladesh (Araihazar upazila of Narayangang) 2. To identify the lacking of people’s knowledge about air, water and soil pollution 3. The prevalence of morbidities related to air, water and soil pollution among the study participants.
  • 12. Methodology This is a cross sectional study Study was conducted in Araihazar (a Peri Urban setting) in Bangladesh Both quantitative and qualitative method was applied in this study to collect information
  • 13. Methodology: Quantitative study Sample size: The formula used for these calculations is: (Ref: Krejcie and Morgan. 1970. “Determining Sample Size for Research Activities” (Educational and Psychological Measurement, #30, pp. 607-610))
  • 14. Methodology: Quantitative study Using this Standard formula, the required sample for Araihazar Upazilla is 1511 (Household 90,000, α = .05, ME = 0.025, P = 0.5). Increasing the sample size 20% in order to reduce the non response error, the sample size is 1813 3 village was randomly selected (probability proportion to HH size in each village). So from 12 unions, 36 village was selected 50 HH from each village was randomly selected Total HH size is 50 X 12 X 3 = 1800 HH
  • 15. Methodology: Quantitative study Pre structured questionnaire was used to collect the information Questionnaire was tested in Gazipur before final print Both HH and adult questionnaire was in Bengali 1 supervisor and 10 interviewer was appointed for data collection Extensive training (in house and field) was provided to the supervisor and interviewer When the investigator though that the team is ready for interview, they was sent for data collection
  • 16. Methodology: Qualitative study Focus Group Discussion (FGD) method used to collect information One village was randomly selected from each union. Total 12 FGD was conducted Structured guideline was followed for FGD 6 skilled person was appointed for FGD FGD was conducted in the village in their convenient times Each FGD took around two hour Each FGD was recorded in tap recorder Finally information was analyzed
  • 17. Result Age and gender wise distribution of population (Population Pyramid) 70+ 65-69 60-64 55-59 50-54 45-49 40-44 35-39 30-34 25-29 20-24 15-19 10-14 5-9 0-4 -20 -15 -10 -5 0 5 10 15 Fem ale Male
  • 18. Result : Continued Literate population 18 years and over by level of education by gender Frequency Percentage Total Total Male Female Male Female Never attended 1061 1347 2408 43.0 51.3 47.3 school Primary 307 290 597 12.5 11.0 11.7 High School 892 852 1744 36.2 32.4 34.2 SSC/HSC 181 135 316 7.3 5.1 6.2 Higher 24 3 27 1.0 .1 .5 Total 2465 2627 5092 100.0 100.0 100.0 Literate population age 6-17 years according to their education level by gender Frequency Percentage Male Female Total Male Female Total Never attended 161 105 266 12.1 8.6 10.4 school Primary 776 669 1445 58.2 55.0 56.7 High School 373 414 787 28.0 34.0 30.9 SSC or Higher 24 28 52 1.8 2.3 2.0 Total 1334 1216 2550 100.0 100.0 100.0
  • 19. Result : Continued Marital status of the respondents of age 18+ by gender Frequency Percentage Male Female Total Male Female Total Never married 534 154 688 21.6 5.9 13.5 Currently married 1894 2104 3998 76.7 80.0 78.4 Separate/ 1 17 18 .0 .6 .4 Divorced 5 15 20 .2 .6 .4 Widow/ Widower 36 340 376 1.5 12.9 7.4 Total 2470 2630 5100 100.0 100.0 100.0 Marital status of the respondents of age 6-17 by gender Frequency Percentage Male Female Total Male Female Total Never married 1334 1204 2538 100.0 99.0 99.5 Currently married 0 10 10 -- .8 .4 Divorced 0 2 2 -- .2 .1 Total 1334 1216 2550 100.0 100.0 100.0
  • 20. Result : Continued Occupation of the adult (age 18+) by gender Frequency Percentage Male Female Total Male Female Total Agriculture worker 388 9 397 15.7 .3 7.8 Unskilled job 185 33 218 7.5 1.3 4.3 Small business man 508 10 518 20.6 .4 10.2 Transport Worker 202 0 202 8.2 4.0 Loom worker 616 13 629 24.9 .5 12.3 Student 78 76 154 3.2 2.9 3.0 Searching job, no work or retired 209 151 360 8.5 5.7 7.1 Job 217 62 279 8.8 2.4 5.5 Housewife -- 2264 2264 -- 86.1 44.4 Other 67 12 79 2.7 .5 1.5 Total 2470 2630 5100 100.0 100.0 100.0
  • 21. Result : Continued Housing types (roof, floor and wall) of the households: 120 100 80 60 40 20 0 Type of wall Type of roof Type of floor Pucca/Cement Tin Bamboo Mud/Dirt Leaves/straw
  • 22. Result : Continued S o u rc e o f d rin k in g water? Percentage 120 98.4 distribution of 100 source of 80 drinking water 60 40 20 0.6 0.2 0.9 0 Tap water Tube-well R egular well R iver/C anal Does household has electricity? Percentage No, 4.2 distribution of source of lighting Yes, 95.8
  • 23. Result : Continued Type of fuel used for cooking 70 Percentage distribution 60 of type of fuel used for 50 cooking? 40 30 20 10 0 l g p d . ss oa as un ro oo ra C G /c D W G re al tu m ul ni ic A gr A Cooking place Both, 10.8 Percentage distribution of place of Outside the house, cooking 27.4 Inside house, 61.8 Inside house Outside the house Both
  • 24. Result : Continued Household monthly income 30 25 20 15 10 5 0 0-6000 6001-8000 8001-10000 10001-12000 12000+ 70 60 50 Percentage distribution of household by type 40 of toilet facilities for different age group: 30 20 10 0 Septic tank / Slab latrine Pit latrine Open latrine, Bush / Hanging latrine Modern latrine Field Adult (age>15 years) Child (age<5 years) Child (age>5 but <15)
  • 25. Result : Continued Percentage distribution of household members of Araihazar Upazila who wear a sandal in the toilet 83 82 81 80 79 78 77 76 75 74 73 Adult (age>15 years) Child (age<5 years) Child (age>5 but <15) 70 60 Percentage distribution of household 50 members (at different age group) who wash their hands after visiting toilet 40 30 20 10 0 All the time Sometimes Not very often Never Adult (age>15 years ) Child (age<5 years ) Child (age>5 but <15)
  • 26. Result : Continued 60 50 Percentage distribution of household members about what they use to wash 40 their hands after going to toilet 30 20 10 0 Soap Ash Soil Only water Adult (age>15 years ) Child (age<5 years ) Child (age>5 but <15)
  • 27. % distribution of KAP related to environmental pollution Name of the variable Percentage % thinks that industries are throwing their wastage here and there? 92.2 % knows that industrial wastage are polluting environment which is harmful for health? 99.7 % knows that smoke emission from industries is harmful for health? 100.0 % thinks that water is polluted due to industry 99.8 % thinks that soil is polluted due to industry 99.8 % thinks that air is polluted due to industry 99.8 % knows that taking bath in the polluted water is harmful for health 100.0 % thinks that land is losing its fertility due to throwing industrial wastage here and there 100.0 % thinks that it is good to throw industrial wastage here and there 2.3 % thinks that there should be some rules so that the industries cannot throw their wastage 99.8 here and there % knows anything about arsenic in water? 96.7 % have taken any initiative to get water free from arsenic 69.5 % where there is any industry close to house (within half kilometer) 88.9 What do you think about the crop production in a land? Has increased 3.9 Has decline 13.4 Remain constant 82.6 Name of the industry close to household Textile 79.2 Poultry 28.1 Handloom 3.2
  • 28. Result : Continued Prevalence of chronic diseases among the adults: Suffered from particular Among them who took diseases treatment Number Percentage Number Percentage Heart Diseases 89 2.6 87 97.8 Diabetes 151 4.4 142 94.0 Hypertension 387 11.2 379 97.9 Tuberculosis 14 .4 13 92.9 Arthritis or 791 98.0 807 23.3 Rheumatism Gastric/ ulcer 2924 84.4 2893 98.9 Anaemia 96 2.8 94 97.9 Asthma 120 3.5 118 98.3 Cancer 2 .1 2 100.0 Total 3463
  • 29. Result : Continued % Distribution of treatment/service seeking behavior for different chronic diseases who have taken treatment/service Type of health seeking behavior Total MBBS Pharma Village Homeop Othe Did not Num Percen (private) cy Doctor ath r consulte ber tage d Heart diseases 77.5 6.7 9 1.1 5.6 89 100 Diabetes 66.9 13.2 9.3 0.7 9.9 151 100 Hypertension 36.2 38 19.4 0.8 5.7 387 100 Tuberculosis 78.6 7.1 7.1 7.1 14 100 Arthritis or 807 Rheumatism 13.4 32.5 39.5 0.9 0.5 13.3 100 Gastric/ ulcer 4.2 44.8 39.6 0.1 0.5 10.8 2925 100 Anaemia 27.1 53.1 17.7 2.1 96 100 Asthma 35 28.3 25.8 10.8 120 100
  • 30. Result : Continued Prevalence of acute diseases and its duration and how many times they had suffered in the last month Number Prevalenc In the last month how many e of times suffered (those who diseases suffered) (mean) Headache 554 16.0 9.5 eye infection 19 .5 11.5 Toothache 183 5.3 10.7 Cough /cold 541 15.6 11.6 Fever 885 25.6 8.1 Vomiting/stomachache 154 4.4 9.1 Watery diarrhea 68 2.0 9.1 Loose motion associated with 38 1.1 mucus or blood 9.4 Skin problem 51 1.5 12.9 Accidental causes (eg. cut hand or 12 .3 legs) 8.4 Arsenicosis 7 .2 16.1 Total 3463
  • 31. Conclusion Industries has increased in this study area including textile mills, power loom factory, handloom, sizing factory, spinning mill, cotton mill, dyeing factories, brick field and so on Almost all Inhabitants think that industries are polluting their air, water and soil Burning industrial waste materials, smoke from different industries and cooking are the main reasons for air pollution This has also important implications for the health of population in that area People keep dusts from animal farms (poultry/cow), waste materials from industries (dyeing, textile, etc.) and household wastages here and there Besides use of chemical fertilizers; pesticides has reduced productivity of lands in their area
  • 32. Conclusion In some cases industrial wastages (e.g. dyeing factories) are drained out in river sometimes household wastages are thrown in spoiled ponds, although knowing that it’s not a good practice Besides irrigation project, fertilizers get mixed with river water, wastes from poultry farms are used as fish food in fisheries, and they think these practices are polluting water seriously Therefore diarrhea and skin diseases have become more frequent in their area As observed, most of them have a good knowledge on environment pollution. Their attitude is also good to avoid environmental pollution However, their practices are not good enough
  • 33. Recommandations 1. Government should exact rules and regulations so that industries cannot throw wastage everywhere. 2. Owners of different industries should play a major role in raising awareness on pollution and health hazards. Industries need to develop a proper and hygienic waste disposal system by following government laws. 3. Water contamination with chemicals should be locally maintained. 4. Government needs to take some serious actions to control and manage the condition to prevent environment as early as possible. 5. Control of air pollution is needed.
  • 34. Recommandations 6. Promotion of policy in order to reduce the effect of environment pollution through behavior change communication (BCC) in an industrial semi-urban area. 7. People are drinking water from tube-wells with red marking knowing that this water is arsenic contaminated. Implantation of alternative source of pure drinking water is needed. 8. Safe water supply provision by govt. or non govt. initiative is urgent. 9. Nutrition education should be given to ensure healthy lifestyle and prevent environment pollution. 10. Environment pollution and destruction should be under regular monitoring and prevention process.