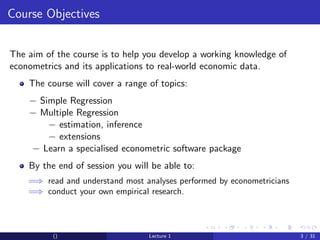
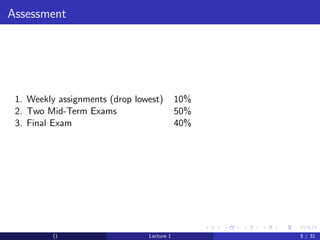
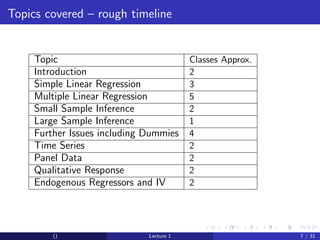
SlideShare a Scribd company logo
ECO341K Introduction to Econometrics


()               Lecture 1              1 / 31
Lecture 1 - Outline


Course Outline
    Course objectives
    Textbook
    Assessment


         ()             Lecture 1   2 / 31
Course Objectives


The aim of the course is to help you develop a working knowledge of
econometrics and its applications to real-world economic data.
    The course will cover a range of topics:
    − Simple Regression
    − Multiple Regression
        − estimation, inference
        − extensions
    − Learn a specialised econometric software package
    By the end of session you will be able to:
    =⇒ read and understand most analyses performed by econometricians
    =⇒ conduct your own empirical research.


          ()                      Lecture 1                             3 / 31
Textbooks:


The required text is:
    J.M. Wooldridge (2008) Introductory Econometrics: A Modern
    Approach. 4th Edition
         3rd edition is fine
    A useful companion book:
    J.M. Wooldridge (2008) Student Solution Manual for Introductory
    Econometrics available electronically through the text website.


           ()                   Lecture 1                             4 / 31
Assessment


 1. Weekly assignments (drop lowest)        10%
 2. Two Mid-Term Exams                      50%
 3. Final Exam                              40%


         ()                     Lecture 1         5 / 31
Course Website (Blackboard)


This site will contain:
     Lecture handouts (syllabus, etc)
     Lecture notes for each class
     Homework assignments, including data sets
     Homework solutions
     Data sets and STATA logs for in class examples
     Special announcements (sent via email also)


           ()                       Lecture 1         6 / 31
Topics covered – rough timeline


     Topic                                Classes Approx.
     Introduction                         2
     Simple Linear Regression             3
     Multiple Linear Regression           5
     Small Sample Inference               2
     Large Sample Inference               1
     Further Issues including Dummies     4
     Time Series                          2
     Panel Data                           2
     Qualitative Response                 2
     Endogenous Regressors and IV         2


         ()                   Lecture 1                     7 / 31
Software – STATA


It is crucial that you have access to STATA and that you do the
empirical exercises
    Access Options:
      1   Timeshare through the web from anywhere
      2   Purchase through STATA gradplan – see syllabus – about $100
      3   Labs in Burdine?
    What does STATA look like? Lets see!


           ()                      Lecture 1                            8 / 31
Lecture 2 - Outline


The Nature of Econometrics
    What is Econometrics ?
    The Structure of Economic Data
    Causality ‘Ceteris Paribus’ and correlation


          ()                      Lecture 1       9 / 31
What is Econometrics ?


Econometrics concerns the use of statistical methods in:
    estimating economic relationships
    testing economic theory
    evaluating government and business policy.
    forecasting and prediction


          ()                      Lecture 1                10 / 31
Applications


      Econometrics has many wider applications, for example

  1   the effect of class size or spending on student performance
  2   the effect of education on wages
  3   testing for discrimination in labour and credit markets
  4   the effect of minimum wages on unemployment
  5   the effect of CEO compensation on firm performance
  6   the effect of govt policies on inflation and economic growth

      Common feature: Econometrics deals with nonexperimental data
      drawn from observing economic events (the data are not collected
      through controlled experiments in a laboratory).


            ()                      Lecture 1                            11 / 31
Conducting Empirical Economic Analysis


   Econometrics is used in every branch of applied economics
   Empirical Analysis uses data to test the predictions of a theory or
   estimate a relationship.
   An empirical analysis generally consists of
     1   An economic model - which may be formally developed (e.g. derivation
         of consumer demand equations from a model of utility maximisation)
         or based on intuitive reasoning.
     2   An econometric model - which requires specifying the nature of the
         relationship between variables


          ()                       Lecture 1                             12 / 31
Conducting Empirical Economic Analysis


Example of an econometric model – a multiple regression model:
wage = β 0 + β 1 .educ + β 2 .exper + υ

where:
wage = hourly wage rate
educ = years of education
exper = years of employment
β 0 , β 1 , β 2 = parameters which describe the direction and strength of the
relationship between the wage and the factors which determine it
υ = error term (or ‘disturbance term’) which contains unobservable factors
(innate ability, job characteristics,...)


           ()                      Lecture 1                             13 / 31
Conducting Empirical Economic Analysis


   With this model a range of hypotheses can be stated in terms of the
   unknown parameters ( β 0 , β 1 , β 2 ).
   Empirical analysis requires data, and econometric methods are used to
   estimate the parameters of the model and to formally test hypotheses
   of interest. The model can also be used to make predictions.


   Methods need to take into account the structure of the data
   4 main data structures: cross-sectional data, time-series data, pooled
   cross sections, panel data


         ()                      Lecture 1                            14 / 31
The Structure of Economic Data


A. Cross-Sectional Data
   sample of individuals, households, firms, countries or other units
   taken at a point in time (“snapshot”)
   usually obtained by random sampling from the population (and the
   sample is “representative”)
   cross-sectional data are widely used in economics and other social
   sciences. Very common in applied micro such as labor economics,
   public economics, industrial organization, health economics
   =⇒ this is the main data structure we will focus on
   if randomly sampled, order of observations is unimportant


         ()                       Lecture 1                             15 / 31
Cross-Sectional Data
Examples of a cross-sectional data set:
(a) Data set on wages and other personal characteristics


          ()                      Lecture 1                16 / 31
Cross-Sectional Data

(b) Data set on economic growth and country characteristics


          ()                     Lecture 1                    17 / 31
Time Series Data


B. Time Series Data
   observations on a variable (or set of variables) over time
   E.g. stock prices, cpi, gdp, crime rates.
   The chronological ordering of observations is important
   =⇒ observations cannot be assumed to be independent over time, most
      economic time series are (strongly) related to their recent histories
   =⇒ econometric model needs to take this into account
   Data frequency is important, due to seasonal patterns (e.g. daily,
   weekly, monthly, quarterly, annual)


         ()                        Lecture 1                                  18 / 31
Time Series Data

Example: data on minimum wages


         ()                      Lecture 1   19 / 31
Pooled Cross Sections


C. Pooled Cross Sections
   some data sets have both cross-sectional and time series properties.
   E.g. 2 cross-sectional family surveys in US
   - one in 2000 recording income, expenditure, family size,...
   - a new random sample in 2005, with same questions
   =⇒ pool them to increase sample size
   =⇒ no family is in the sample for the 2 years


         ()                      Lecture 1                            20 / 31
Pooled Cross Sections


   Pooled cross-sections can be an effective way to analyse govt policies
   (e.g. look at economic relationships before and after the policy was
   introduced)
   Pooled cross sections are also very useful for studying group dynamics
   over time (e.g. how are average wages evolving for the group who
   entered the labour market during the last recession; what determines
   changes in median house prices in specific areas of US)
   Can analyse like a standard cross-section, though need to allow for
   changes in variables over time


         ()                     Lecture 1                                21 / 31
Pooled Cross Sections
Example: Two years of house prices


          ()                    Lecture 1   22 / 31
Panel Data
D. Panel (or Longitudinal) Data
   Consists of a time series for each cross-sectional unit
   =⇒ follow the same individuals / firms etc. over time
   Example: crime statistics at the city level – to study things like effect
   of law enforcement or economic conditions on crime


         ()                      Lecture 1                              23 / 31
Panel Data


   panel data has some important advantages over other data structures
   (we can control for certain types of unobserved characteristics, and
   can study lags in behaviour).
   some important questions cannot be answered without panel data
   =⇒ e.g. studying dynamics behaviour of individual units
   briefly consider simple panel data methods


         ()                       Lecture 1                         24 / 31
Causal Effects, Ceteris Paribus and Correlation

Causality and Ceteris Paribus in Econometric Analysis
    In most tests of economic theory, and for evaluating policy, the goal is
    to infer a causal effect of one variable on another
    Most propositions in economics are ‘ceteris paribus’ by nature
    Example: the responsiveness of the demand for coffee to price -
    holding all other factors constant (such as income, prices of other
    goods). If these other factors are not constant, we cannot determine
    the casual effect of a price change on quantity demanded
    not feasible to literally hold ‘all else equal’ .... but have enough other
    factors been held constant to infer causality ?
    properly applied, econometric methods can simulate a ceteris paribus
    experiment
(⇒) economic theory and econometrics together can help us uncover
causal effects.
          ()                       Lecture 1                               25 / 31
Causality and Correlation


    We may recall (hopefully!) from Prob/Stats ECO329 the concept of
    correlation and covariance
    Measures of linear association between 2 variables
    Example: Education and Wages.
        Do people with higher levels of education tend to have higher wages?
        Do people with higher wages have more education?
    Correlation is a measure of this assocation
    Let r be the correlation between wage for person i - say yi and
    education xi


          ()                      Lecture 1                               26 / 31
Recall (?????) that,

                                ∑n=1 (xi − x )(yi − y )
                                  i         ¯       ¯
                     r=      n                  n
                            ∑i =1 (xi − x )2 ∑i =1 (yi − y )2
                                        ¯                ¯

    r > 0 means that large y are associated with large x
    r < 0 means that large y are associated with small x
    r = 0 means no linear association
could be nonlinear
could be no association at all


           ()                      Lecture 1                    27 / 31
Keep in Mind


   One cannot conclude causation by simply looking at correlation
   Note r is symmetric in x and y so:
       does x cause y
       does y cause x
   Even if one thought it went a particular direction there may be other
   mitigating factors that need to be taken into account


         ()                     Lecture 1                            28 / 31
Examples:

Wages and Education are correlated (as we will see)
    Which direction is plausible and why?


    Other factors?


          ()                     Lecture 1            29 / 31
Examples:
Sports
In watching football I often hear/see statements that are of the form:

“When team x (insert your favorite) runs the ball more than 30 times they
win 80% of the games but when they run less than 30 times they only win
                          30% of the games.”

    What the heck does this mean? Clearly it looks like there is a
    correlation between number of running plays and the chance of
    winning.
    But is it a causal effect?


    If it were causal then it would mean the coach could just make sure
    he runs the ball at least 30 times (regardless) and will win more often
    Is this how it works?
          ()                      Lecture 1                              30 / 31
Examples:


In the popular press there are many instances of people trying to infer a
causal relationship between variables based simply on correlations between
two variables.
      Try and listen for examples of this.
      Now lets play with some data!

  1   Wage data – relation between education and wages
  2   Test score data – relation between class size and standardized test
      scores


            ()                      Lecture 1                               31 / 31

More Related Content

Viewers also liked

Stochastic Process
Stochastic ProcessStochastic Process
Stochastic Process
knksmart
 
Elements Of Stochastic Processes
Elements Of Stochastic ProcessesElements Of Stochastic Processes
Elements Of Stochastic Processes
MALAKI12003
 
Stochastic modelling and its applications
Stochastic modelling and its applicationsStochastic modelling and its applications
Stochastic modelling and its applications
Kartavya Jain
 
Basic econometrics lectues_1
Basic econometrics lectues_1Basic econometrics lectues_1
Basic econometrics lectues_1
Nivedita Sharma
 
Econometrics notes (Introduction, Simple Linear regression, Multiple linear r...
Econometrics notes (Introduction, Simple Linear regression, Multiple linear r...Econometrics notes (Introduction, Simple Linear regression, Multiple linear r...
Econometrics notes (Introduction, Simple Linear regression, Multiple linear r...
Muhammad Ali
 
Econometrics lecture 1st
Econometrics lecture 1stEconometrics lecture 1st
Econometrics lecture 1st
Ishaq Ahmad
 

Viewers also liked (6)

Stochastic Process
Stochastic ProcessStochastic Process
Stochastic Process
 
Elements Of Stochastic Processes
Elements Of Stochastic ProcessesElements Of Stochastic Processes
Elements Of Stochastic Processes
 
Stochastic modelling and its applications
Stochastic modelling and its applicationsStochastic modelling and its applications
Stochastic modelling and its applications
 
Basic econometrics lectues_1
Basic econometrics lectues_1Basic econometrics lectues_1
Basic econometrics lectues_1
 
Econometrics notes (Introduction, Simple Linear regression, Multiple linear r...
Econometrics notes (Introduction, Simple Linear regression, Multiple linear r...Econometrics notes (Introduction, Simple Linear regression, Multiple linear r...
Econometrics notes (Introduction, Simple Linear regression, Multiple linear r...
 
Econometrics lecture 1st
Econometrics lecture 1stEconometrics lecture 1st
Econometrics lecture 1st
 

Similar to Notes1

Week11-EvaluationMethods.ppt
Week11-EvaluationMethods.pptWeek11-EvaluationMethods.ppt
Week11-EvaluationMethods.ppt
KamranAli649587
 
1_Introduction to crops and livestock production economics
1_Introduction to crops and livestock production economics1_Introduction to crops and livestock production economics
1_Introduction to crops and livestock production economics
DICKSON MGAYA
 
Econometrics _1.pptx
Econometrics _1.pptxEconometrics _1.pptx
Econometrics _1.pptx
fuad80
 
Chapter one: Introduction to Econometrics.ppt
Chapter one: Introduction to Econometrics.pptChapter one: Introduction to Econometrics.ppt
Chapter one: Introduction to Econometrics.ppt
aschalew shiferaw
 
ECONOMETRICS
ECONOMETRICSECONOMETRICS
ECONOMETRICS
shiva murthy
 
Panel data content
Panel data contentPanel data content
Panel data content
Titus Mutambu Mweta
 
revision-notes-introductory-econometrics-lecture-1-11.pdf
revision-notes-introductory-econometrics-lecture-1-11.pdfrevision-notes-introductory-econometrics-lecture-1-11.pdf
revision-notes-introductory-econometrics-lecture-1-11.pdf
MrDampha
 
Econometrics_1.pptx
Econometrics_1.pptxEconometrics_1.pptx
Econometrics_1.pptx
SoumiliBera2
 
TIME SERIES & CROSS ‎SECTIONAL ANALYSIS
TIME SERIES & CROSS ‎SECTIONAL ANALYSISTIME SERIES & CROSS ‎SECTIONAL ANALYSIS
TIME SERIES & CROSS ‎SECTIONAL ANALYSIS
Libcorpio
 
Neuroscience meets cryptography ( This is the topic for research p.docx
Neuroscience meets cryptography ( This is the topic for research p.docxNeuroscience meets cryptography ( This is the topic for research p.docx
Neuroscience meets cryptography ( This is the topic for research p.docx
vannagoforth
 
Neuroscience meets cryptography ( This is the topic for research p.docx
Neuroscience meets cryptography ( This is the topic for research p.docxNeuroscience meets cryptography ( This is the topic for research p.docx
Neuroscience meets cryptography ( This is the topic for research p.docx
dohertyjoetta
 
Ekonometrika
EkonometrikaEkonometrika
Ekonometrika
jamuga gitulho
 
project final
project finalproject final
project final
Boris Kisska
 
Assignment Week 1.docDue by 11pm June 30th Chapter 1.docx
Assignment Week 1.docDue by 11pm June 30th Chapter 1.docxAssignment Week 1.docDue by 11pm June 30th Chapter 1.docx
Assignment Week 1.docDue by 11pm June 30th Chapter 1.docx
ssuser562afc1
 
Reflective Journal 9 Benefits and Dangers of Social NetworksW.docx
Reflective Journal 9 Benefits and Dangers of Social NetworksW.docxReflective Journal 9 Benefits and Dangers of Social NetworksW.docx
Reflective Journal 9 Benefits and Dangers of Social NetworksW.docx
carlt3
 
Lecture 1.pptx
Lecture 1.pptxLecture 1.pptx
Econometrics1,2,3,4,5,6,7,8_ChaptersALL.pdf
Econometrics1,2,3,4,5,6,7,8_ChaptersALL.pdfEconometrics1,2,3,4,5,6,7,8_ChaptersALL.pdf
Econometrics1,2,3,4,5,6,7,8_ChaptersALL.pdf
nazerjibril
 
MAC411(A) Analysis in Communication Researc.ppt
MAC411(A) Analysis in Communication Researc.pptMAC411(A) Analysis in Communication Researc.ppt
MAC411(A) Analysis in Communication Researc.ppt
PreciousOsoOla
 
Regression models for panel data
Regression models for panel dataRegression models for panel data
Regression models for panel data
University of Salerno
 
Application of linear programming techniques to practical
Application of linear programming techniques to practicalApplication of linear programming techniques to practical
Application of linear programming techniques to practical
Alexander Decker
 

Similar to Notes1 (20)

Week11-EvaluationMethods.ppt
Week11-EvaluationMethods.pptWeek11-EvaluationMethods.ppt
Week11-EvaluationMethods.ppt
 
1_Introduction to crops and livestock production economics
1_Introduction to crops and livestock production economics1_Introduction to crops and livestock production economics
1_Introduction to crops and livestock production economics
 
Econometrics _1.pptx
Econometrics _1.pptxEconometrics _1.pptx
Econometrics _1.pptx
 
Chapter one: Introduction to Econometrics.ppt
Chapter one: Introduction to Econometrics.pptChapter one: Introduction to Econometrics.ppt
Chapter one: Introduction to Econometrics.ppt
 
ECONOMETRICS
ECONOMETRICSECONOMETRICS
ECONOMETRICS
 
Panel data content
Panel data contentPanel data content
Panel data content
 
revision-notes-introductory-econometrics-lecture-1-11.pdf
revision-notes-introductory-econometrics-lecture-1-11.pdfrevision-notes-introductory-econometrics-lecture-1-11.pdf
revision-notes-introductory-econometrics-lecture-1-11.pdf
 
Econometrics_1.pptx
Econometrics_1.pptxEconometrics_1.pptx
Econometrics_1.pptx
 
TIME SERIES & CROSS ‎SECTIONAL ANALYSIS
TIME SERIES & CROSS ‎SECTIONAL ANALYSISTIME SERIES & CROSS ‎SECTIONAL ANALYSIS
TIME SERIES & CROSS ‎SECTIONAL ANALYSIS
 
Neuroscience meets cryptography ( This is the topic for research p.docx
Neuroscience meets cryptography ( This is the topic for research p.docxNeuroscience meets cryptography ( This is the topic for research p.docx
Neuroscience meets cryptography ( This is the topic for research p.docx
 
Neuroscience meets cryptography ( This is the topic for research p.docx
Neuroscience meets cryptography ( This is the topic for research p.docxNeuroscience meets cryptography ( This is the topic for research p.docx
Neuroscience meets cryptography ( This is the topic for research p.docx
 
Ekonometrika
EkonometrikaEkonometrika
Ekonometrika
 
project final
project finalproject final
project final
 
Assignment Week 1.docDue by 11pm June 30th Chapter 1.docx
Assignment Week 1.docDue by 11pm June 30th Chapter 1.docxAssignment Week 1.docDue by 11pm June 30th Chapter 1.docx
Assignment Week 1.docDue by 11pm June 30th Chapter 1.docx
 
Reflective Journal 9 Benefits and Dangers of Social NetworksW.docx
Reflective Journal 9 Benefits and Dangers of Social NetworksW.docxReflective Journal 9 Benefits and Dangers of Social NetworksW.docx
Reflective Journal 9 Benefits and Dangers of Social NetworksW.docx
 
Lecture 1.pptx
Lecture 1.pptxLecture 1.pptx
Lecture 1.pptx
 
Econometrics1,2,3,4,5,6,7,8_ChaptersALL.pdf
Econometrics1,2,3,4,5,6,7,8_ChaptersALL.pdfEconometrics1,2,3,4,5,6,7,8_ChaptersALL.pdf
Econometrics1,2,3,4,5,6,7,8_ChaptersALL.pdf
 
MAC411(A) Analysis in Communication Researc.ppt
MAC411(A) Analysis in Communication Researc.pptMAC411(A) Analysis in Communication Researc.ppt
MAC411(A) Analysis in Communication Researc.ppt
 
Regression models for panel data
Regression models for panel dataRegression models for panel data
Regression models for panel data
 
Application of linear programming techniques to practical
Application of linear programming techniques to practicalApplication of linear programming techniques to practical
Application of linear programming techniques to practical
 

Recently uploaded

How to Interpret Trends in the Kalyan Rajdhani Mix Chart.pdf
How to Interpret Trends in the Kalyan Rajdhani Mix Chart.pdfHow to Interpret Trends in the Kalyan Rajdhani Mix Chart.pdf
How to Interpret Trends in the Kalyan Rajdhani Mix Chart.pdf
Chart Kalyan
 
AWS Cloud Cost Optimization Presentation.pptx
AWS Cloud Cost Optimization Presentation.pptxAWS Cloud Cost Optimization Presentation.pptx
AWS Cloud Cost Optimization Presentation.pptx
HarisZaheer8
 
Skybuffer SAM4U tool for SAP license adoption
Skybuffer SAM4U tool for SAP license adoptionSkybuffer SAM4U tool for SAP license adoption
Skybuffer SAM4U tool for SAP license adoption
Tatiana Kojar
 
HCL Notes und Domino Lizenzkostenreduzierung in der Welt von DLAU
HCL Notes und Domino Lizenzkostenreduzierung in der Welt von DLAUHCL Notes und Domino Lizenzkostenreduzierung in der Welt von DLAU
HCL Notes und Domino Lizenzkostenreduzierung in der Welt von DLAU
panagenda
 
WeTestAthens: Postman's AI & Automation Techniques
WeTestAthens: Postman's AI & Automation TechniquesWeTestAthens: Postman's AI & Automation Techniques
WeTestAthens: Postman's AI & Automation Techniques
Postman
 
Best 20 SEO Techniques To Improve Website Visibility In SERP
Best 20 SEO Techniques To Improve Website Visibility In SERPBest 20 SEO Techniques To Improve Website Visibility In SERP
Best 20 SEO Techniques To Improve Website Visibility In SERP
Pixlogix Infotech
 
Skybuffer AI: Advanced Conversational and Generative AI Solution on SAP Busin...
Skybuffer AI: Advanced Conversational and Generative AI Solution on SAP Busin...Skybuffer AI: Advanced Conversational and Generative AI Solution on SAP Busin...
Skybuffer AI: Advanced Conversational and Generative AI Solution on SAP Busin...
Tatiana Kojar
 
Fueling AI with Great Data with Airbyte Webinar
Fueling AI with Great Data with Airbyte WebinarFueling AI with Great Data with Airbyte Webinar
Fueling AI with Great Data with Airbyte Webinar
Zilliz
 
Serial Arm Control in Real Time Presentation
Serial Arm Control in Real Time PresentationSerial Arm Control in Real Time Presentation
Serial Arm Control in Real Time Presentation
tolgahangng
 
Let's Integrate MuleSoft RPA, COMPOSER, APM with AWS IDP along with Slack
Let's Integrate MuleSoft RPA, COMPOSER, APM with AWS IDP along with SlackLet's Integrate MuleSoft RPA, COMPOSER, APM with AWS IDP along with Slack
Let's Integrate MuleSoft RPA, COMPOSER, APM with AWS IDP along with Slack
shyamraj55
 
Ocean lotus Threat actors project by John Sitima 2024 (1).pptx
Ocean lotus Threat actors project by John Sitima 2024 (1).pptxOcean lotus Threat actors project by John Sitima 2024 (1).pptx
Ocean lotus Threat actors project by John Sitima 2024 (1).pptx
SitimaJohn
 
Nordic Marketo Engage User Group_June 13_ 2024.pptx
Nordic Marketo Engage User Group_June 13_ 2024.pptxNordic Marketo Engage User Group_June 13_ 2024.pptx
Nordic Marketo Engage User Group_June 13_ 2024.pptx
MichaelKnudsen27
 
GraphRAG for Life Science to increase LLM accuracy
GraphRAG for Life Science to increase LLM accuracyGraphRAG for Life Science to increase LLM accuracy
GraphRAG for Life Science to increase LLM accuracy
Tomaz Bratanic
 
5th LF Energy Power Grid Model Meet-up Slides
5th LF Energy Power Grid Model Meet-up Slides5th LF Energy Power Grid Model Meet-up Slides
5th LF Energy Power Grid Model Meet-up Slides
DanBrown980551
 
Monitoring and Managing Anomaly Detection on OpenShift.pdf
Monitoring and Managing Anomaly Detection on OpenShift.pdfMonitoring and Managing Anomaly Detection on OpenShift.pdf
Monitoring and Managing Anomaly Detection on OpenShift.pdf
Tosin Akinosho
 
Unlock the Future of Search with MongoDB Atlas_ Vector Search Unleashed.pdf
Unlock the Future of Search with MongoDB Atlas_ Vector Search Unleashed.pdfUnlock the Future of Search with MongoDB Atlas_ Vector Search Unleashed.pdf
Unlock the Future of Search with MongoDB Atlas_ Vector Search Unleashed.pdf
Malak Abu Hammad
 
Operating System Used by Users in day-to-day life.pptx
Operating System Used by Users in day-to-day life.pptxOperating System Used by Users in day-to-day life.pptx
Operating System Used by Users in day-to-day life.pptx
Pravash Chandra Das
 
GenAI Pilot Implementation in the organizations
GenAI Pilot Implementation in the organizationsGenAI Pilot Implementation in the organizations
GenAI Pilot Implementation in the organizations
kumardaparthi1024
 
Finale of the Year: Apply for Next One!
Finale of the Year: Apply for Next One!Finale of the Year: Apply for Next One!
Finale of the Year: Apply for Next One!
GDSC PJATK
 
Choosing The Best AWS Service For Your Website + API.pptx
Choosing The Best AWS Service For Your Website + API.pptxChoosing The Best AWS Service For Your Website + API.pptx
Choosing The Best AWS Service For Your Website + API.pptx
Brandon Minnick, MBA
 

Recently uploaded (20)

How to Interpret Trends in the Kalyan Rajdhani Mix Chart.pdf
How to Interpret Trends in the Kalyan Rajdhani Mix Chart.pdfHow to Interpret Trends in the Kalyan Rajdhani Mix Chart.pdf
How to Interpret Trends in the Kalyan Rajdhani Mix Chart.pdf
 
AWS Cloud Cost Optimization Presentation.pptx
AWS Cloud Cost Optimization Presentation.pptxAWS Cloud Cost Optimization Presentation.pptx
AWS Cloud Cost Optimization Presentation.pptx
 
Skybuffer SAM4U tool for SAP license adoption
Skybuffer SAM4U tool for SAP license adoptionSkybuffer SAM4U tool for SAP license adoption
Skybuffer SAM4U tool for SAP license adoption
 
HCL Notes und Domino Lizenzkostenreduzierung in der Welt von DLAU
HCL Notes und Domino Lizenzkostenreduzierung in der Welt von DLAUHCL Notes und Domino Lizenzkostenreduzierung in der Welt von DLAU
HCL Notes und Domino Lizenzkostenreduzierung in der Welt von DLAU
 
WeTestAthens: Postman's AI & Automation Techniques
WeTestAthens: Postman's AI & Automation TechniquesWeTestAthens: Postman's AI & Automation Techniques
WeTestAthens: Postman's AI & Automation Techniques
 
Best 20 SEO Techniques To Improve Website Visibility In SERP
Best 20 SEO Techniques To Improve Website Visibility In SERPBest 20 SEO Techniques To Improve Website Visibility In SERP
Best 20 SEO Techniques To Improve Website Visibility In SERP
 
Skybuffer AI: Advanced Conversational and Generative AI Solution on SAP Busin...
Skybuffer AI: Advanced Conversational and Generative AI Solution on SAP Busin...Skybuffer AI: Advanced Conversational and Generative AI Solution on SAP Busin...
Skybuffer AI: Advanced Conversational and Generative AI Solution on SAP Busin...
 
Fueling AI with Great Data with Airbyte Webinar
Fueling AI with Great Data with Airbyte WebinarFueling AI with Great Data with Airbyte Webinar
Fueling AI with Great Data with Airbyte Webinar
 
Serial Arm Control in Real Time Presentation
Serial Arm Control in Real Time PresentationSerial Arm Control in Real Time Presentation
Serial Arm Control in Real Time Presentation
 
Let's Integrate MuleSoft RPA, COMPOSER, APM with AWS IDP along with Slack
Let's Integrate MuleSoft RPA, COMPOSER, APM with AWS IDP along with SlackLet's Integrate MuleSoft RPA, COMPOSER, APM with AWS IDP along with Slack
Let's Integrate MuleSoft RPA, COMPOSER, APM with AWS IDP along with Slack
 
Ocean lotus Threat actors project by John Sitima 2024 (1).pptx
Ocean lotus Threat actors project by John Sitima 2024 (1).pptxOcean lotus Threat actors project by John Sitima 2024 (1).pptx
Ocean lotus Threat actors project by John Sitima 2024 (1).pptx
 
Nordic Marketo Engage User Group_June 13_ 2024.pptx
Nordic Marketo Engage User Group_June 13_ 2024.pptxNordic Marketo Engage User Group_June 13_ 2024.pptx
Nordic Marketo Engage User Group_June 13_ 2024.pptx
 
GraphRAG for Life Science to increase LLM accuracy
GraphRAG for Life Science to increase LLM accuracyGraphRAG for Life Science to increase LLM accuracy
GraphRAG for Life Science to increase LLM accuracy
 
5th LF Energy Power Grid Model Meet-up Slides
5th LF Energy Power Grid Model Meet-up Slides5th LF Energy Power Grid Model Meet-up Slides
5th LF Energy Power Grid Model Meet-up Slides
 
Monitoring and Managing Anomaly Detection on OpenShift.pdf
Monitoring and Managing Anomaly Detection on OpenShift.pdfMonitoring and Managing Anomaly Detection on OpenShift.pdf
Monitoring and Managing Anomaly Detection on OpenShift.pdf
 
Unlock the Future of Search with MongoDB Atlas_ Vector Search Unleashed.pdf
Unlock the Future of Search with MongoDB Atlas_ Vector Search Unleashed.pdfUnlock the Future of Search with MongoDB Atlas_ Vector Search Unleashed.pdf
Unlock the Future of Search with MongoDB Atlas_ Vector Search Unleashed.pdf
 
Operating System Used by Users in day-to-day life.pptx
Operating System Used by Users in day-to-day life.pptxOperating System Used by Users in day-to-day life.pptx
Operating System Used by Users in day-to-day life.pptx
 
GenAI Pilot Implementation in the organizations
GenAI Pilot Implementation in the organizationsGenAI Pilot Implementation in the organizations
GenAI Pilot Implementation in the organizations
 
Finale of the Year: Apply for Next One!
Finale of the Year: Apply for Next One!Finale of the Year: Apply for Next One!
Finale of the Year: Apply for Next One!
 
Choosing The Best AWS Service For Your Website + API.pptx
Choosing The Best AWS Service For Your Website + API.pptxChoosing The Best AWS Service For Your Website + API.pptx
Choosing The Best AWS Service For Your Website + API.pptx
 

Notes1

  • 1. ECO341K Introduction to Econometrics () Lecture 1 1 / 31
  • 2. Lecture 1 - Outline Course Outline Course objectives Textbook Assessment () Lecture 1 2 / 31
  • 3. Course Objectives The aim of the course is to help you develop a working knowledge of econometrics and its applications to real-world economic data. The course will cover a range of topics: − Simple Regression − Multiple Regression − estimation, inference − extensions − Learn a specialised econometric software package By the end of session you will be able to: =⇒ read and understand most analyses performed by econometricians =⇒ conduct your own empirical research. () Lecture 1 3 / 31
  • 4. Textbooks: The required text is: J.M. Wooldridge (2008) Introductory Econometrics: A Modern Approach. 4th Edition 3rd edition is fine A useful companion book: J.M. Wooldridge (2008) Student Solution Manual for Introductory Econometrics available electronically through the text website. () Lecture 1 4 / 31
  • 5. Assessment 1. Weekly assignments (drop lowest) 10% 2. Two Mid-Term Exams 50% 3. Final Exam 40% () Lecture 1 5 / 31
  • 6. Course Website (Blackboard) This site will contain: Lecture handouts (syllabus, etc) Lecture notes for each class Homework assignments, including data sets Homework solutions Data sets and STATA logs for in class examples Special announcements (sent via email also) () Lecture 1 6 / 31
  • 7. Topics covered – rough timeline Topic Classes Approx. Introduction 2 Simple Linear Regression 3 Multiple Linear Regression 5 Small Sample Inference 2 Large Sample Inference 1 Further Issues including Dummies 4 Time Series 2 Panel Data 2 Qualitative Response 2 Endogenous Regressors and IV 2 () Lecture 1 7 / 31
  • 8. Software – STATA It is crucial that you have access to STATA and that you do the empirical exercises Access Options: 1 Timeshare through the web from anywhere 2 Purchase through STATA gradplan – see syllabus – about $100 3 Labs in Burdine? What does STATA look like? Lets see! () Lecture 1 8 / 31
  • 9. Lecture 2 - Outline The Nature of Econometrics What is Econometrics ? The Structure of Economic Data Causality ‘Ceteris Paribus’ and correlation () Lecture 1 9 / 31
  • 10. What is Econometrics ? Econometrics concerns the use of statistical methods in: estimating economic relationships testing economic theory evaluating government and business policy. forecasting and prediction () Lecture 1 10 / 31
  • 11. Applications Econometrics has many wider applications, for example 1 the effect of class size or spending on student performance 2 the effect of education on wages 3 testing for discrimination in labour and credit markets 4 the effect of minimum wages on unemployment 5 the effect of CEO compensation on firm performance 6 the effect of govt policies on inflation and economic growth Common feature: Econometrics deals with nonexperimental data drawn from observing economic events (the data are not collected through controlled experiments in a laboratory). () Lecture 1 11 / 31
  • 12. Conducting Empirical Economic Analysis Econometrics is used in every branch of applied economics Empirical Analysis uses data to test the predictions of a theory or estimate a relationship. An empirical analysis generally consists of 1 An economic model - which may be formally developed (e.g. derivation of consumer demand equations from a model of utility maximisation) or based on intuitive reasoning. 2 An econometric model - which requires specifying the nature of the relationship between variables () Lecture 1 12 / 31
  • 13. Conducting Empirical Economic Analysis Example of an econometric model – a multiple regression model: wage = β 0 + β 1 .educ + β 2 .exper + υ where: wage = hourly wage rate educ = years of education exper = years of employment β 0 , β 1 , β 2 = parameters which describe the direction and strength of the relationship between the wage and the factors which determine it υ = error term (or ‘disturbance term’) which contains unobservable factors (innate ability, job characteristics,...) () Lecture 1 13 / 31
  • 14. Conducting Empirical Economic Analysis With this model a range of hypotheses can be stated in terms of the unknown parameters ( β 0 , β 1 , β 2 ). Empirical analysis requires data, and econometric methods are used to estimate the parameters of the model and to formally test hypotheses of interest. The model can also be used to make predictions. Methods need to take into account the structure of the data 4 main data structures: cross-sectional data, time-series data, pooled cross sections, panel data () Lecture 1 14 / 31
  • 15. The Structure of Economic Data A. Cross-Sectional Data sample of individuals, households, firms, countries or other units taken at a point in time (“snapshot”) usually obtained by random sampling from the population (and the sample is “representative”) cross-sectional data are widely used in economics and other social sciences. Very common in applied micro such as labor economics, public economics, industrial organization, health economics =⇒ this is the main data structure we will focus on if randomly sampled, order of observations is unimportant () Lecture 1 15 / 31
  • 16. Cross-Sectional Data Examples of a cross-sectional data set: (a) Data set on wages and other personal characteristics () Lecture 1 16 / 31
  • 17. Cross-Sectional Data (b) Data set on economic growth and country characteristics () Lecture 1 17 / 31
  • 18. Time Series Data B. Time Series Data observations on a variable (or set of variables) over time E.g. stock prices, cpi, gdp, crime rates. The chronological ordering of observations is important =⇒ observations cannot be assumed to be independent over time, most economic time series are (strongly) related to their recent histories =⇒ econometric model needs to take this into account Data frequency is important, due to seasonal patterns (e.g. daily, weekly, monthly, quarterly, annual) () Lecture 1 18 / 31
  • 19. Time Series Data Example: data on minimum wages () Lecture 1 19 / 31
  • 20. Pooled Cross Sections C. Pooled Cross Sections some data sets have both cross-sectional and time series properties. E.g. 2 cross-sectional family surveys in US - one in 2000 recording income, expenditure, family size,... - a new random sample in 2005, with same questions =⇒ pool them to increase sample size =⇒ no family is in the sample for the 2 years () Lecture 1 20 / 31
  • 21. Pooled Cross Sections Pooled cross-sections can be an effective way to analyse govt policies (e.g. look at economic relationships before and after the policy was introduced) Pooled cross sections are also very useful for studying group dynamics over time (e.g. how are average wages evolving for the group who entered the labour market during the last recession; what determines changes in median house prices in specific areas of US) Can analyse like a standard cross-section, though need to allow for changes in variables over time () Lecture 1 21 / 31
  • 22. Pooled Cross Sections Example: Two years of house prices () Lecture 1 22 / 31
  • 23. Panel Data D. Panel (or Longitudinal) Data Consists of a time series for each cross-sectional unit =⇒ follow the same individuals / firms etc. over time Example: crime statistics at the city level – to study things like effect of law enforcement or economic conditions on crime () Lecture 1 23 / 31
  • 24. Panel Data panel data has some important advantages over other data structures (we can control for certain types of unobserved characteristics, and can study lags in behaviour). some important questions cannot be answered without panel data =⇒ e.g. studying dynamics behaviour of individual units briefly consider simple panel data methods () Lecture 1 24 / 31
  • 25. Causal Effects, Ceteris Paribus and Correlation Causality and Ceteris Paribus in Econometric Analysis In most tests of economic theory, and for evaluating policy, the goal is to infer a causal effect of one variable on another Most propositions in economics are ‘ceteris paribus’ by nature Example: the responsiveness of the demand for coffee to price - holding all other factors constant (such as income, prices of other goods). If these other factors are not constant, we cannot determine the casual effect of a price change on quantity demanded not feasible to literally hold ‘all else equal’ .... but have enough other factors been held constant to infer causality ? properly applied, econometric methods can simulate a ceteris paribus experiment (⇒) economic theory and econometrics together can help us uncover causal effects. () Lecture 1 25 / 31
  • 26. Causality and Correlation We may recall (hopefully!) from Prob/Stats ECO329 the concept of correlation and covariance Measures of linear association between 2 variables Example: Education and Wages. Do people with higher levels of education tend to have higher wages? Do people with higher wages have more education? Correlation is a measure of this assocation Let r be the correlation between wage for person i - say yi and education xi () Lecture 1 26 / 31
  • 27. Recall (?????) that, ∑n=1 (xi − x )(yi − y ) i ¯ ¯ r= n n ∑i =1 (xi − x )2 ∑i =1 (yi − y )2 ¯ ¯ r > 0 means that large y are associated with large x r < 0 means that large y are associated with small x r = 0 means no linear association could be nonlinear could be no association at all () Lecture 1 27 / 31
  • 28. Keep in Mind One cannot conclude causation by simply looking at correlation Note r is symmetric in x and y so: does x cause y does y cause x Even if one thought it went a particular direction there may be other mitigating factors that need to be taken into account () Lecture 1 28 / 31
  • 29. Examples: Wages and Education are correlated (as we will see) Which direction is plausible and why? Other factors? () Lecture 1 29 / 31
  • 30. Examples: Sports In watching football I often hear/see statements that are of the form: “When team x (insert your favorite) runs the ball more than 30 times they win 80% of the games but when they run less than 30 times they only win 30% of the games.” What the heck does this mean? Clearly it looks like there is a correlation between number of running plays and the chance of winning. But is it a causal effect? If it were causal then it would mean the coach could just make sure he runs the ball at least 30 times (regardless) and will win more often Is this how it works? () Lecture 1 30 / 31
  • 31. Examples: In the popular press there are many instances of people trying to infer a causal relationship between variables based simply on correlations between two variables. Try and listen for examples of this. Now lets play with some data! 1 Wage data – relation between education and wages 2 Test score data – relation between class size and standardized test scores () Lecture 1 31 / 31