A Fresh Look at Marine Magnetic Anomalies, One of the Key Datasets in the Development of Plate Tectonics by Ian Norton - 2014 PaleoGIS & PaleoClimate Users Conference
PALEOMAP Project Update by Christopher R. Scotese: 2013/Third Annual PaleoGIS...The Rothwell Group, L.P.
This document provides an update on the PALEOMAP Project. It thanks sponsors who have supported the PaleoAtlas. It highlights accomplishments in 2013, including a new global plate model, finalizing over 100 paleogeographic time slices in the PaleoAtlas, and beginning work on an Earth System Archive to define over 50 paleoclimate and paleoenvironmental variables. Plans for 2014 include further developing the Earth System Archive with additional paleoclimate simulations, adding new data layers to the PaleoAtlas, and continuing work on a book documenting Earth's history.
PaleoClimate and PaleoRun Overview by Arwen Vaughan, Rothwell: 2013/Third Ann...The Rothwell Group, L.P.
This document introduces PaleoClimate and PaleoRun software tools. PaleoClimate is a desktop application that models ancient climate conditions like temperature, wind, and ocean currents. It was built on earlier work and complements the PaleoGIS tool. PaleoRun allows batch processing of multiple PaleoGIS or PaleoClimate jobs through a single XML configuration file for scenarios like running long jobs or regularly scheduled reconstructions.
The Southern Thomson Project aims to better understand the geological character and mineral potential of the southern Thomson Orogen through new data collection and analysis. Stratigraphic drilling is planned to fill knowledge gaps. Recent work includes airborne electromagnetic surveys to map basement geology beneath cover, new isotopic dating to determine the timing of magmatism and deformation, and geochemical sampling. Upcoming stratigraphic drilling targets will be informed by pre-drill geophysics and aim to increase understanding of the regional geology and mineral systems to reduce exploration risk.
SeisTool is a seismic rock physics tool that supports exploration and development geoscientists in identifying and characterizing reservoir properties from seismic data. It consists of three modules - SeisRP for computing rock properties, SeisMod for sensitivity analysis, and SeisCar for reservoir characterization through linear inversion. SeisRP computes reflectivities and properties from well logs and allows fluid substitution. SeisMod will model perturbed reservoir properties. SeisCar estimates reservoir properties like porosity from seismic attributes through inversion. The tool reduces errors and improves productivity by automating workflows and attribute computation.
The Final Seminar of the Project for Assessment of Earthquake Disaster Risk for the Kathmandu Valley in Nepal was held on 14 February 2018.
The public seminar was held three times during the project.
The Final Seminar, “ Understanding Disaster Risks and Moving Towards DRR and Resilience”, presented on the activities and accomplishment of the project, construction of robust and resilient society against natural disaster risk.
Thank you all for your support and enthusiastic participation in this seminar.
Presentation: Overview of Hazard Assessment Results
This document proposes a mission to study unexplained anomalies observed during spacecraft hyperbolic flybys of Earth. The mission would have two phases: Phase A would place cubesats into highly elliptical orbits to observe anomalies during perigee passes and hyperbolic flybys. Phase B would launch a "mothership" satellite carrying additional cubesats into a Venus flyby trajectory to observe anomalies during the Earth hyperbolic flyby. Precise position, velocity and acceleration data would be collected from the cubesats during flybys to better understand if the anomalies represent real phenomena. The goal is to obtain tracking data from at least 12 flyby events within 5 years to evaluate theories regarding the flyby anomalies.
This document summarizes a sequence stratigraphic interpretation and play fairway analysis project conducted by TGS in the Labrador Sea utilizing seismic and well data. The project aims to provide a geologic model of basin deposition over time, delineate reservoir and seal distributions related to tectonic activity, and identify prospective hydrocarbon leads. TGS integrated well log and seismic data to define a sequence stratigraphy framework and map 14 depositional sequences. Interpreted data is delivered in various formats along with maps, horizons, faults, and a report summarizing the project, basin modeling, and fluid modeling. Benefits include a foundational exploration tool, shortened exploration timelines, insights into regional deposition, reduced risk through source-reservoir
The document discusses a watershed modeling system called BCube that aims to decrease the effort of watershed initialization by brokering various global geospatial and environmental data required for watershed modeling. BCube allows researchers to focus on scientific research by providing a single access point to the different data formats and sources for elevation, soils, land use, weather, and other data needed to set up and run watershed models. The document provides an overview of the types of data BCube can broker and the workflow where a scientist requests data for a watershed area and BCube returns the available options to choose from.
This document summarizes the Geologic Time Scale 2004, which provides an updated framework for understanding Earth's history by integrating stratigraphic and chronometric data. Major developments since 1989 include refined international stratigraphic units, new high-precision dating techniques, and statistical methods. The construction of GTS2004 incorporated different techniques depending on data availability and involved specialists from various fields. Anticipated advances by 2008 include formally defining all Phanerozoic boundaries and improving dating and stratigraphy of certain intervals.
2015 Broken Hill Resources Investment Symposium - Geological Survey of South ...Symposium
"Curnamona Proterozoic Geochronology".
Liz Jagodzinski, Geochronologist, Geological Survey of South Australia.
Technical presentation at 2015 Broken Hill Resources Investment symposium.
Marion Environmental, Inc. completed three major projects including constructing a strapping chart for a jet fuel tank that required calculating the volume for every 1/16th inch, directing excavation and soil sampling after gasoline and diesel spills, and calculating stockpile volumes and weights. For senior design projects, one involved designing a brine extraction well requiring subsurface analysis and extensive calculations, and another was a phase 1 environmental assessment analyzing contamination levels. Subsurface site characterization projects included boring log descriptions, assessing halite dissolution analyzing geophysical logs, and producing a conceptual model of pesticide contamination as a group leader. Field geology projects in South Dakota included constructing and correlating stratigraphic columns, geologic mapping of sedimentary and metamorphic
Greetings all,
Nowadays, several datasets are -or will be- available in a near future to improve operational forecasting in most aspects, like the
ocean dynamics modeling, and the assimilation efficiency, that aims now to optimize the combination of temperature/salinity in
situ profiles, drifter's velocities, and sea surface height deduce from altimeter's data and GRACE or future Goce geoid. But also
strengthen forecasting system's applications, like the climate monitoring. For all these issues, an optimal use of ocean data,
always too sparse and not enough numerous, is mandatory.
Such studies are at the heart of this Newsletter issue. It begins with a Rio M.H. and Hernandez F. review of the Goce Mission,
dedicated to focus and document the shortest scales of the Earth's gravity field. Goce satellite is due to fly in December 2007.
With the next article Guinéhut S. and Larnicol G. investigate the influence of the in situ temperature profiles sampling on the
thermosteric sea level estimation. They show that the impact is not negligible, and can introduce large errors in the estimation. In
the second article, Benkiran M. and Greiner E. are evaluating the benefits of the drifter's velocities assimilation in the Mercator
Océan 1/3° Tropical and North Atlantic operational system. A description of the assimilation scheme upgrade to take into account
velocity control is given. Castruccio F. & al. describe in the third article the performance of an improved MDT reference for
altimetric data assimilation. They concentrate their study on the Tropical Pacific Ocean. Finally, the Newsletter comes to an end
with the Benkiran M. article. In his study, based on the 1/3° Mercator system, the impact of several altimeters data on the
assimilation performance is assessed
Have a good read
The document summarizes key discussions from a workshop about connecting surface geology to features resolved by EarthScope data. Some of the main challenges discussed include:
1) Scale and resolution differences between surface geology expressions and features resolved by EarthScope data.
2) Whether seismologists using EarthScope spatial constraints can help geologists study significantly older problems.
3) That seismic velocity contrasts are largely due to temperature, and features below 200km depth often represent old subducted slabs and mantle downwellings from the past. Interpreting present-day structures requires geological context.
This document summarizes a study that used multisensor fusion of altimetry data to monitor changes in ice sheets from 2003 to 2009. The study reconstructed spatial and temporal elevation changes across Greenland by combining satellite laser altimetry from ICESat with airborne laser data. Results showed complex patterns of thickening and thinning, with average rates of 257 km3/yr of ice sheet loss, equivalent to 232 Gt/yr of mass loss.
The document discusses several basin modeling software packages that can be used to analyze sedimentary basins and aid in hydrocarbon exploration. It describes the key capabilities of BasinMod, BMT, Genesis, and other tools for modeling the burial and thermal histories of basins, source rock maturation, and hydrocarbon migration and trapping over geologic time in order to better understand petroleum systems. The modeling software packages employ techniques like backstripping, thermal modeling, and fluid flow modeling to simulate basin evolution and hydrocarbon generation.
This study aimed to assess groundwater resources in the Middle East and North Africa region. It estimated total groundwater reserves in the region to be 1.28 million km3, with the majority located in the large sedimentary basins of North Africa and the Arabian Peninsula. Between 2003 and 2014, groundwater storage declined in 8 of the 16 countries analyzed, including Algeria, Iraq, and Saudi Arabia. However, overall changes were small relative to total reserves, and did not pose an immediate threat. The study integrated multiple datasets on depth to water, sediment thickness, lithology, and porosity to develop distributed groundwater reserve and storage change estimates for each country.
The document discusses coastal monitoring in Newfoundland and Labrador. It describes analyzing shoreline change in Point Verde using the Digital Shoreline Analysis System (DSAS). DSAS calculated that annual shoreline retreat ranges from 0.54 m/year to 0.15 m/year, indicating erosion of up to 12 m over the study period from 1993 to 2013. The document also outlines steps to display coastal monitoring data and shoreline change statistics on the Newfoundland and Labrador GeoScience Atlas to provide public access to the information.
This document discusses the use of pedotransfer functions (PTFs) to estimate soil hydraulic properties for use in soil water balance models. The performance of published PTFs developed by Vereecken et al. (1989, 1990) were evaluated by comparing simulated soil moisture contents, pressure heads, and drainage fluxes using estimated soil hydraulic properties against measured field data from a test site. Simulations using estimated properties overpredicted soil moisture contents and drainage fluxes compared to simulations using measured soil hydraulic properties from the test site. The study highlights the need for further evaluation of PTFs against field measurements of soil water balance components before widespread application in models.
Evaluation of Standar & Regional Satellite Chlorophyll-a Algorithms for MODIS...Anisa Aulia Sabilah
Review Jurnal Penginderaan Jauh Sinar Tampak "Evaluation of Standar & Regional Satellite Chlorophyll-a Algorithms for MODIS in the Bohai & Yellow Seas, China" oleh Wang et al. (2019)
The document summarizes a study on designing optimal transfer trajectories between Earth and the Moon using a combination of impulsive and continuous thrust. It formulates the trajectory optimization problem using the planar circular restricted three-body problem considering the gravitational attractions of Earth and Moon. The continuous and dynamic optimization is reformulated as a discrete problem using direct transcription and collocation methods, then solved using nonlinear programming. The results show different trajectory types can be obtained by varying design parameters, and all trajectories allow for ballistic lunar orbit capture without thrusting.
This document provides an overview of the East Riverina Mapping Project, a 5-year multi-disciplinary project to enhance geological data in an underexplored region. The project aims to develop higher resolution mapping, constrain geological timing, and develop exploration models through field mapping, geochronology, geophysics, structural studies, and more. Results to date include new lithological and age data, improved geophysical interpretations, and studies seeking to better understand the crustal architecture and mineral prospectivity of the region.
TGS has generated a sequence stratigraphic interpretation and play fairway analysis project for the Northeast Newfoundland Shelf utilizing new seismic survey data and available well data. They mapped 21 sequences and delineated reservoir distribution over time. Deliverables include structure maps, horizons, leads, faults, and depositional environment maps. The benefits are a reduced exploration cycle time and risk through understanding basin development and delineating source, seal, and reservoir distributions. Clients must license 50% of the underlying seismic data.
Arc Surveying & Mapping was contracted to survey the Cypress Creek Drainage Basin in Memphis, Tennessee as part of a project to map drainage basins and create a GIS database. The project involved surveying over 4,500 acres that contained over 2,000 drainage structures and 4 miles of canals. Arc Surveying & Mapping used robotic total stations and RTK GPS to locate and measure over 2,000 structures and perform cross sections every 500 feet along canals and ditches. They also surveyed bridges and worked on the project for over 4 months collecting data to contribute to the drainage basin mapping.
1) The document outlines Daniela Vlad's doctoral oral examination on the geochemistry of mudgases and factors controlling their variability.
2) It presents the methodology used including sequence stratigraphic principles, gas geochemistry models, and mineralogical analysis of wireline logs.
3) The results show carbon isotope values in mudgases correspond to major stratigraphic surfaces and lithology changes, indicating gas compartmentalization both regionally and locally within formations.
Earth–mars transfers with ballistic escape and low thrust captureFrancisco Carvalho
This paper presents novel low-energy transfers between Earth and Mars that exploit natural dynamics and low-thrust propulsion. Ballistic escape orbits are designed using the Moon-perturbed Sun-Earth system, while low-thrust capture orbits are designed in the Sun-Mars system. The ballistic escape and low-thrust capture trajectories are matched and optimized in the full n-body problem to find efficient transfers between Earth and Mars orbits.
Coastal Landcover Trends & Applications in the NWEric Morris
This document discusses the Coastal Change Analysis Program (C-CAP), a NOAA program that produces land cover and change information for coastal regions of the United States. C-CAP creates national land cover maps every 5 years using remote sensing and updates coastal areas of the National Land Cover Database. It focuses on detailed mapping of wetland areas. The document outlines the history of C-CAP mapping efforts, describes the land cover classes mapped, and provides an example of analyzing land cover change between 1996-2010 in a coastal region where development increased by 8,887 square miles and forest and wetlands decreased slightly. It also demonstrates tools for analyzing high resolution C-CAP data and land cover change over time at local scales.
- Gravity and magnetic mapping techniques measure small variations in the Earth's gravity and magnetic fields to infer properties of subsurface geology.
- Gravity mapping uses highly sensitive spring balances called gravimeters to detect variations as small as 0.001 mgal, while magnetic mapping uses electronic instruments to continuously record magnetic field variations.
- Corrections must be applied to gravity and magnetic data to account for factors like latitude, elevation, density variations, and temporal changes in the magnetic field.
- Interpretation of the residual anomaly maps provides constraints on the locations, shapes, and depths of subsurface density and magnetic sources, allowing inference of geological structures.
Magnetic materials have several key properties:
1. They can attract or repel other magnetic materials due to magnetic dipole moments within the material's atoms.
2. Materials have a magnetic moment and magnetic susceptibility that determine how strongly they are magnetized in response to an external magnetic field.
3. Different types of magnetism (diamagnetism, paramagnetism, ferromagnetism, antiferromagnetism) arise based on how the atomic magnetic dipoles interact with each other and external fields.
The Earth's magnetic field is generated by electrical currents in the liquid outer core. The magnetic field traps charged particles from the solar wind in the Van Allen radiation belts. Rocks record the magnetic field at the time of formation, allowing scientists to study how the magnetic poles have reversed in the past. The magnetic field shields the Earth from solar wind and cosmic rays.
1) Geophysical surveys have been using measurements of the Earth's magnetic field for nearly 500 years since Gilbert showed that the Earth behaves like a large magnet.
2) Gravity and magnetic surveying methods are similar in that they both measure naturally occurring fields (potential fields), can use identical physical representations like magnetic monopoles, and have similar data acquisition and interpretation.
3) However, magnetic surveying also has differences from gravity - magnetic susceptibility of rocks can vary more than density, magnetism can be attractive or repulsive unlike gravity, magnetic sources always occur in pairs unlike gravity, and the magnetic field is time-dependent unlike gravity.
Similarities and differences between gravity and magneticAkhtar Hussain
Geophysical exploration techniques that employ gravity and magnetic methods are passive, as they measure naturally occurring fields of the earth. Both gravity and magnetic fields are vector fields and force fields that exert force at the speed of light. While there are some similarities, there are also key differences between the two methods. The fundamental parameter controlling gravity variations is rock density, while the parameter for magnetic variations is magnetic susceptibility, which can vary widely even within the same rock type. Additionally, the gravitational field is always perpendicular to the earth's surface, whereas the magnetic field direction changes by location.
The document discusses the Devil's Sea, also known as the Dragon's Triangle, an area of the Pacific Ocean located off the coast of Japan known for mysterious disappearances and anomalies. In 1952, the Japanese government sent a research vessel, the Kaio Maru No. 5, to investigate the area, but the ship and its 31 crew members disappeared without a trace. Theories for what occurs in the region include volcanic activity, methane gas eruptions from hydrates on the ocean floor, and even portals to other dimensions. The name "Dragon's Triangle" comes from a Chinese legend of dragons living beneath the sea in that area.
Similar to A Fresh Look at Marine Magnetic Anomalies, One of the Key Datasets in the Development of Plate Tectonics by Ian Norton - 2014 PaleoGIS & PaleoClimate Users Conference
This document summarizes a study that used wide-swath interferometric synthetic aperture radar (InSAR) time series to map large-scale ground deformation over the Danakil depression in the Afar region of Ethiopia between 2006 and 2009. The time series analysis revealed deformation signals consistent with magmatic intrusions and inflation/deflation of volcanic centers. Modeling of the deformation supported deep magma intrusion beneath the central segment and lateral magma propagation and chamber inflation beneath Dabbahu volcano in the northern segment. The study demonstrated the potential of wide-swath InSAR time series for mapping long-wavelength ground deformation over large areas.
On 17/10/2013 TU Delft Climate Institute organised the symposium The Greenland and Antarctic ice sheets: present, future, and unknowns. This is one of the four presentations given there.
http://www.tudelft.nl/nl/actueel/agenda/event/detail/symposium-tu-delft-climate-institute-17th-october-2013/
The International Journal of Engineering & Science is aimed at providing a platform for researchers, engineers, scientists, or educators to publish their original research results, to exchange new ideas, to disseminate information in innovative designs, engineering experiences and technological skills. It is also the Journal's objective to promote engineering and technology education. All papers submitted to the Journal will be blind peer-reviewed. Only original articles will be published.
TH1.T04.2_MULTI-FREQUENCY MICROWAVE EMISSION OF THE EAST ANTARCTIC PLATEAU_IG...grssieee
The document summarizes an experiment called Domex-2 that was conducted at Dome C, Antarctica between 2008-2010 to measure microwave emission from the East Antarctic plateau using ground-based and satellite instruments. Measurements from the Domex-2 radiometers showed high temporal stability of brightness temperatures at vertical polarization but more fluctuation at horizontal polarization as expected. Angular trends from Domex-2 matched well with data from the SMOS satellite. An electromagnetic model was developed and validated against the satellite and ground measurements, demonstrating the mechanisms controlling microwave emission from the ice sheet.
ASEG-PESA-AIG_2016_Abstract_North West Shelf 3D Velocity Modeling_ESTIMAGESLaureline Monteignies
The document describes the creation of a 3D velocity model covering the entire North West Shelf of Australia using seismic and well data. Over 200 seismic surveys and nearly 900 wells were integrated using an innovative 3D modeling approach. The major challenges were honoring geological features at this wide regional scale and ensuring consistency across basins. The resulting geologically consistent model has a depth uncertainty of less than +/-100m even over 100km from wells.
This document provides an overview of various remote sensing and GIS-based techniques used for mineral exploration applications in Africa. It discusses 10 techniques: 1) image processing of satellite data, 2) filtering geophysical data, 3) surface modeling, 4) spatial selection rules and proximity analyses, 5) determining anomalous assay data, 6) estimating resource volumes, 7) resource modeling and drillhole planning, 8) data visualization through fly-throughs, 9) regional context analysis, and 10) considering geological history. Examples are given for each technique to demonstrate how they can be applied to improve mineral exploration efforts. The document emphasizes how data visualization and spatial analysis tools can provide insight into geological datasets.
In the first part of the talk, we will present a sensitivity analysis of a novel sea ice model. neXtSIM is a continuous Lagrangian numerical model that uses an elastobrittle rheology to simulate the ice response to external forces. The response of the model is evaluated in terms of simulated ice drift distances from its initial position and from the mean position of the ensemble. The simulated ice drift is decomposed into advective and diffusive parts that are characterized separately both spatially and temporally and compared to what is obtained with a free-drift model, i.e. when the ice rheology does not play any role. Overall the large-scale response of neXtSIM is correlated to the ice thickness and the wind velocity fields while the free-drift model response is mostly correlated to the wind velocity pattern only. The seasonal variability of the model sensitivity shows the role of the ice compactness and rheology at both local and Arctic scales. Indeed, the ice drift simulated by neXtSIM in summer is close to the free-drift model, while the more compact and solid ice pack is showing a significantly different mechanical and drift behavior in winter. In contrast of the free-drift model, neXtSIM reproduces the sea ice Lagrangian diffusion regimes as found from observed trajectories. The forecast capability of neXtSIM is also evaluated using a large set of real buoy’s trajectories. We found that neXtSIM performs better in simulating sea ice drift, both in terms of forecast error and as a tool to assist search-and-rescue operations. Adaptive meshes, as the one used in neXtSIM, are used to model a wide variety of physical phenomena. Some of these models, in particular those of sea ice movement, use a remeshing process to remove and insert mesh points at various points in their evolution. This represents a challenge in developing compatible data assimilation schemes, as the dimension of the state space we wish to estimate can change over time when these remeshings occur.
In the second part of the talk, we highlight the challenges that such a modeling framework represents for data assimilation setup. We then describe a remeshing scheme for an adaptive mesh in one dimension. The development of advanced data assimilation methods that are appropriate for such a moving and remeshed grid is presented. Finally we discuss the extension of these techniques to two-dimensional models, like neXtSIM.
Ground geophysical surveys use magnetic, electrical, and gravitational measurements to map subsurface rock properties. Magnetics surveys measure the earth's magnetic field and magnetic responses from rocks to map geology and locate magnetic ore bodies. Resistivity and induced polarization (IP) surveys measure electrical properties to detect disseminated sulfides and map stratigraphy. Time-domain electromagnetics (TDEM) uses electromagnetic induction to identify conductive features like ores, groundwater, and permafrost. Geophysical methods provide non-invasive exploration techniques but their results require careful processing and interpretation.
The conductivity structure of the Gediz Graben geothermal area extracted from...Erhan Erdogan
•Interpretation of MT data on extensional tectonic geothermal areas is examined using synthetic and field data.
•Three dimensional conductivity model of Gediz Graben geothermal area is created using seismic sections and used for producing synthetic magnetotelluric data.
•The resolving power of the two and three-dimensional inversion methods is discussed.
•Three dimensional inversion is applied to the field data and presented with real borehole results.
•New geothermal source was discovered using the MT data and three-dimensional inversion results.
Geophysical studies on Dahab area, South Sinai. Egyptosamaabdelraouf1
The document summarizes geophysical studies conducted on the Dahab area in southern Sinai, Egypt. Magnetic, geoelectric, and hydrological studies were performed to determine the sedimentary cover, subsurface structures, and groundwater conditions. Magnetic data showed variations in sediment thickness, with thicker deposits in northwestern grabens. Geoelectric data revealed four subsurface layers and the depth to water-bearing zones. The main aquifer is Quaternary sands and gravels, with thickness ranging from 5-60 meters.
SEISMIC FOR EXPLORING SEABED MINERALS AT THE MID-ATLANTIC RIDGEiQHub
This document discusses a seismic survey conducted in the Mid-Atlantic Ridge to explore seabed minerals. It provides background on the geological features of the survey area, including the Mohn's Ridge slow spreading ridge. It then describes the 2D seismic acquisition using a source vessel and towed streamer, and the processing sequence applied to the data. The document presents some preliminary seismic section examples and interpretations, noting imaging challenges from the 2D nature and short offsets. It concludes by acknowledging the project partners and highlighting the improved geological understanding from the survey.
The GRACE and GRACE Follow-On missions used satellites to measure changes in Earth's gravity field caused by movements of mass, such as water. This allowed for monitoring of terrestrial water storage (TWS) on a global scale. The summaries provided monthly maps of TWS anomalies at coarse spatial resolution of 105 km2. Assimilating these measurements into land surface models helped improve estimates of TWS and its components like snowpack and soil moisture at finer scales. The combined data helped analyze trends, floods, and droughts around the world.
The document describes the SWOT (Surface Water and Ocean Topography) mission and ground system. SWOT will use Ka-band radar interferometry to measure water levels over oceans and inland water bodies. It presents the mission phases from launch to science operations. The ground system will acquire KaRIN instrument data at rates over 600 Mbps and generate large data products like hydrology maps at 50m resolution. Processing will involve geolocation, corrections, and derivation of geophysical parameters from the radar data. The large data volumes and dual ocean/hydrology goals pose challenges for the SWOT ground system.
Research Inventy : International Journal of Engineering and Science is published by the group of young academic and industrial researchers with 12 Issues per year. It is an online as well as print version open access journal that provides rapid publication (monthly) of articles in all areas of the subject such as: civil, mechanical, chemical, electronic and computer engineering as well as production and information technology. The Journal welcomes the submission of manuscripts that meet the general criteria of significance and scientific excellence. Papers will be published by rapid process within 20 days after acceptance and peer review process takes only 7 days. All articles published in Research Inventy will be peer-reviewed.
The document discusses hydrodynamic modeling of riverine, tidal, and hurricane flows in the Gulf of Mexico using the CASCaDE and ADCIRC models. It provides motivation for modeling these flows, describes the hydrodynamic models and modeling framework used, and gives examples of applications for tidal harmonics validation, coastal river modeling, and hurricane surge simulations. The overall goal is to capture local and regional flow processes in the Gulf to better understand impacts from hurricanes, sea level rise, and other events.
The document outlines Canada's science and applications plan for the NASA Soil Moisture Active Passive (SMAP) mission. Key points include:
1) The plan involves using SMAP soil moisture data for calibration/validation, improving environmental modeling in Canada, and developing applications related to agriculture, drought monitoring, climate, and weather forecasting.
2) Validation sites for soil moisture and freeze/thaw across Canada are described. Field campaigns have been conducted to collect synergistic radar and radiometer data.
3) Research includes developing soil moisture retrieval algorithms, assimilating SMAP data into land surface models, and producing outputs for ecosystem modeling, hydrology and atmospheric modeling.
4) The
TU1.L10 - Arctic Sea Ice dynamics for Global Climate Models: Results from the...grssieee
The GlobICE project produced sea ice dynamics data products for climate models from 1992 to present using SAR images. Products include ice motion, deformation, thickness, and area/volume fluxes. The data is gridded and available via FTP to evaluate for modeling and analysis of Arctic sea ice and its role in global climate. Validation found good agreement between GlobICE and in situ buoy data.
The document discusses geophysical methods for geothermal exploration. It provides an overview of basic geophysics concepts and signatures of a geothermal system that can be identified using geophysics, including the heat source, reservoir, cap rock and recharge system. Standard geophysical techniques for geothermal exploration are mentioned, such as magnetotellurics, time domain electromagnetics, and gravity surveys. Examples of geophysical surveys and their results in identifying geothermal reservoirs in Indonesia are presented.
This document summarizes a study that used Landsat satellite imagery from 1992 and 2002 to detect changes along the Pali Cape - Erzeni River mouth coastal sector in Albania. The Multivariate Alteration Detection algorithm was used to analyze the bi-temporal imagery. The results showed that approximately 36 hectares of land was eroded from the Erzeni River delta, around 33 hectares of new land was created south of the river mouth, and wetland area increased. Erosion was also indicated in Lalzi Bay and the southwestern part of Pali Cape. The study demonstrated that bi-temporal Landsat data can be used to detect coastal environmental changes over time.
Similar to A Fresh Look at Marine Magnetic Anomalies, One of the Key Datasets in the Development of Plate Tectonics by Ian Norton - 2014 PaleoGIS & PaleoClimate Users Conference (20)
Paleolatitudinal Controls on Depositional Processes and Products: A Reality C...The Rothwell Group, L.P.
Paleolatitudinal Controls on Depositional Processes and Products: A Reality Check from Global Analogues of Clastic and Carbonate Reservoirs by Jose Guzman, Statoil - 2014 PaleoGIS & PaleoClimate Users Conference
Plate Reconstruction Methodology; Ways to Check Reconstruction Quality by Bru...The Rothwell Group, L.P.
Plate Reconstruction Methodology; Ways to Check Reconstruction Quality by Bruce Eglington, University of Saskatchewan - 2014 PaleoGIS & PaleoClimate Users Conference
Introduction to PaleoWeb by Arwen Vaughan, Rothwell - 2014 PaleoGIS & PaleoCl...The Rothwell Group, L.P.
PaleoWeb is plate tectonic modeling software that runs reconstructions and other computationally intensive tasks on Amazon servers rather than locally, allowing for greater processing power and data storage. It integrates with ArcMap through an add-in and allows users to upload data, visualize results, and share projects and data through a collaborative online interface while computation is handled remotely on Amazon's cloud infrastructure. This architecture aims to build an online paleontology community by facilitating data sharing and enabling computationally intensive reconstructions.
Late Cretaceous to Pliocene Paleogeographic Maps of the Gulf of Mexico - Cari...The Rothwell Group, L.P.
This document presents a methodology for creating GIS-based paleogeographic maps using a data-driven approach. The methodology involves:
1) Integrating various data sources like plate models, well data, seismic facies, and published paleogeography into a GIS database.
2) Reconstructing paleogeography for different time periods by interpreting the compiled data in a GIS environment using tools like ArcMap and PaleoGIS.
3) Iteratively checking and refining the results, incorporating new data as it becomes available.
PaleoGIS is a GIS software extension that performs plate tectonic reconstructions over geological timescales. It allows users to visualize and analyze spatial data in a paleogeographic context by "reconstructing" plate models, data, and rasters to different points in the past or future. Upcoming new versions will be compatible with newer versions of ArcGIS and include improvements like a new method for reconstructing raster data and the ability to unreconstruct rasters. The software is widely used in the oil, gas and mining industries for paleogeographic analysis and research.
Using Deformable Shapes to Build a Plate Model by Malcom Ross, Shell: 2013/Th...The Rothwell Group, L.P.
Using deformable shapes, this document discusses building a "fully realized" paleogeographic information system (PaleoGIS) plate model. Deformable shapes allow plate polygons, isochrons, and plate boundaries to be deformed over time in 3D, addressing limitations of rigid plate models. Constraints include shapes maintaining the same number of vertices and being simple polygons. Deformable shapes decoupled from display layers can better model stretched continental margins, collision belts, continuously created oceanic crust, and subduction zone movements.
Rift Asymmetry in the Equatorial Atlantic by David Lewis, Maersk Oil: 2013/Th...The Rothwell Group, L.P.
1) Plate reconstructions in the Equatorial Atlantic provide constraints on basin geometries and play elements along the conjugate Brazilian and West African margins.
2) Rift asymmetry between the margins led to different structural styles, with the Brazilian basin being largely unstructured compared to more faulted basins in West Africa.
3) Understanding this rift asymmetry and plate model constraints is important for detailed play characterization and exploration concepts in the similar but non-equivalent basins along the margins.
Plate Wizard Updates within PaleoGIS by John Watson, Robertson-CGG: 2013/Thir...The Rothwell Group, L.P.
Plate Wizard is being updated within the latest release of PaleoGIS software. It provides a deformable global plate model from the Phanerozoic constrained by data from the Cenozoic and Mesozoic. It accurately reconstructs plate positions and geometries over time. The updates include making Plate Wizard compatible with PaleoGIS, extending the rigid plate model to the Silurian (440 Ma), and updating the rigid Southeast Asia model.
Flutter vs. React Native: A Detailed Comparison for App Development in 2024dhavalvaghelanectarb
Choosing the right framework for your cross-platform mobile app can be a tough decision. Both Flutter and React Native offer compelling features and have earned their place in the development world. Here is a detailed comparison to help you weigh their strengths and weaknesses. Here are the pros and cons of developing mobile apps in React Native vs Flutter.
Orca: Nocode Graphical Editor for Container OrchestrationPedro J. Molina
Tool demo on CEDI/SISTEDES/JISBD2024 at A Coruña, Spain. 2024.06.18
"Orca: Nocode Graphical Editor for Container Orchestration"
by Pedro J. Molina PhD. from Metadev
Ensuring Efficiency and Speed with Practical Solutions for Clinical OperationsOnePlan Solutions
Clinical operations professionals encounter unique challenges. Balancing regulatory requirements, tight timelines, and the need for cross-functional collaboration can create significant internal pressures. Our upcoming webinar will introduce key strategies and tools to streamline and enhance clinical development processes, helping you overcome these challenges.
Mobile App Development Company In Noida | Drona InfotechDrona Infotech
React.js, a JavaScript library developed by Facebook, has gained immense popularity for building user interfaces, especially for single-page applications. Over the years, React has evolved and expanded its capabilities, becoming a preferred choice for mobile app development. This article will explore why React.js is an excellent choice for the Best Mobile App development company in Noida.
Visit Us For Information: https://www.linkedin.com/pulse/what-makes-reactjs-stand-out-mobile-app-development-rajesh-rai-pihvf/
Enhanced Screen Flows UI/UX using SLDS with Tom KittPeter Caitens
Join us for an engaging session led by Flow Champion, Tom Kitt. This session will dive into a technique of enhancing the user interfaces and user experiences within Screen Flows using the Salesforce Lightning Design System (SLDS). This technique uses Native functionality, with No Apex Code, No Custom Components and No Managed Packages required.
A Comprehensive Guide on Implementing Real-World Mobile Testing Strategies fo...kalichargn70th171
In today's fiercely competitive mobile app market, the role of the QA team is pivotal for continuous improvement and sustained success. Effective testing strategies are essential to navigate the challenges confidently and precisely. Ensuring the perfection of mobile apps before they reach end-users requires thoughtful decisions in the testing plan.
Transforming Product Development using OnePlan To Boost Efficiency and Innova...OnePlan Solutions
Ready to overcome challenges and drive innovation in your organization? Join us in our upcoming webinar where we discuss how to combat resource limitations, scope creep, and the difficulties of aligning your projects with strategic goals. Discover how OnePlan can revolutionize your product development processes, helping your team to innovate faster, manage resources more effectively, and deliver exceptional results.
How GenAI Can Improve Supplier Performance Management.pdfZycus
Data Collection and Analysis with GenAI enables organizations to gather, analyze, and visualize vast amounts of supplier data, identifying key performance indicators and trends. Predictive analytics forecast future supplier performance, mitigating risks and seizing opportunities. Supplier segmentation allows for tailored management strategies, optimizing resource allocation. Automated scorecards and reporting provide real-time insights, enhancing transparency and tracking progress. Collaboration is fostered through GenAI-powered platforms, driving continuous improvement. NLP analyzes unstructured feedback, uncovering deeper insights into supplier relationships. Simulation and scenario planning tools anticipate supply chain disruptions, supporting informed decision-making. Integration with existing systems enhances data accuracy and consistency. McKinsey estimates GenAI could deliver $2.6 trillion to $4.4 trillion in economic benefits annually across industries, revolutionizing procurement processes and delivering significant ROI.
Penify - Let AI do the Documentation, you write the Code.KrishnaveniMohan1
Penify automates the software documentation process for Git repositories. Every time a code modification is merged into "main", Penify uses a Large Language Model to generate documentation for the updated code. This automation covers multiple documentation layers, including InCode Documentation, API Documentation, Architectural Documentation, and PR documentation, each designed to improve different aspects of the development process. By taking over the entire documentation process, Penify tackles the common problem of documentation becoming outdated as the code evolves.
https://www.penify.dev/
Nashik's top web development company, Upturn India Technologies, crafts innovative digital solutions for your success. Partner with us and achieve your goals
Secure-by-Design Using Hardware and Software Protection for FDA ComplianceICS
This webinar explores the “secure-by-design” approach to medical device software development. During this important session, we will outline which security measures should be considered for compliance, identify technical solutions available on various hardware platforms, summarize hardware protection methods you should consider when building in security and review security software such as Trusted Execution Environments for secure storage of keys and data, and Intrusion Detection Protection Systems to monitor for threats.
The Comprehensive Guide to Validating Audio-Visual Performances.pdfkalichargn70th171
Ensuring the optimal performance of your audio-visual (AV) equipment is crucial for delivering exceptional experiences. AV performance validation is a critical process that verifies the quality and functionality of your AV setup. Whether you're a content creator, a business conducting webinars, or a homeowner creating a home theater, validating your AV performance is essential.
Software Test Automation - A Comprehensive Guide on Automated Testing.pdfkalichargn70th171
Moving to a more digitally focused era, the importance of software is rapidly increasing. Software tools are crucial for upgrading life standards, enhancing business prospects, and making a smart world. The smooth and fail-proof functioning of the software is very critical, as a large number of people are dependent on them.
A Fresh Look at Marine Magnetic Anomalies, One of the Key Datasets in the Development of Plate Tectonics by Ian Norton - 2014 PaleoGIS & PaleoClimate Users Conference
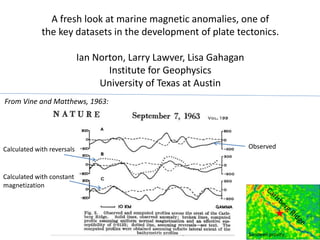
1. A fresh look at marine magnetic anomalies, one of
the key datasets in the development of plate tectonics.
Ian Norton, Larry Lawver, Lisa Gahagan
Institute for Geophysics
University of Texas at Austin
From Vine and Matthews, 1963:
Calculated with reversals Observed
Calculated with constant
magnetization
Sandwell gravity
2. The EDSAC-2 computer used by Vine & Matthews
http://en.wikipedia.org/wiki/EDSAC_2
EDSAC = Electronic Delay Storage Automatic Calculator
3. PLATES Database
• Plate model
• Database: oceanic magnetic and tectonic (plate boundaries, paleomagnetic, hot
spots, geological and geophysical data to extend the span and accuracy of global
plate reconstructions)
• This talk: a look at magnetic anomalies.
Crust Code
4. Data from Global Magnetics Database http://www.soest.hawaii.edu/PT/GSFML/ML/index.html
Green – Cande & Stock, 2004
Black – Granot et al., 2013
Australia
Database run by Paul Wessel (Hawaii) &
Dietmar Müller (Sydney)
Antarctica
-40
-50
-60
100 140
5. Data from Global Magnetics Database http://www.soest.hawaii.edu/PT/GSFML/ML/index.html
115˚E 120˚E
60˚S
Mismatches 5-6 km to as much as 35 km
• Great dataset, needs work to use
Green – Cande & Stock, 2004
Black – Granot et al., 2013
7. Example magnetic profile from Mascarene Basin
• VGG emphasizes fracture zones and extinct ridges
Base: Sandwell vertical gravity gradient 23.1
8. ModMag model of Mascarene Basin profile
• Really good match between synthetic and observed
• Easy to map details of age interpretation
Young end at max +ve, old end at max -ve
ModMag: Matlab program by Mendel, Munschy & Sauter, 2005. This profile is
from example data files that are included with download.
Computers & Geosciences, Volume 31, Issue 5, June 2005, Pages 589–597
13. Line SO183-11 from Mozambique Basin
• Good match over parts of profile
• Need multiple lines for regional identifications
• Mapping of young-old edges of anomalies not quite so accurate
Data from König and Jokat, 2010
Young end close to max –ve, old end close to max +ve
19. The Svalbard Margin – Paleocene-Eocene foldbelt followed by some rifting (age?)
Leever et al. 2011 after Faleide et al. 2008
Leever et al. 2011 after FG = Forlandsundet Graben Bergh et al., 1997 and Braathen et al. 1999
20. Stylized present-day
G
E
Reconstructions should show (in
sequence) transpression to
transtension to oblique divergence
with spreading
Stylized 33 Ma
(e.g. Engen et al. 2008)
G
E
Stylized Oligocene
(overlap to account for
transtension)
G
E
Stylized Paleocene
(gap to account for
transpression)
G
E
Present-day
47 Ma
Should show a gap at 47 Ma,
not overlap
21. 120-130 km overlap
47 Ma reconstruction
Europe fixed, Gaina et al. 2009 poles
22. 47 Ma reconstruction – can Greenland be shifted to avoid overlap with Svalbard?
• Check magnetic lineation identifications in Labrador Sea
23. Labrador Sea magnetic data
Data from http://gdr.agg.nrcan.gc.ca/gdrdap/dap/index-eng.php?dapid=8127
24. Labrador Sea magnetic data – modeled profile
Data from http://gdr.agg.nrcan.gc.ca/gdrdap/dap/index-eng.php?dapid=8127
30. This is the currently accepted interpretation
• These essentially sinusoidal anomalies are hard to identify with certainty, need
regional context to settle on interpretation
This area not modeled
32. 120-130 km overlap
47 Ma reconstruction
Europe fixed, Gaina et al. 2009 poles
33. 47 Ma reconstruction – can Greenland be shifted to avoid overlap with Svalbard?
• Labrador Sea identifications not definitive
• Triple junction provides strong constraint – can’t move Greenland
• How to fix the overlap? Hopefully PhD student Bereke Karainov at UiS can figure it out!
Triple junction
König and Jokat, 2011
Advanced insights into magmatism and volcanism of the
Mozambique Ridge and Mozambique Basin in the view of new
potential field data.
Geophys. J. Int. (2010) 180, 158–180 doi: 10.1111/j.1365-246X.2009.04433.x
König and Jokat, 2011
Advanced insights into magmatism and volcanism of the
Mozambique Ridge and Mozambique Basin in the view of new
potential field data.
Geophys. J. Int. (2010) 180, 158–180 doi: 10.1111/j.1365-246X.2009.04433.x