TGS NSA- East Coast Canada Labrador Sea
•
0 likes•229 views

TGS has generated a sequence stratigraphic interpretation and play fairway analysis project for the Northeast Newfoundland Shelf utilizing new seismic survey data and available well data. They mapped 21 sequences and delineated reservoir distribution over time. Deliverables include structure maps, horizons, leads, faults, and depositional environment maps. The benefits are a reduced exploration cycle time and risk through understanding basin development and delineating source, seal, and reservoir distributions. Clients must license 50% of the underlying seismic data.

Recommended
Recommended
More Related Content
What's hot
What's hot (20)
Viewers also liked
Viewers also liked (12)
Similar to TGS NSA- East Coast Canada Labrador Sea
Similar to TGS NSA- East Coast Canada Labrador Sea (20)
More from TGS
More from TGS (17)
Recently uploaded
Recently uploaded (20)
TGS NSA- East Coast Canada Labrador Sea
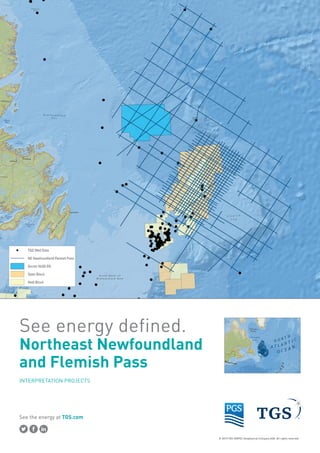
- 1. © 2015 TGS-NOPEC Geophysical Company ASA. All rights reserved. See the energy at TGS.com See energy defined. Northeast Newfoundland and Flemish Pass INTERPRETATION PROJECTS
- 2. © 2015 TGS-NOPEC Geophysical Company ASA. All rights reserved. For more information, contact TGS at: UK Tel: +44 208 339 4200 Email: gps-sales@tgs.com US Tel: +1 713 860 2100 Email: gps-sales@tgs.com Sequence Stratigraphic Interpretation and Play Fairway Analysis PROJECT DETAILS TGS has generated a sequence stratigraphic and play fairway analysis interpretation project utilising the new TGS Offshore Northeast Newfoundland Shelf seismic survey data and available well data to: ƒƒ Provide a geologic model of the depositional basin fill over time ƒƒ Delineate the presence, thickness and distribution of reservoir and seal with respect to timing and movement associated with tectonic activity ƒƒ Identify and risk-assess prospective hydrocarbon leads by performing basin modeling and AVO analysis In addition, TGS has integrated and interpreted well log data to define a sequence stratigraphic framework. Depositional environments and associated facies will be interpreted based on log character for available wells. Where insufficient well data is available, seismic facies analysis will be used to define the gross depositional environments. Gross depositional environment maps for up to 21 sequences have been interpreted and mapped. DELIVERABLES Interpreted seismic and well data are delivered in shape, image and ASCII file formats. TGS also provides clients with a viewer, the Facies Map Browser (FMB), to review all well and map data. Deliverables will include: ƒƒ Processed well curve data ƒƒ Sequence boundaries picked on log data ƒƒ Seismic horizons used to define and constrain sequence boundaries ƒƒ Gross depositional environment maps based on well and seismic events ƒƒ Seismic facies maps ƒƒ Reservoir, seal, and play fairway summary maps ƒƒ Core descriptions and cor summart report for 9 wells The structural interpretation deliverables include: ƒƒ Structure maps ƒƒ Horizons ƒƒ AVO analysis ƒƒ Leads and features catalogue ƒƒ Fault segments ƒƒ Fault polygons and polygons that delineate potential hydrocarbon anomalies. Other geologic features such as areas of igneous activity and major depositional features such as deltas, fans, debris flows and turbidites are also identified and interpreted. A report summarizing the current seismic based interpretation projects and basin modeling has been prepared. BENEFITS The benefits of the sequence stratigraphic study and play fairway analysis are: 1. A fundamental exploration tool that takes many man years to complete and therefore few companies complete in such detail 2. A fast track understanding of basin development and shortened exploration cycle time 3. New and extended insight into the gross depositional environments of the region 4. Reduced risk through delineating source, seal and reservoir for use in predictive exploration 5. A robust framework for play modelling and exploration work 6. Integrated data in a single environment to improve productivity REQUIREMENTS Clients must license 50% of underlying seismic data.