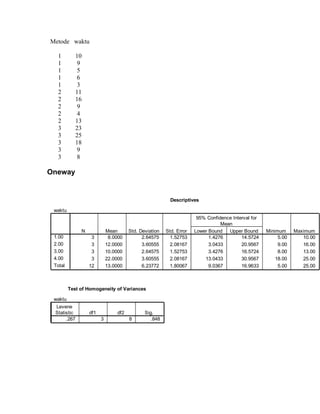
Metode waktu

  1         10
  1          9
  1          5
  1          6
  1          3
  2         11
  2         16
  2          9
  2          4
  2         13
  3         23
  3         25
  3         18
  3          9
  3          8

Oneway


                                                         Descriptives

 waktu
                                                                     95% Confidence Interval for
                                                                               Mean
              N             Mean      Std. Deviation   Std. Error   Lower Bound   Upper Bound      Minimum     Maximum
 1.00              3         8.0000         2.64575      1.52753          1.4276        14.5724         5.00      10.00
 2.00              3        12.0000         3.60555      2.08167          3.0433        20.9567         9.00      16.00
 3.00              3        10.0000         2.64575      1.52753          3.4276        16.5724         8.00      13.00
 4.00              3        22.0000         3.60555      2.08167        13.0433         30.9567        18.00      25.00
 Total            12        13.0000         6.23772      1.80067          9.0367        16.9633         5.00      25.00


         Test of Homogeneity of Variances

 waktu
 Levene
 Statistic        df1           df2          Sig.
      .267              3             8         .848
ANOVA

 waktu
                                                      Sum of
                                                      Squares    df        Mean Square    F       Sig.
 Between          (Combined)                           348.000        3        116.000   11.600      .003
 Groups           Linear Term    Contrast              240.000        1        240.000   24.000      .001
                                 Deviation
                                                       108.000        2         54.000    5.400     .033

 Within Groups                                          80.000         8        10.000
 Total                                                 428.000        11


     Contrast Coefficientsa

   a. Coefficients for contrast 1 are not displayed
      because the number of contrast coefficients
      does not equal the number of groups.


         Contrast Testsa

   a. Contrast 1 cannot be evaluated because
      the number of contrast coefficients does
      not equal the number of groups.


Post Hoc Tests
Multiple Comparisons

 Dependent Variable: waktu

                                              Mean
                                            Difference                                95% Confidence Interval
               (I) metode    (J) metode         (I-J)        Std. Error   Sig.      Lower Bound   Upper Bound
 Tukey HSD     1.00          2.00             -4.00000         2.58199       .455       -12.2684         4.2684
                             3.00             -2.00000         2.58199       .864       -10.2684         6.2684
                             4.00            -14.00000*        2.58199       .003       -22.2684        -5.7316
               2.00          1.00              4.00000         2.58199       .455        -4.2684       12.2684
                             3.00              2.00000         2.58199       .864        -6.2684       10.2684
                             4.00            -10.00000*        2.58199       .020       -18.2684        -1.7316
               3.00          1.00              2.00000         2.58199       .864        -6.2684       10.2684
                             2.00             -2.00000         2.58199       .864       -10.2684         6.2684
                             4.00            -12.00000*        2.58199       .007       -20.2684        -3.7316
               4.00          1.00             14.00000*        2.58199       .003         5.7316       22.2684
                             2.00             10.00000*        2.58199       .020         1.7316       18.2684
                             3.00             12.00000*        2.58199       .007         3.7316       20.2684
 LSD           1.00          2.00             -4.00000         2.58199       .160        -9.9541         1.9541
                             3.00             -2.00000         2.58199       .461        -7.9541         3.9541
                             4.00            -14.00000*        2.58199       .001       -19.9541        -8.0459
               2.00          1.00              4.00000         2.58199       .160        -1.9541         9.9541
                             3.00              2.00000         2.58199       .461        -3.9541         7.9541
                             4.00            -10.00000*        2.58199       .005       -15.9541        -4.0459
               3.00          1.00              2.00000         2.58199       .461        -3.9541         7.9541
                             2.00             -2.00000         2.58199       .461        -7.9541         3.9541
                             4.00            -12.00000*        2.58199       .002       -17.9541        -6.0459
               4.00          1.00             14.00000*        2.58199       .001         8.0459       19.9541
                             2.00             10.00000*        2.58199       .005         4.0459       15.9541
                             3.00             12.00000*        2.58199       .002         6.0459       17.9541
   *. The mean difference is significant at the .05 level.


Homogeneous Subsets


                                   waktu

                                                  Subset for alpha = .05
                   metode             N              1             2
 Tukey HSDa        1.00                     3       8.0000
                   3.00                     3      10.0000
                   2.00                     3      12.0000
                   4.00                     3                    22.0000
                   Sig.                                .455        1.000
 Duncan a          1.00                     3       8.0000
                   3.00                     3      10.0000
                   2.00                     3      12.0000
                   4.00                     3                    22.0000
                   Sig.                                .176        1.000
 Means for groups in homogeneous subsets are displayed.
   a. Uses Harmonic Mean Sample Size = 3.000.


Means Plots
22.00


                20.00


                18.00
Mean of waktu


                16.00


                14.00


                12.00


                10.00


                 8.00


                        1.00   2.00            3.00   4.00

                                      metode

punya iroh suniroh Metode Pengajaran Paket C Data Anova

  • 1.
    Metode waktu 1 10 1 9 1 5 1 6 1 3 2 11 2 16 2 9 2 4 2 13 3 23 3 25 3 18 3 9 3 8 Oneway Descriptives waktu 95% Confidence Interval for Mean N Mean Std. Deviation Std. Error Lower Bound Upper Bound Minimum Maximum 1.00 3 8.0000 2.64575 1.52753 1.4276 14.5724 5.00 10.00 2.00 3 12.0000 3.60555 2.08167 3.0433 20.9567 9.00 16.00 3.00 3 10.0000 2.64575 1.52753 3.4276 16.5724 8.00 13.00 4.00 3 22.0000 3.60555 2.08167 13.0433 30.9567 18.00 25.00 Total 12 13.0000 6.23772 1.80067 9.0367 16.9633 5.00 25.00 Test of Homogeneity of Variances waktu Levene Statistic df1 df2 Sig. .267 3 8 .848
  • 2.
    ANOVA waktu Sum of Squares df Mean Square F Sig. Between (Combined) 348.000 3 116.000 11.600 .003 Groups Linear Term Contrast 240.000 1 240.000 24.000 .001 Deviation 108.000 2 54.000 5.400 .033 Within Groups 80.000 8 10.000 Total 428.000 11 Contrast Coefficientsa a. Coefficients for contrast 1 are not displayed because the number of contrast coefficients does not equal the number of groups. Contrast Testsa a. Contrast 1 cannot be evaluated because the number of contrast coefficients does not equal the number of groups. Post Hoc Tests
  • 3.
    Multiple Comparisons DependentVariable: waktu Mean Difference 95% Confidence Interval (I) metode (J) metode (I-J) Std. Error Sig. Lower Bound Upper Bound Tukey HSD 1.00 2.00 -4.00000 2.58199 .455 -12.2684 4.2684 3.00 -2.00000 2.58199 .864 -10.2684 6.2684 4.00 -14.00000* 2.58199 .003 -22.2684 -5.7316 2.00 1.00 4.00000 2.58199 .455 -4.2684 12.2684 3.00 2.00000 2.58199 .864 -6.2684 10.2684 4.00 -10.00000* 2.58199 .020 -18.2684 -1.7316 3.00 1.00 2.00000 2.58199 .864 -6.2684 10.2684 2.00 -2.00000 2.58199 .864 -10.2684 6.2684 4.00 -12.00000* 2.58199 .007 -20.2684 -3.7316 4.00 1.00 14.00000* 2.58199 .003 5.7316 22.2684 2.00 10.00000* 2.58199 .020 1.7316 18.2684 3.00 12.00000* 2.58199 .007 3.7316 20.2684 LSD 1.00 2.00 -4.00000 2.58199 .160 -9.9541 1.9541 3.00 -2.00000 2.58199 .461 -7.9541 3.9541 4.00 -14.00000* 2.58199 .001 -19.9541 -8.0459 2.00 1.00 4.00000 2.58199 .160 -1.9541 9.9541 3.00 2.00000 2.58199 .461 -3.9541 7.9541 4.00 -10.00000* 2.58199 .005 -15.9541 -4.0459 3.00 1.00 2.00000 2.58199 .461 -3.9541 7.9541 2.00 -2.00000 2.58199 .461 -7.9541 3.9541 4.00 -12.00000* 2.58199 .002 -17.9541 -6.0459 4.00 1.00 14.00000* 2.58199 .001 8.0459 19.9541 2.00 10.00000* 2.58199 .005 4.0459 15.9541 3.00 12.00000* 2.58199 .002 6.0459 17.9541 *. The mean difference is significant at the .05 level. Homogeneous Subsets waktu Subset for alpha = .05 metode N 1 2 Tukey HSDa 1.00 3 8.0000 3.00 3 10.0000 2.00 3 12.0000 4.00 3 22.0000 Sig. .455 1.000 Duncan a 1.00 3 8.0000 3.00 3 10.0000 2.00 3 12.0000 4.00 3 22.0000 Sig. .176 1.000 Means for groups in homogeneous subsets are displayed. a. Uses Harmonic Mean Sample Size = 3.000. Means Plots
  • 4.
    22.00 20.00 18.00 Mean of waktu 16.00 14.00 12.00 10.00 8.00 1.00 2.00 3.00 4.00 metode