Swedbank's Year-End report 2014
•
0 likes•650 views

- Swedbank reported a profit of SEK 3.8 billion for Q4 2014, down 17% from Q3 2014. Net interest income was flat at SEK 5.8 billion while costs rose 3% to SEK 4.3 billion. - For full-year 2014, Swedbank's profit increased 27% to SEK 16.5 billion. Net interest income rose 3% to SEK 22.6 billion while costs increased 6% to SEK 17.6 billion. - Swedbank's loan portfolio grew 11% year-over-year while deposits increased 9%. The bank proposed a dividend of SEK 11.35 per share for 2014, up 12% from 2013.

More Related Content
What's hot
What's hot (18)
Similar to Swedbank's Year-End report 2014
Similar to Swedbank's Year-End report 2014 (20)
More from Swedbank
More from Swedbank (20)
Recently uploaded
Recently uploaded (17)
Swedbank's Year-End report 2014
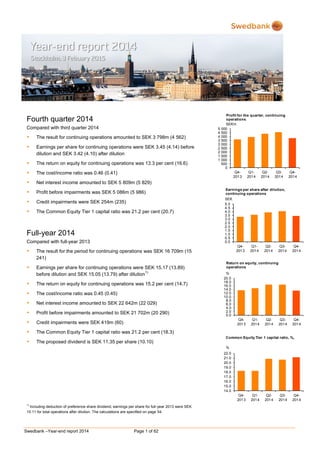
- 1. Swedbank –Year-end report 2014 Page 1 of 62 Fourth quarter 2014 Compared with third quarter 2014 The result for continuing operations amounted to SEK 3 798m (4 562) Earnings per share for continuing operations were SEK 3.45 (4.14) before dilution and SEK 3.42 (4.10) after dilution The return on equity for continuing operations was 13.3 per cent (16.6) The cost/income ratio was 0.46 (0.41) Net interest income amounted to SEK 5 809m (5 829) Profit before impairments was SEK 5 086m (5 986) Credit impairments were SEK 254m (235) The Common Equity Tier 1 capital ratio was 21.2 per cent (20.7) Full-year 2014 Compared with full-year 2013 The result for the period for continuing operations was SEK 16 709m (15 241) Earnings per share for continuing operations were SEK 15.17 (13.89) before dilution and SEK 15.05 (13.79) after dilution 1) The return on equity for continuing operations was 15.2 per cent (14.7) The cost/income ratio was 0.45 (0.45) Net interest income amounted to SEK 22 642m (22 029) Profit before impairments amounted to SEK 21 702m (20 290) Credit impairments were SEK 419m (60) The Common Equity Tier 1 capital ratio was 21.2 per cent (18.3) The proposed dividend is SEK 11.35 per share (10.10) 1) Including deduction of preference share dividend, earnings per share for full-year 2013 were SEK 10.11 for total operations after dilution. The calculations are specified on page 54. 0 500 1 000 1 500 2 000 2 500 3 000 3 500 4 000 4 500 5 000 Q4- 2013 Q1- 2014 Q2- 2014 Q3- 2014 Q4- 2014 SEKm Profit for the quarter, continuing operations 0.0 0.5 1.0 1.5 2.0 2.5 3.0 3.5 4.0 4.5 5.0 Q4- 2013 Q1- 2014 Q2- 2014 Q3- 2014 Q4- 2014 SEK Earnings per share after dilution, continuing operations 0.0 2.0 4.0 6.0 8.0 10.0 12.0 14.0 16.0 18.0 20.0 Q4- 2013 Q1- 2014 Q2- 2014 Q3- 2014 Q4- 2014 % Return on equity, continuing operations 14.0 15.0 16.0 17.0 18.0 19.0 20.0 21.0 22.0 Q4- 2013 Q1- 2014 Q2- 2014 Q3- 2014 Q4- 2014 % Common Equity Tier 1 capital ratio, %,
- 2. Swedbank –Year-end report 2014 Page 2 of 62 CEO Comment Our priorities at the start of 2014 were to improve customer value, strengthen our market position and increase cost efficiency. I am pleased with the results of the work we have done, although we still have challenges ahead of us – especially in our work to increase customer value. Customers appreciate our digital offering We are working to simplify our customers’ everyday lives by increasing availability and providing more digital services. Our customers are increasingly choosing our self-service solutions in the Mobile Bank and the Internet Bank. This has led to fewer teller transactions while also leaving us more time for customers who need advisory services. Customers are also increasingly choosing card and electronic payments. Use of the Swish service is growing, now also among businesses, as is interest in our electronic payment solution for small businesses, Babs Micro. Due to the changes in tax-deductible pension contributions in Sweden, we launched additional digital services during the fourth quarter. Customers can now open investment savings accounts and transfer monthly savings from individual pension savings to investment savings accounts and change fund distributions directly through the Mobile Bank. We are the first life insurance company in the Baltic countries to allow customers to digitally obtain new policies, change existing policies and report claims. In December Swedbank’s Mobile Bank celebrated five years. The latest customer satisfaction survey shows that over 90 per cent of our customers are satisfied or highly satisfied with the Mobile Bank. The expense tracker we launched last summer contributed strongly to the result. While we still face big challenges in traditional banking, our latest customer satisfaction survey, where over 40 000 customers were asked about the bank and our offering, shows that the trend is heading in the right direction. Satisfaction improved among both private and corporate customers and showed that branches with the lowest satisfaction have made the biggest gains. We are working continuously and systematically to address the opinions expressed in these surveys, including how we handle complaints and long waiting times. Thanks to this valuable input, we are seeing positive results, but have more to do. We are growing where our customers are growing We have worked conscientiously to strengthen customer relations and increase cost efficiency. In addition, the bank’s solid risk profile has resulted in lower funding costs, which will benefit our customers in the form of lower prices. Our position and the competitive strength of our offering are especially evident in the housing market – among both companies and mortgage customers. The fourth quarter saw continued good lending growth in the Swedish operations, especially in the real estate sector, which also contributed to a high level of advisory activity on the corporate side, mainly in terms of preference share issues. This is positive, and I cannot stress enough the importance of the housing issue for our customers. The Swedish population is growing at the same time that more people are moving to cities. These trends provide the potential for economic growth. Unfortunately, the measures that have been taken to date to increase the housing stock and stop the price rise have been insufficient, which is pushing households further into debt. We need more infrastructure investment in combination with a faster pace of housing construction, a development to which we will gladly contribute. Cost control creates opportunities to invest in our customer offering Economic and political conditions in Europe worsened during the quarter and were distinguished by growing concerns. The drop in energy prices, the deteriorating economic situation in Russia and major currency movements changed the risk scenario. The turbulent global environment has not markedly affected our customers, however, who still stand strong. We continue to work with and support those customers who could be affected by problems. Earnings in our Baltic operations are still strong and credit quality is good despite the situation in Russia. Cost control in the bank is good and we reached our target. Our aim to further reduce costs to SEK 16bn for 2016 is an important element in strengthening our customer offering by giving us the flexibility to invest in more competitive solutions. A smaller cost base also helps us to accommodate low inflation and a low interest rate environment as well as increased competition in the wake of digitisation. Our capitalisation is still strong with large buffers to withstand economic downturns. There is still some uncertainty about capital regulations, mainly on an international level. We expect they will be clarified for the most part in 2015. In line with the dividend policy, Swedbank’s Board of Directors is proposing to the Annual General Meeting a dividend of SEK 11.35 (10.10) per share for 2014. The dividend policy remains firm. Michael Wolf President and CEO
- 3. Swedbank –Year-end report 2014 Page 3 of 62 Table of contents Page Financial summary 4 Overview 5 Market 5 Important to note 5 Fourth quarter 2014 compared with third quarter 2014 5 Result 5 Full-year 2014 compared with full-year 2013 6 Result 6 Credit and asset quality 7 Funding and liquidity 8 Ratings 8 Capital and capital adequacy 9 Operational risks 10 Other events 10 Events after 31 December 2014 10 Business segments Swedish Banking 11 Baltic Banking 13 Large Corporates & Institutions 15 Group Functions & Other 17 Eliminations 19 Product areas 20 Financial information Group Income statement, condensed 26 Statement of comprehensive income, condensed 27 Key ratios 28 Balance sheet, condensed 29 Statement of changes in equity, condensed 30 Cash flow statement, condensed 31 Notes 31 Parent company 56 Signatures of the Board of Directors and the President 61 Review report 61 Contact information 62 More detailed information can be found in Swedbank’s fact book, www.swedbank.com/ir, under Financial information and publications.
- 4. Swedbank –Year-end report 2014 Page 4 of 62 Financial summary Income statement Q4 Q3 Q4 Full-year Full-year SEKm 2014 2014 % 2013 % 2014 2013 % Net interest income 5 809 5 829 0 5 626 3 22 642 22 029 3 Net commission income 2 882 2 816 2 2 699 7 11 204 10 132 11 Net gains and losses on financial items at fair value 69 799 -91 461 -85 1 986 1 484 34 Other income 619 706 -12 866 -29 3 472 3 293 5 Total income 9 379 10 150 -8 9 652 -3 39 304 36 938 6 Staff costs 2 452 2 469 -1 2 574 -5 10 259 9 651 6 Other expenses 1 841 1 695 9 1 910 -4 7 343 6 997 5 Total expenses 4 293 4 164 3 4 484 -4 17 602 16 648 6 Profit before impairments 5 086 5 986 -15 5 168 -2 21 702 20 290 7 Impairment of intangible assets 0 0 12 1 182 -99 Impairment of tangible assets 33 19 74 311 -89 256 693 -63 Credit impairments 254 235 8 -32 419 60 Operating profit 4 799 5 732 -16 4 877 -2 21 026 19 355 9 Tax expense 1 000 1 164 -14 1 212 -17 4 301 4 099 5 Profit for the period from continuing operations 3 799 4 568 -17 3 665 4 16 725 15 256 10 Profit for the period from discontinued operations, after tax -3 -2 50 -48 -94 -262 -2 340 -89 Profit for the period 3 796 4 566 -17 3 617 5 16 463 12 916 27 Profit for the period attributable to the shareholders of Swedbank AB 3 795 4 560 -17 3 612 5 16 447 12 901 27 Q4 Q3 Q4 Full-year Full-year Key ratios and data per share 2014 2014 2013 2014 2013 Return on equity, continuing operations, % 13.3 16.6 13.6 15.2 14.7 Return on equity, total operations, % 13.3 16.6 13.4 15.0 12.5 Earnings per share before dilution, continuing operations, SEK 1) 3.45 4.14 3.34 15.17 13.89 Earnings per share after dilution, continuing operations, SEK 1) 3.42 4.10 3.31 15.05 13.79 Cost/income ratio 0.46 0.41 0.46 0.45 0.45 Equity per share, SEK 1) 106.3 101.1 99.8 106.3 99.8 Loan/deposit ratio, % 201 193 203 201 203 Common Equity Tier 1 capital ratio, %, Basel 3 2) 21.2 20.7 18.3 21.2 18.3 Tier 1 capital ratio, %, Basel 3 2) 22.4 21.9 19.6 22.4 19.6 Total capital ratio, %, Basel 3 2) 25.5 24.9 20.7 25.5 20.7 Credit impairment ratio, % 0.07 0.07 -0.01 0.03 0.00 Share of impaired loans, gross, % 0.41 0.47 0.55 0.41 0.55 Total provision ratio for impaired loans, % 53 55 54 53 54 Liquidity coverage ratio (LCR), % 120 132 142 120 142 Net stable funding ratio (NSFR), % 3) 98 102 97 98 97 Balance sheet data 31 Dec 31 Dec SEKbn 2014 2013 % Loans to the public 1 405 1 265 11 Deposits and borrow ings from the public 677 621 9 Shareholders' equity 117 110 7 Total assets 2 121 1 824 16 Risk exposure amount, Basel 3 2) 414 441 -6 1) Including deduction of the preference share dividend, earnings per share for full-year 2013 were SEK 10.11 for total operations after dilution. The calculations are specified on page 54. 2) The capital ratios for 2013 are based on Swedbank’s knowledge of the new regulations at that point in time. 3) NSFR according to Swedbank’s best understanding of the Basel Committee’s new NSFR recommendation (BCBS295). The key ratios are based on profit and shareholders’ equity attributable to shareholders of Swedbank. Key ratios and text comments regarding lending and deposits relate to volumes excluding Swedish National Debt Office and repos.
- 5. Swedbank –Year-end report 2014 Page 5 of 62 Overview Market Globally, the fourth quarter was marked by positive economic data from the US, where the labour market strengthened and growth was higher than expected – benefiting from falling energy prices and lower interest rates. Signals from Europe were less favourable, with weak forward-looking indicators and lower than expected industrial production. Low energy prices produced negative Inflation. The European Central Bank signalled that it would be expand its bond buying in early 2015, which it did in mid-January in order to maintain low interest rates and spur lending and growth in the eurozone. The euro weakened significantly against the dollar during the fourth quarter and long- term market interest rates continued to fall. The Swedish economy did well, with data on retail sales confirming strong activity domestically. For Swedish exporters, conditions remained sluggish, which contributed to lower industrial production. The labour market developed positively, with employment and the number of hours worked rising and unemployment decreasing. The weaker krona, especially against the dollar, slightly affected inflation during the quarter at the same time that sharply falling oil prices had the opposite effect. The Riksbank maintained a 0% interest rate at its most recent policy meeting in December and is forecasting that it will not begin raising rates until autumn 2016. The Riksbank stressed that a decision whether to take further action could be made at the February meeting if inflation remains at a low level. Low interest rates, population growth and higher employment contributed to increased housing demand. At the same time the supply of housing available for sale continued to fall. Housing construction rose substantially in 2014 and accounted for a significant share of GDP growth. The December agreement between the government and alliance parties had limited impact on the financial markets but averted a snap election. The risk that a weakened parliament could impede reforms that are critical to Swedish competitiveness still remains, however. The Baltic countries were affected by weak exports due to lower global demand, especially in Europe. Gradually rising exports to new markets and slightly better conditions in existing export markets are expected to accelerate export growth in 2015 and 2016. The impact of the crisis in Russia and Ukraine has been limited so far and concentrated in a few sectors. On the other hand, the downturn in the Russian economy is expected to continue amid increasing fears of recession and, not least, the substantially weaker Russian rouble. To date geopolitical tensions have created uncertainty and made companies in the Baltics more cautious about investing. Unemployment continued to decline in the fourth quarter and wages increased, resulting in continued strong household consumption. Further improvements in the labour market will require higher export growth, however. As of 2015 all three Baltic countries share the same currency, the euro. The Stockholm stock exchange (OMXSPI) gained 12 per cent during the year. The Tallinn stock exchange (OMXTGI) fell by 8 per cent and the Riga stock exchange (OMXRGI) by 11 per cent, while the Vilnius stock exchange (OMXVGI) gained 7 per cent. Important to note The bank’s total expenses for 2014 amounted to SEK 17.6bn, compared with a target of SEK 17.7bn, including the acquisition of Sparbanken Öresund. The goal of reducing total expenses for 2016 to SEK 16bn, which was announced in connection with the Q3 interim report, is still in place. This is a consequence of increasing digitisation, which creates greater competition and price pressure and will ensure Swedbank’s continued competitiveness. The savings consist of synergies related to the acquisition of Sparbanken Öresund, lower costs due to increased digitisation and changes in distribution forms, as well as reductions in personnel, primarily in Group functions. The staff reduction is expected to be achieved mainly through attrition. The Board of Directors proposes that the Annual General Meeting extend the current repurchase programme, which authorises the Board to decide to repurchase shares up to a maximum of one tenth of all the shares in Swedbank (including treasury shares acquired by the securities operations), by one year and extend the mandate to issue convertibles in the form of subordinated debt that can be converted to shares. The proposals are motivated as two of several measures to give the Board the opportunity to continuously adapt the bank’s capital structure to current capital needs. The proposed dividend is SEK 11.35 (10.10) per share for the financial year 2014. This corresponds to a dividend ratio of 75 per cent. The proposed record day for the dividend is 30 March. The last day for trading in Swedbank’s shares with the right to the dividend will be 26 March. If the Annual General Meeting accepts the Board of Directors’ proposal, the dividend is expected to be paid out by Euroclear on 2 April 2015. Swedbank’s Annual General Meeting will be held at 10 am (CET) on Thursday, 26, March 2015 at Dansens Hus, Barnhusgatan 14, Stockholm. More information on the Annual General Meeting will be made available on the bank’s website, www.swedbank.se, under the heading About Swedbank/Corporate governance. Fourth quarter 2014 Compared with third quarter 2014 Result The quarterly result decreased by 17 per cent to SEK 3 795m (4 560). Income decreased while expenses rose on a seasonal basis. Credit impairments were stable at a low level. Profit before impairments decreased by 15 per cent to SEK 5 086m (5 986). The business segments were stable with the exception of Group Functions & Other, where the result for Group Treasury decreased. The return on equity was 13.3 per cent (16.6). The cost/income ratio was 0.46 (0.41).
- 6. Swedbank –Year-end report 2014 Page 6 of 62 Profit before impairments by business segment excl FX effects Q4 Q3 Q4 SEKm 2014 2014 2013 Sw edish Banking 2 924 2 986 3 010 Baltic Banking 859 907 891 Large Corporates & Institutions 1 025 979 1 116 Group Functions & Other 278 1 109 208 Total excl FX effects 5 086 5 981 5 224 FX effects 0 5 -56 Total 5 086 5 986 5 168 Income decreased by 8 per cent to SEK 9 379m (10 150). Net commission income increased while net interest income was in line with the previous quarter. Net gains and losses on financial items at fair value decreased significantly in Group Treasury within Group Functions & Other. Net interest income amounted to SEK 5 809m (5 829). Net interest income decreased slightly in Swedish Banking, increased slightly in Group Treasury and was stable in the other business segments. Group Treasury’s net interest income benefited from falling market interest rates, which adversely affected deposit margins within Swedish Banking and Baltic Banking. Higher lending volumes in Swedish Banking and LC&I contributed positively. Lending margins for Swedish mortgages increased slightly during the quarter, while new lending margins were unchanged. Due to a retroactive adjustment for the year, the provision for the stability fee increased during the fourth quarter, reducing net interest income by SEK 71m. Net commission income increased to SEK 2 882m (2 816). Swedish Banking contributed positively while net commission income was slightly lower in LC&I. Income from corporate finance was higher because the bank led a number of preference share issues in the property sector and due to increased M&A activity in the Norwegian operations, among other things. Payment commissions increased on a seasonal basis while lending related commissions decreased. Net gains and losses on financial items at fair value decreased to SEK 69m (799). Net gains and losses on financial items at fair value in LC&I increased. Group Treasury’s net result decreased mainly due to higher covered bond repurchases and negative valuation effects caused by increased credit spreads. Other income decreased by 12 per cent to SEK 619m (706). The share of profit or loss of associates decreased due to a lower result in the credit card company Entercard. Other income decreased in Ektornet while net insurance rose, mainly due to revised assumptions for future claim provisions as well as reversals of previous non-life provisions. Expenses increased by 3 per cent to SEK 4 293m (4 164). Expenses increased slightly on a seasonal basis within all business segments. Staff costs were stable while other expenses increased slightly. The number of full-time employees was in line with the previous quarter. The number decreased in Group Functions & Other as well as in Swedish Banking, but increased in Baltic Banking and LC&I. Credit impairments were SEK 254m (235). Credit impairments decreased within LC&I. Baltic Banking reported recoveries, but at a lower level. In Swedish Banking credit impairments rose, but remained at low levels. Tangible asset writedowns amounted to SEK 33m (19) and primarily relate to impairments within Ektornet. Repossessed properties within Ektornet decreased to SEK 778m (916). The tax expense amounted to SEK 1 000m (1 164), corresponding to an effective tax rate of 20.8 per cent (20.3). The result from discontinued operations was SEK -3m (- 2). The result for Russia was SEK -172m, of which SEK 289m were impairments – a result of loan sales as part of the continued wind-down as well as the depreciation of the rouble. In Lithuania a shareholding recognised in discontinued operations was sold with a capital gain of SEK 163m. Full-year 2014 Compared with full-year 2013 Result The result for the period rose by 27 per cent to SEK 16 447m (12 901). Income, expenses and credit impairments increased, while impairments fell. Fluctuations in exchange rates, primarily the depreciation of the Swedish krona against the euro, raised profit by SEK 187m. The result for continuing operations was SEK 16 709m (15 241) and for discontinued operations was SEK -262m (-2 340). In 2013 SEK -1 875m was reclassified to the income statement from other comprehensive income related to the sale of the Ukrainian operations, compared with a corresponding reclassification of SEK -223m in 2014 to wind down the Russian operations. Profit before impairments increased by 7 per cent to SEK 21 702m (20 290). Baltic Banking and LC&I improved their results, but Group Treasury within Group Functions & Other increased the most. Profit within Swedish Banking was stable. The return on equity for continuing operations improved to 15.2 per cent (14.7). The cost/income ratio was 0.45 (0.45). Profit before impairments by business segment excl FX effects Full-year Full-year ∆ SEKm 2014 2013 SEKm Sw edish Banking 11 926 12 027 -101 Baltic Banking 3 590 3 340 250 Large Corporates & Institutions 4 423 4 299 124 Group Functions & Other 1 763 836 927 Total excl FX effects 21 702 20 502 1 200 FX effects 0 -212 212 Total 21 702 20 290 1 412 Income rose by 6 per cent to SEK 39 304m (36 938). All business segments and the acquisition of Sparbanken Öresund contributed to the higher income. Stronger commission income and net interest income contributed
- 7. Swedbank –Year-end report 2014 Page 7 of 62 the most. Net gains and losses on financial items also increased, while other income excluding one-off effects decreased by SEK 461m from the acquisition of Sparbanken Öresund. Changes in exchange rates increased income by SEK 325m. Net interest income rose by 3 per cent to SEK 22 642m (22 029). Group Treasury’s net interest income improved thanks to falling market interest rates. Repricing and increased deposit volumes contributed positively in Baltic Banking, while higher lending volumes and origination fees contributed to the improvement in LC&I. Swedish Banking’s net interest income decreased. Lower market interest rates had an adverse effect, while increased lending volumes and higher mortgage margins contributed positively. Increased provisions to the stability fund reduced net interest income by SEK 125m. Fluctuations in exchange rates increased net interest income by SEK 164m. Net commission income rose by 11 per cent to SEK 11 204m (10 132). Commission income from asset management was higher, mainly due to a bullish stock market, but also to net inflows. Card and real estate brokerage commissions rose as well, as did loan-related income. Net gains and losses on financial items at fair value rose by 34 per cent to SEK 1 986m (1 484). The net result in Group Treasury within Group Functions & Other was less negative in 2014 mainly due to the positive effects of falling interest rates. Net gains and losses on financial items at fair value within LC&I were stable. Other income increased by 5 per cent to SEK 3 472m (3 293), but decreased excluding one-off effects. In the second quarter 2014 a bargain purchase gain of SEK 461m was recognised on the acquisition of Sparbanken Öresund, in addition to one-off income of SEK 230m from the share of profit of the associated company Entercard. As a result of its significantly smaller property portfolio, Ektornet saw less sales activity year-on-year, which negatively affected other income. Expenses increased by 6 per cent to SEK 17 602m (16 648), slightly below target. Of the total expenses, SEK 615m were one-off expenses resulting from the acquisition of Sparbanken Öresund in the second quarter 2014. Excluding Sparbanken Öresund expenses decreased slightly. Expenses within Group Functions & Other decreased the most, mainly due to Ektornet. Baltic Banking’s expenses decreased in local currency. Expenses rose in Swedish Banking and LC&I. Changes in exchange rates increased expenses by SEK 113m. Fixed staff costs rose as a result of an increased number of customer advisors and IT staff as well as salary adjustments. Variable payroll expenses decreased. Expenses for IT development were higher. Consulting expenses rose due to the integration of Sparbanken Öresund. Higher business activity increased compensation to the savings banks. Less cash handling and the outsourcing of ATMs led to lower expenses for transport and security. Expenses of SEK 136m were recognised in 2014 for the move to the new head office. The number of full-time employees increased by 318 year-on-year due to the acquisition of Sparbanken Öresund. The number of positions in Group Functions & Other decreased due to reduced staff in Group Products – a result of increased efficiencies and digitised processes – and the winding down of Ektornet. Baltic Banking also reduced its staff. The number of full-time employees rose within LC&I as a result of conscious efforts to expand advisory services. In Swedish Banking the number of employees was stable excluding Sparbanken Öresund. Credit impairments increased to SEK 419m (60). Baltic Banking reported recoveries but at a lower level than in 2013. LC&I reported higher credit impairments, mainly due to increased provisions for a problem loan in the third quarter. Credit impairments within Swedish Banking were lower. Tangible asset writedowns were SEK 256m (693), a decrease attributable to Ektornet. Intangible asset writedowns fell to SEK 1m (182). The tax expense amounted to SEK 4 301m (4 099), corresponding to an effective tax rate of 20.5 per cent (21.2). The 2014 tax rate was lower than in 2013 due to a number of negative one-off effects during the fourth quarter 2013. The underlying tax expense is higher as of 2014 due to the Group’s new dividend distribution policy, whereby about 60 per cent of profits generated by the Baltic subsidiaries from 2014 will be distributed to the parent company, Swedbank AB. Since profit in Estonia is not taxed until distribution, the policy has resulted in an increased tax expense for accounting purposes. In addition, the 2014 tax expense was positively affected by a tax-exempt gain in connection with the acquisition of Sparbanken Öresund, but also by almost offsetting impairments by Ektornet. Credit and asset quality Global political and economic tensions continued, with sharply falling energy prices, an economic slowdown in Russia and major currency movements, as well as a slower recovery in Europe. Although this increased risks in general, it did not significantly affect the Group’s credit quality in its four home markets during the quarter. The falling oil prices affect companies in the offshore industry, especially the drilling and supply segments. The bank is not seeing any significant effects yet, since companies in these sectors have taken measures to hedge future cash flows. If low oil prices persist, the risk would increase, however. Total net lending to the shipping & offshore sector amounted to SEK 30.3bn. Of this amount, SEK 19.6bn related to offshore, including SEK 13.6bn from drilling & supply customers, and mainly comprises lending to stable, publicly listed companies with long-term customer contracts that are considered to have a lower risk than the sector in general. For other private and corporate customers, including companies active in shipping, the lower oil prices have had a neutral to positive effect. The bank’s direct credit exposures to Russia further decreased to SEK 0.5bn at year-end. During the fourth quarter impairments of SEK 0.3bn were recognised in the Russian portfolio as a result of the sale of loans as the operations wind down and because of the weaker rouble. The Russian operations are reported as discontinued operations. The bank’s total credit portfolio is distinguished by customers with low risk and good resilience in the event of an economic slowdown. During the quarter the European Central Bank and the European Banking Authority (EBA) confirmed the bank’s strong credit quality and capitalisation in their respective stress tests. Swedbank’s lending increased by SEK 111bn or 9 per cent during the year to SEK 1 325bn, of which SEK 14bn is due to currency effects. Of the increase, SEK
- 8. Swedbank –Year-end report 2014 Page 8 of 62 38bn related to the fourth quarter, of which SEK 7bn to exchange rate effects. Mortgage lending in Sweden rose by SEK 37bn during the year. Corporate lending within Swedish Banking and LC&I increased by a total of SEK 57bn. The highest activity was in the property management sector, where Swedbank already had a strong position. The acquisition of Sparbanken Öresund in the second quarter increased lending by SEK 16.5bn, of which SEK 5.0bn was private lending and SEK 11.5bn corporate lending. Baltic Banking’s lending portfolio grew slightly in Estonia and Lithuania, measured in local currency, but decreased slightly in Latvia. During the fourth quarter the Swedish Financial Supervisory Authority (SFSA) proposed new amortisation requirements for Swedish mortgages whereby new mortgages will be repaid down to a 50% loan-to-value ratio. The rules are expected to be finalised in the first half of 2015. Swedbank already requires loan applicants to be able to handle similar amortisation levels. During the last 12 months 87 per cent of new mortgages granted in Sweden with a loan- to-value ratio over 70 per cent were being amortised. Amortisations in the Swedish mortgage portfolio amounted to about SEK 10.1bn in 2014. The average loan-to-value ratio for Swedbank’s mortgages in Sweden was 60.1 per cent (62.2 as of 31 December 2013), based on property level as of year-end. For more information, see page 20 and pages 56-57 in the fact book. Impaired loans decreased during the year by SEK 1.2bn to SEK 6.3bn and correspond to 0.41 per cent (0.55) of total lending. The provision ratio for impaired loans was 35 per cent (38). The total provision ratio, i.e. including portfolio provisions, was 53 per cent (54). The share of impaired mortgages in Baltic Banking continued to fall and now amounts to SEK 4.0bn. The share of Swedish mortgages past due by more than 60 days remained low at 0.07 per cent of the portfolio (0.09). For more information on credit risk, see pages 48-55 of the fact book. Impaired loans, by business segment Dec 31 Dec 31 SEKm 2014 2013 Sw edish Banking 1 642 1 547 Baltic Banking 3 991 5 046 Estonia 1 312 1 338 Latvia 1 465 2 145 Lithuania 1 214 1 563 Large Corporates & Institutions 648 906 Total 6 281 7 499 Credit impairments amounted to SEK 419m (60) during the year and related to new provisions for anticipated credit impairments within LC&I and Swedish Banking. The provisions relate to a few exposures. Baltic Banking reported continued recoveries, though at a lower level. Credit impairments, net by business segment Full-year Full-year SEKm 2014 2013 Sw edish Banking 246 338 Baltic Banking -186 -437 Estonia -31 -267 Latvia -106 2 Lithuania -49 -172 Large Corporates & Institutions 381 180 Group Functions & Other -22 -21 Total 419 60 Repossessed assets have more than halved during the year to SEK 933m on 31 December, of which Ektornet accounted for SEK 778m. Ektornet’s property values were written down by SEK 243m (652) during the year, mainly related to the US and Ukraine, of which SEK 23m was in the fourth quarter. For more information on repossessed assets, see page 35 of the fact book. Funding and liquidity The year saw a further decline in interest rates and lower credit spreads, even though the latter increased slightly during the fourth quarter. Activity in domestic and international capital markets was high. The introduction of new capital adequacy rules led to increased issuance of Tier 2 capital by banks in Europe. Demand for Swedbank’s bonds and commercial paper remained high. Swedbank issued a total of SEK 115bn (103) in long- term debt during the year. The most important source of financing, covered bonds, accounted for SEK 92bn (73). During the fourth quarter SEK 26bn was issued, of which SEK 23bn was covered bonds. The entire volume was issued in SEK. Other volumes refer to unsecured debt. In 2015 Swedbank plans to issue around SEK 160bn to meet increased lending volumes as well as maturing long-term funding with a nominal value of SEK 110bn, measured from the beginning of the year. Liquidity over and above the refinancing need is used in day-to-day management to repurchase covered bonds. At year-end 2014 the total volume of short-term funding, which is mainly used as a cash management tool, amounted to SEK 195bn (100), of which SEK 127bn was placed with central banks. The main liquidity measure is the survival horizon, which showed that the bank as of 31 December would survive more than 12 months with the capital markets completely shut down. This applies to total liquidity as well as liquidity in USD and EUR. For more information on the bank’s funding and liquidity, see page 68 of the fact book. Ratings In 2014 Fitch revised its outlook for Swedbank’s rating to positive. Standard & Poor’s raised the bank’s individual ratings. At the same time it revised its outlook for the ratings of Swedbank and 50 European banks to negative as a consequence of the EU Parliament’s approval of the EU’s Bank Recovery and Resolution Directive (BRRD). Moody’s also revised its outlook on Swedbank and a number of other European banks to negative due to the BRRD. No ratings events occurred during the fourth quarter.
- 9. Swedbank –Year-end report 2014 Page 9 of 62 Capital and capital adequacy The Common Equity Tier 1 capital ratio was 21.2 per cent on 31 December (20.7 per cent on 30 September and 18.3 per cent on 31 December 2013). In June Swedbank received approval from the SFSA to use the advanced internal ratings-based (A-IRB) approach for its corporate exposures in Sweden and Norway, which positively affected the Common Equity Tier 1 capital ratio by 3.8 percentage points calculated as of 30 June. Common Equity Tier 1 capital increased by SEK 3.2bn during the fourth quarter to SEK 87.9bn. The change was mainly due to the bank’s profit after deducting the proposed dividend and a dividend of SEK 1.35bn from Swedbank’s Swedish life insurance operations. The remeasurement of the estimated pension liability according to IAS 19 increased Common Equity Tier 1 capital by about SEK 1.1bn, which is mainly due to a lower wage increase assumption. While the discount rate continued to fall, lower inflation expectations offset the negative effect (for more information, see note on Other comprehensive income). During the quarter the EBA published a new interpretation of how trading in own shares and capital instruments in the securities operations affect capital. As a result, the maximum holding approved by the supervisory authority now has to be deducted, compared with previous practice where the actual holding was deducted. This affected Common Equity Tier 1 capital negatively by about SEK 0.4bn as of 31 December. Change in Common Equity Tier 1 capital Basel 3, 2014, Swedbank consolidated situation 80.8 87.91.1 -0.1 5.1 -2.9 84.7 50 55 60 65 70 75 80 85 90 95 100 SEKbn Increase Decrease The risk exposure amount (REA) increased by just under SEK 4.6bn during the fourth quarter to SEK 414.2bn on 31 December (409.6 as of 30 September). The REA for credit risks rose by SEK 4.3bn, mainly due to increased exposures to mortgages and corporate customers in Swedish Banking and LC&I. Positive rating migrations reduced the REA by SEK 7.5bn. The biggest contribution was from the Baltic operations, where the use of loss histories for large companies based on actual outcomes was approved by the SFSA. Positive migrations from the Swedish corporate portfolio also contributed to the decrease. Reviews of Swedish corporate exposures led to improved information on collateral and accounted for a significant share of the decrease in LGD (see figure below). Fluctuations in exchange rates, mainly attributable to the Baltic credit portfolio, increased the REA for credit risks due to the depreciation of the Swedish krona against the euro. The REA for credit valuation adjustment (CVA risk) decreased by SEK 1.3bn as a result of improved processes and methods of risk measurement. The REA for market risks increased by SEK 1.5bn, mainly due to a slightly higher interest rate risk. The REA for operational risks was unchanged during the quarter. Change in REA Basel 3, 2014, Swedbank consolidated situation 18.0 -7.5 -9.8 3.1 0.6 -1.3 1.5 440.6 409.6 414.2 360 370 380 390 400 410 420 430 440 450 SEKbn Increase Decrease Continued uncertainty about capital regulations Because of the risk weight floor of 25 per cent for the Swedish mortgage portfolio, Swedbank has to maintain additional Common Equity Tier 1 capital of SEK 21.0bn for Swedish mortgages, corresponding to a Common Equity Tier 1 capital ratio of 5.1 percentage points according to Pillar 1. In its internal controls Swedbank allocates capital to accommodate the new capital requirements as of the fourth quarter 2014, including a 25 per cent risk weight floor for Swedish mortgages. At the end of the year the SFSA presented a proposal for standardised models for Pillar 2 risks, which will be implemented in 2015. As a result, their capital requirements are likely to be clarified as well, including the total capital requirement for Swedish banks. The capital requirement for Swedbank, calculated as of 31 December and assuming that Swedbank’s capital requirement for Pillar 2 risks is in line with the SFSA’s standard value for Swedish banks (1.5 per cent), is equivalent to a Common Equity Tier 1 capital ratio of 19.3 per cent. Consideration is also given to the pending introduction of a systemic risk buffer (January 2015) and a countercyclical buffer (September 2015). Swedbank’s Common Equity Tier 1 capital ratio was 21.2 per cent at year-end. At the same time that the Swedish capital requirements have been clarified, an international effort is underway
- 10. Swedbank –Year-end report 2014 Page 10 of 62 regarding future capital requirements for banks. Among other things, the Basel Committee is conducting an extensive analysis to improve the comparability of banks’ capital ratios. The review covers future standard methods for calculating capital requirements for credit, market and operational risks. The committee may also propose a capital floor based on the standard methods for banks that use internal models. Due to uncertainty about the specifics of the new regulations as well as how and when they will be implemented, it is still too early to draw any conclusions on the potential impact on Swedbank. An evaluation of the leverage ratio is also underway ahead of the possible introduction of a minimum requirement in 2018. Swedbank’s leverage ratio as of 31 December, taking into account the EU Commission’s clarification of the definition, was 4.5 per cent (4.4 per cent on 30 September 2014 and 4.6 per cent on 31 December 2013). According to external stress tests, Swedbank is among the banks with the lowest risk in Europe. The Riksbank’s most recent stability report from November (Financial Stability 2014:2) indicates that Swedbank’s Common Equity Tier 1 ratio was the least impacted in a stress test among Sweden’s four major banks. Operational risks The bank’s direct losses attributable to operational risks remained low. No major incidents occurred during the fourth quarter 2014. For more information on market risks, see Note 23 and see page 89 of the fact book. Other events On 17 June the Swedish Competition Authority sued the subsidiary Swedbank Franchise for its acquisition of Svensk Fastighetsförmedling. The Swedish Competition Authority was of the opinion that the acquisition would impede competition. In December the Stockholm District Court announced that it prohibited the acquisition. The ruling has been appealed to the Swedish Market Court. If the Market Court ratifies the decision from Stockholm District Court, it means that the acquisition is prohibited and hence the transaction shall be reversed. The case is not expected to have any material economic consequences. In December the Swedish Shareholders' Association filed a class action against Swedbank Robur with the National Board for Consumer Disputes (ARN). The Swedish Shareholders' Association claims that two funds, Allemansfond Komplett and Kapitalinvest, were not actively managed for an extended period and that Swedbank Robur therefore should repay a portion of the management fee. The issue of active versus passive management is complicated and affects not only Swedbank Robur but is of fundamental importance to the industry in Sweden and abroad. Swedbank disputes that the funds have not been actively managed and believes it was clear in explaining its management approach and the fees it charges. Events after 31 December 2014 The rapid changes in the ways customers bank require stronger coordination of the bank’s offerings and simpler internal processes. Consequently, Birgitte Bonnesen, former head of Baltic Banking, was named head of Swedish Banking as of 1 January 2015. Priit Perens is the new head of Baltic Banking. Both are members of the Group Executive Committee, which also added Viveka Strangert, head of Group Compliance. Lithuania adopted the euro as its currency on 1 January 2015.
- 11. Swedbank –Year-end report 2014 Page 11 of 62 Swedish Banking Competitive offering strengthened market position Lower market interest rates adversely affected net interest income Digital channels report high customer satisfaction Income statement Q4 Q3 Q4 Full-year Full-year SEKm 2014 2014 % 2013 % 2014 2013 % Net interest income 3 301 3 372 -2 3 448 -4 13 349 13 620 -2 Net commission income 1 821 1 746 4 1 649 10 7 006 6 364 10 Net gains and losses on financial items at fair value 93 47 98 31 244 126 94 Share of profit or loss of associates 94 220 -57 210 -55 980 850 15 Other income 246 182 35 198 24 1 194 761 57 Total income 5 555 5 567 0 5 536 0 22 773 21 721 5 Staff costs 957 971 -1 888 8 4 207 3 497 20 Variable staff costs 61 55 11 67 -9 219 230 -5 Other expenses 1 565 1 506 4 1 528 2 6 259 5 835 7 Depreciation/amortisation 48 49 -2 43 12 162 132 23 Total expenses 2 631 2 581 2 2 526 4 10 847 9 694 12 Profit before impairments 2 924 2 986 -2 3 010 -3 11 926 12 027 -1 Credit impairments 147 43 140 5 246 338 -27 Operating profit 2 777 2 943 -6 2 870 -3 11 680 11 689 0 Tax expense 560 645 -13 616 -9 2 408 2 517 -4 Profit for the period 2 217 2 298 -4 2 254 -2 9 272 9 172 1 Profit for the period attributable to the shareholders of Swedbank AB 2 217 2 292 -3 2 249 -1 9 258 9 158 1 Non-controlling interests 0 6 5 14 14 0 Return on allocated equity, % 20.3 25.9 27.7 25.4 28.0 Loan/deposit ratio, % 249 250 244 249 244 Credit impairment ratio, % 0.06 0.02 0.06 0.03 0.04 Cost/income ratio 0.47 0.46 0.46 0.48 0.45 Loans, SEKbn 1 024 1 005 2 937 9 1 024 937 9 Deposits, SEKbn 411 402 2 385 7 411 385 7 Full-time employees 5 396 5 448 -1 4 984 8 5 396 4 984 8 Development January - December The result for the period amounted to SEK 9 258m, an increase of 1 per cent. Income and expenses both increased, mainly as a result of the acquisition of Sparbanken Öresund, while credit impairments decreased. Net interest income decreased year-on-year as a result of lower deposit margins, which were adversely affected by lower market interest rates. This was largely offset by higher lending volumes. Mortgage margins rose on both new lending and the mortgage portfolio, mainly during the second half-year, to compensate for higher capital adequacy requirements in the form of higher risk weights for mortgages. As of the fourth quarter capital equivalent to a 25% risk weight floor is allocated to the business area for Swedish mortgages. The acquisition of Sparbanken Öresund positively contributed to net interest income. Compared with the third quarter net interest income decreased slightly. Increased lending volumes and slightly improved mortgage margins during the quarter could not fully compensate for lower deposit margins owing to falling market interest rates. Lending margins on new mortgages were stable. The cost of the stability fee increased due to a retroactive adjustment during the fourth quarter, which negatively affected net interest income by SEK 52m. Household deposit volumes increased by SEK 16bn from the beginning of the year, with volumes from the acquisition of Sparbanken Öresund accounting for SEK 8bn. Swedbank’s share of household deposits was 21 per cent at the end of the period (21 as of 31 December 2013). Corporate deposits within Swedish Banking increased by SEK 11bn from the beginning of the year, or by 10 per cent. Sparbanken Öresund accounted for SEK 4bn. Swedbank’s market share, including corporate deposits within LC&I, was 19 per cent as of 31 December (18 per cent as of 31 December 2013). Swedbank’s household mortgage lending volume increased by SEK 37bn during the year, of which SEK 11bn during the fourth quarter. Swedbank’s share of new sales increased during the quarter and its share of net growth was 24 per cent during the period January-December 2014. Swedbank’s share of the total market was 25 per cent (25 as of 31 December 2013). Corporate lending volume increased by SEK 37bn from the beginning of the year, with Sparbanken Öresund accounting for SEK 11bn. The market share, including corporate lending within LC&I, increased to 19 per cent (17 per cent as of 31 December 2013). Growth was mainly in the property management sector. Net commission income rose by 10 per cent during the year. The increase was mainly due to higher fund volumes in the wake of a bullish stock market and increased net inflows. Swedbank’s market share in terms of assets under management was 23 per cent (24 as of 31 December 2013). Increased income from equity trading and real estate brokerage contributed
- 12. Swedbank –Year-end report 2014 Page 12 of 62 positively. Card commissions rose as a result of increased card usage. Compared with the third quarter net commission income rose by SEK 75m, mainly due to higher income from trading in structured products as well as higher card and payment commissions. Increasing inflows to index funds and funds with lower fees continued during the fourth quarter. A number of price cuts were implemented on fixed income, index- linked and generational funds during the fourth quarter. This had only a slight financial impact in the quarter but will negatively affect income in 2015. The price cuts were made to ensure a competitive offering in the current low interest rate environment. The share of associates’ profit increased compared with the previous year, when one-off income of SEK 230m was recognised by the credit card company Entercard during the second quarter 2014. Compared with the third quarter the share of associates’ profit decreased mainly due to seasonally higher expenses and credit impairments in Entercard. Other income was positively affected compared with the previous year by the acquisition of Sparbanken Öresund. During the second quarter 2014 a bargain purchase gain of SEK 461m was recognised. Expenses for the year increased mainly due to the acquisition of Sparbanken Öresund, in connection with which a one-off expense of SEK 615m was recognised. The integration of the company raised expenses as well. Staff costs increased due to the addition of slightly more advisors and higher salary costs. Cash handling expenses fell. Expenses for the fourth quarter increased slightly, mainly due to increased expenses for IT development and premises. Staff costs decreased. Credit quality remained good. Credit impairments decreased year-on-year and remained at low levels. During the fourth quarter credit impairments amounted to SEK 147m, mainly consisting of lower provisions for anticipated credit impairments within various corporate sectors. The share of impaired loans was 0.15 per cent (0.16). Swedbank’s customer satisfaction is measured by the Swedish Quality Index (SQI) and the Customer Satisfaction Index (CSI). The former encompasses around 300 of the bank’s customers and the latter over 40 000. While there is still much left to be done to raise customer satisfaction, the most recent CSI survey in the fourth quarter showed that the trend is pointing in the right direction after an improvement of 2 points among both private and corporate customers. Improvements were made across the board, with the branches reporting the lowest satisfaction making the biggest gains. Customer satisfaction with the bank’s digital services is high; 90 per cent of customers give the bank a 4 or 5 on a five-point scale. The bank’s customer satisfaction according to SQI is below the industry average at 64 (-2) for private customers and 66 (+2) for corporate customers. Use of Swedbank’s digital channels continues to grow. The Internet Bank had 3.7 million users as of 31 December, an increase of 126 000 during the year. The Mobile Bank had 2 million (+419 000) and the iPad Bank had 521 000 (+136 000). Digitisation strongly contributed to a year-on-year decrease of 15 per cent in the number of teller transactions in branches. At the same time the number of advisory consultations rose by 4 per cent. Sweden is Swedbank’s largest market, with around 4 million private customers and more than 250 000 corporate customers. This makes it Sweden’s largest bank by number of customers. Through our digital channels (Telephone Bank, Internet Bank, Mobile Bank and iPad Bank) and branches, and with the support of savings banks and franchisees, we are always available. Swedbank is part of the local community. The bank’s branch managers have a strong mandate to act in their local communities. The bank’s presence and engagement are expressed in various ways. A project called “Young Jobs”, which has created several thousand trainee positions for young people, has played an important part in recent years. Swedbank has 314 branches in Sweden. The various product areas are described on page 20. Baltic Banking
- 13. Swedbank –Year-end report 2014 Page 13 of 62 Stable net interest income despite lower interest rates No financial impact from situation in Russia Successful introduction of euro in Lithuania Income statement Q4 Q3 Q4 Full-year Full-year SEKm 2014 2014 % 2013 % 2014 2013 % Net interest income 863 865 0 844 2 3 496 3 156 11 Net commission income 505 500 1 454 11 1 956 1 733 13 Net gains and losses on financial items at fair value 64 60 7 84 -24 239 316 -24 Other income 101 88 15 130 -22 416 420 -1 Total income 1 533 1 513 1 1 512 1 6 107 5 625 9 Staff costs 216 186 16 204 6 782 782 0 Variable staff costs 20 19 5 20 0 78 66 18 Other expenses 401 374 7 384 4 1 513 1 453 4 Depreciation/amortisation 37 36 3 56 -34 144 155 -7 Total expenses 674 615 10 664 2 2 517 2 456 2 Profit before impairments 859 898 -4 848 1 3 590 3 169 13 Impairment of intangible assets 0 0 1 1 1 0 Impairment of tangible assets 9 3 16 -44 10 23 -57 Credit impairments -10 -59 -83 -177 -94 -186 -437 -57 Operating profit 860 954 -10 1 008 -15 3 765 3 582 5 Tax expense 128 142 -10 182 -30 565 393 44 Profit for the period 732 812 -10 826 -11 3 200 3 189 0 Profit for the period attributable to the shareholders of Swedbank AB 732 812 -10 826 -11 3 200 3 189 0 Return on allocated equity, % 13.9 15.7 15.0 14.6 14.0 Loan/deposit ratio, % 91 97 100 91 100 Credit impairment ratio, % -0.04 -0.19 -0.59 -0.16 -0.37 Cost/income ratio 0.44 0.41 0.44 0.41 0.44 Loans, SEKbn 126 121 4 119 6 126 119 6 Deposits, SEKbn 138 125 10 120 15 138 120 15 Full-time employees 3 912 3 846 2 3 935 -1 3 912 3 935 -1 Development January - December Profit for 2014 amounted to SEK 3 200m (3 189). Income rose mainly due to increased business activity and repricing, while expenses in local currency decreased as a result of higher efficiency. Recoveries were lower. Changes in exchange rates improved profit by SEK 149m. Net interest income increased by 6 per cent in local currency in 2014 mainly due to repricing and higher deposit volumes. Changes in exchange rates improved net interest income by SEK 166m. Net interest income in local currency dropped 1 per cent in the fourth quarter from lower deposit margins due to lower market interest rates. Lending volumes were stable in local currency compared with 31 December 2013. Consumer finance increased, corporate lending and private mortgages were flat, while leasing decreased. The lending portfolios increased slightly in Lithuania and Estonia but continued to decrease in Latvia. The loan portfolio in local currency was stable during the fourth quarter despite external uncertainties. Swedbank’s market share for lending was 29 per cent as of 30 September (28 as of 31 December 2013). Deposit volumes increased by 9 per cent in local currency during the year. Deposits increased in all countries, with the biggest increase in Lithuania due to the euro transition. Swedbank’s market share in deposits was 29 per cent as of 30 September (30 per cent as of 31 December 2013). The loan-to-deposit ratio was 91 per cent (100 per cent as of 31 December 2013). Net commission income rose by 7 per cent in local currency in 2014. Increased card usage and higher asset management volumes due to the stock market rise and net inflows were the main reasons. Net commission income was negatively affected by about SEK 79m during the year due to fewer international payments after the euro transition in Latvia. Net commission income during the quarter was stable. Net gains and losses on financial items at fair value decreased by 28 per cent in local currency during the year. The decrease was mainly due to lower income of SEK 74m from the Latvian FX trading business as a result of the euro transition. Other income decreased by 5 per cent in local currency in 2014 due to lower insurance-related income. The decrease is mainly attributable to the low interest rates, which have led to increased provisions for guaranteed- return products within traditional management. Total expenses decreased by 2 per cent in local currency during the year. Expenses for staff and premises fell, while IT development and regulatory expenses rose. The number of full-time employees was 1 per cent lower than on 31 December 2013. Due to customers’ increasing use of digital services, the number of branches was reduced by 25 to 156 during
- 14. Swedbank –Year-end report 2014 Page 14 of 62 the year. Of the total number of branches at year-end 2014, 47 (15) were cash-smart branches with a focus on advisory services. In addition, capacity at advisory centres has been strengthened through the addition of new advisory teams dedicated to small businesses. The euro adoption in Lithuania and Latvia raised expenses by SEK 69m in 2014, mainly in IT. Increased IT development expenses were the result of investments in digital channels and improved customer offerings. The cost-income ratio improved to 0.41 (0.44). During the fourth quarter expenses rose by 8 per cent in local currency driven by the euro adoption, marketing activities and seasonally higher staff costs, as well as salary adjustments in the Estonian retail operations. The number of full-time employees rose by 2 per cent in the fourth quarter, a result of the hiring of 50 temporary employees in connection with the euro adoption in Lithuania. Net recoveries in 2014 amounted to SEK 186m (437) and related to recoveries from both private and corporate customers. All three countries reported net recoveries. Swedbank continues to work with, and take preventive measures, to help customers that could be affected by the situation in Russia. No major spillover effects have been observed on customers’ finances or business activity. Impaired loans amounted to SEK 4.0bn (5.0) at year- end. Credit quality has improved to such a level that impaired loans are now decreasing at a more moderate pace than in the last two years. The results of the stress test and credit review by the European Central Bank (ECB) and European Banking Authority (EBA) confirmed Swedbank’s strong credit quality and capital situation and showed that the Baltic subsidiaries are well-positioned to withstand highly stressed economic conditions. In 2014 Swedbank adopted a new policy on profit distributions from the Baltic operations, whereby around 60 per cent of earnings generated in the Baltic subsidiaries as of 2014 will be distributed to the parent company, Swedbank AB. Profit in Estonia is not taxed until distribution, which means that deferred tax is now recognised on the estimated distribution from Estonia, even though it will not be paid until the first quarter 2015. For 2014 deferred tax of SEK 207m was recognised for future distributions. Swedbank maintained its strong reputation in 2014 and was placed fourth in a Baltic survey of “Most Loved Brands”. On 1 January 2015 Lithuania successfully adopted the euro in a smooth transition. Swedbank is the largest bank by number of customers in Estonia, Latvia and Lithuania, with around 4 million private customers and more than 250 000 corporate customers. According to surveys, Swedbank is also the most respected company in the financial sector. Through its digital channels (Telephone Bank, Internet Bank and Mobile Bank) and branches, the bank is always available. Swedbank is part of the local community. Its local social engagement is expressed in many ways, with initiatives to promote education, entrepreneurship and social welfare. Swedbank has 40 branches in Estonia, 48 in Latvia and 68 in Lithuania. The various product areas are described on page 20. Large Corporates & Institutions
- 15. Swedbank –Year-end report 2014 Page 15 of 62 Stable result under volatile market conditions Strong lending growth primarily in property sector High activity in corporate finance Income statement Q4 Q3 Q4 Full-year Full-year SEKm 2014 2014 % 2013 % 2014 2013 % Net interest income 888 876 1 889 0 3 477 3 387 3 Net commission income 529 561 -6 558 -5 2 216 1 968 13 Net gains and losses on financial items at fair value 433 354 22 491 -12 1 927 1 960 -2 Other income 20 36 -44 48 -58 121 167 -28 Total income 1 870 1 827 2 1 986 -6 7 741 7 482 3 Staff costs 356 338 5 303 17 1 339 1 155 16 Variable staff costs 67 71 -6 118 -43 288 409 -30 Other expenses 407 411 -1 443 -8 1 625 1 591 2 Depreciation/amortisation 15 15 0 17 -12 66 58 14 Total expenses 845 835 1 881 -4 3 318 3 213 3 Profit before impairments 1 025 992 3 1 105 -7 4 423 4 269 4 Impairment of intangible assets 0 0 0 0 56 Credit impairments 120 270 -56 5 381 180 Operating profit 905 722 25 1 100 -18 4 042 4 033 0 Tax expense 225 150 50 360 -38 892 1 042 -14 Profit for the period 680 572 19 740 -8 3 150 2 991 5 Profit for the period attributable to the shareholders of Swedbank AB 680 572 19 740 -8 3 150 2 991 5 Return on allocated equity, % 15.1 13.8 20.1 19.4 17.3 Loan/deposit ratio, % 164 154 173 164 173 Credit impairment ratio, % 0.21 0.46 0.01 0.18 0.08 Cost/income ratio 0.45 0.46 0.44 0.43 0.43 Loans, SEKbn 175 161 9 154 14 175 154 14 Deposits, SEKbn 106 104 2 89 19 106 89 19 Full-time employees 1 175 1 142 3 1 069 10 1 175 1 069 10 Development January - December The result for the full-year amounted to SEK 3 150m, an increase of 5 per cent year-on-year. Income, expenses and credit impairment increased. The long-term strategy to strengthen expertise in specific industrial sectors and deepen customer relationships in these areas produced results in the form of increased business and new customers during the year. Net interest income increased by 3 per cent in 2014 to SEK 3 477m. Higher average lending volumes and origination fees contributed to the improvement. Margins in the lending portfolio were stable. Lending volume increased continuously in 2014 to SEK 175bn (154) at year-end. The biggest volume increases were in the property management sector, the fastest growing sector in Sweden. New business and a higher take-up rate on existing commitments contributed to the increase. Changes in exchange rates contributed about SEK 6bn of the increase. Deposit volumes rose by 19 per cent during the year, or by SEK 17bn. Transaction flows from large corporates and financial institutions increased as a result of closer customer relationships. Net interest income increased by 1 per cent during the fourth quarter mainly as a result of higher lending volumes. Activity in the lending market remained high and the refinancing of past due loans continued. Lending volumes increased during the quarter by SEK 14bn, the large part of which was at the end of the quarter. Changes in exchange rates contributed about SEK 2bn of the increase. A retroactive adjustment during the fourth quarter related to the stability fee reduced net interest income by SEK 17m. The margin on the loan portfolio was stable. Net commission income rose by 13 per cent in 2014 to SEK 2 216m. The low interest rate environment and rising equity prices have led to higher activity among the bank’s corporate customers, which has increased commissions related to corporate finance. Swedbank participated in five of 13 IPOs in Sweden in 2014, making it one of the three market leaders. New customers and increased lending contributed to higher loan commissions. The bank’s market share for Swedish bond issues was 20 per cent (21) in 2014. The corresponding figure in Norway was 18 per cent (18). This made Swedbank the second largest player in Sweden and the third largest in Norway. During the fourth quarter net commission income decreased by 6 per cent. Lending and card commissions were the biggest contributors to the decrease. Activity and earnings from corporate finance increased. During the quarter Swedbank was a leading advisor in Entra’s IPO in Norway and in the preference share offerings by Akelius and Hemfosa in Sweden. Net gains and losses on financial items at fair value decreased by 2 per cent year-on-year. Income from fixed income and equity products rose. During the fourth quarter net gains and losses on financial items increased by 22 per cent to SEK 433m. FX trading performed strongly during the quarter. Equity trading also developed positively after a seasonally weaker third quarter. Customer activity decreased in other products largely due to 0 per cent interest rates and falling oil prices.
- 16. Swedbank –Year-end report 2014 Page 16 of 62 Total expenses increased by 3 per cent compared with 2013. Staff costs rose as a result of the hiring of advisors for bond issues and corporate finance as well as salary revisions. New product development, investments in the cash management area and IT investments in the wake of increased regulatory requirements raised expenses for IT and IT-related staff. Expenses increased by 1 per cent compared with the previous quarter, mainly due to the additional staff. Credit impairments amounted to SEK 381m in 2014 (180). The increase was attributable to higher provisions for a single problem loan in the retail sector. The share of impaired loans was 0.22 per cent (0.38). Credit quality in the loan portfolio remained good despite increased risks during the quarter. If low oil prices persist, the risk in the shipping & offshore sector could increase, mainly with respect to drilling & supply customers of the Norwegian operations. Total net lending in shipping & offshore amounted to SEK 29.3bn. See also the credit section on page 7. Large Corporates & Institutions is responsible for Swedbank’s offering to customers with revenues above SEK 2 billion and those whose needs are considered complex due to multinational operations or a need for sophisticated financing solutions. They are also responsible for developing corporate and capital market products for other parts of the bank and the Swedish savings banks. LC&I works closely with customers, who receive advice on decisions that create sustainable profits and growth. LC&I have presence in Sweden, Norway, Estonia, Latvia, Lithuania, Finland, Luxembourg, China, the US and South Africa. Group Functions & Other
- 17. Swedbank –Year-end report 2014 Page 17 of 62 Income statement Q4 Q3 Q4 Full-year Full-year SEKm 2014 2014 % 2013 % 2014 2013 % Net interest income 761 716 6 461 65 2 320 1 880 23 Net commission income 5 -10 4 25 -50 -30 67 Net gains and losses on financial items at fair value -521 338 -145 -424 -918 -54 Share of profit or loss of associates -1 1 -1 0 0 2 Other income 241 248 -3 375 -36 1 060 1 430 -26 Total income 485 1 293 -62 694 -30 2 906 2 364 23 Staff costs 723 772 -6 915 -21 3 124 3 283 -5 Variable staff costs 52 57 -9 72 -28 222 242 -8 Other expenses -643 -733 -12 -603 7 -2 544 -2 380 -7 Depreciation/amortisation 75 87 -14 105 -29 341 394 -13 Total expenses 207 183 13 489 -58 1 143 1 539 -26 Profit before impairments 278 1 110 -75 205 36 1 763 825 Impairment of intangible assets 0 0 11 0 125 Impairment of tangible assets 24 16 50 295 -92 246 670 -63 Credit impairments -3 -19 -84 0 -22 -21 5 Operating profit 257 1 113 -77 -101 1 539 51 Tax expense 87 227 -62 54 61 436 147 Profit for the period from continuing operations 170 886 -81 -155 1 103 -96 Profit for the period from discontinued operations, after tax -3 -2 50 -48 -94 -262 -2 340 -89 Profit for the period 167 884 -81 -203 841 -2 436 Profit for the period attributable to the shareholders of Swedbank AB 166 884 -81 -203 839 -2 437 Non-controlling interests 1 0 0 2 1 100 Full-time employees 4 100 4 168 -2 4 277 -4 4 100 4 277 -4 Development January - December Income for Group Functions & Other consists of net interest income and net gains and losses on financial items, which mainly come from Group Treasury. Other income primarily consists of revenue from the savings banks as well as sales revenue and operating income from Ektornet. Income amounted to SEK 2 906m (2 364). Net income and net gains and losses on financial items at fair value within Group Treasury improved mainly due to the effects of falling interest rates. Sales activity within Ektornet has slowed since the portfolio has already been largely sold off, which reduced other income. Expenses decreased by 26 per cent during the year to SEK 1 143m (1 539). Excluding the net of services purchased and sold internally, expenses decreased by 3 per cent to SEK 6 584m (6 814). Group Products reduced expenses through efficiency improvements. Ektornet also reported lower expenses, which are dropping as the portfolio is sold off. In 2014 one-off expenses of SEK 136m were recognised in connection with the move of the head office. Ektornet’s property values were written down by SEK 243m (652) during the year, of which SEK 23m related to the fourth quarter. Group Products Swedbank’s product operations, Group Products (GP), are centralised at the Group level to create a more responsive and customer-driven product range and an efficient product organisation. Consisting of around 1 600 employees in Sweden, Estonia, Latvia and Lithuania, GP is responsible for a large part of Swedbank’s product areas. It is also tasked with supporting the business areas by reducing the complexity of the product range and simplifying sales in the various distribution channels. The product areas GP is responsible for – lending and deposits, payments, cards, asset management and insurance – are described in more detail starting on page 20. GP also comprises the subsidiary Swedbank Franchise AB, which in turn includes the real estate (Fastighetsbyrån and Svensk Fastighetsförmedling) and business brokerages (Företagsförmedling) and a legal service provider (Juristbyrån). In GP’s revenue and expense model, revenue from Swedbank’s customers is posted by each business segment and GP receives compensation from them to cover its expenses. GP’s external revenue largely comes from the savings banks. Expenses, excluding the net of services purchased and sold internally, amounted to SEK 3 246m (3 350) for the full-year. The decrease was mainly due to lower staff costs due to fewer full-time positions. Group Treasury Group Treasury is responsible for the bank’s funding, liquidity and capital planning. The Group’s equity is allocated to each business segment on the basis of capital adequacy rules and how much capital is needed based on the bank's Internal Capital Adequacy Assessment Process (ICAAP). Group Treasury prices all internal deposit and loan flows in the Group through internal interest rates, where the most important parameters are maturity, interest fixing period, currency and need for liquidity reserves. Group Treasury’s result over time should be nearly nil, with the exception of earnings that may arise in debt and liquidity management within given risk mandates. Risk hedging by Group Treasury is generally achieved with financial instruments. The volatility in results over time is largely due to accounting-based fluctuations in these hedges.
- 18. Swedbank –Year-end report 2014 Page 18 of 62 Profit for Group Treasury amounted to SEK 1 639m (841) in 2014. Net interest income increased to SEK 2 431m during the year (2 013). During the fourth quarter net interest income amounted to SEK 785m, compared with SEK 742m in the previous quarter. The improvement in net interest income was mainly attributable to the positive effects of falling interest rates. Net gains and losses on financial items at fair value for 2014 amounted to SEK -340m (-922). The main reason for the improved result was falling interest rates. Net gains and losses for the fourth quarter amounted to SEK -501m, compared with SEK 327m in the third quarter. Net gains and losses decreased mainly as a result of a higher volume of covered bond repurchases and negative valuation effects caused by increased credit spreads. Discontinued operations The result for discontinued operations was SEK -262m (-2 340) in 2014. In the first half of 2013 the Ukrainian operations were included in discontinued operations and affected the result by SEK -2 236m, of which SEK - 1 875m was reclassified to the income statement from other comprehensive income when the business was sold. A corresponding reclassification of SEK -223m was made during the second quarter 2014 to wind down the Russian operations. The result for discontinued operations in the fourth quarter was SEK -3m (-2). The result for Russia was SEK -172m, of which SEK 289m were impairments – a result of loan sales as part of the continued wind-down as well as the depreciation of the rouble. The result for discontinued operations in Lithuania was SEK 168m, of which SEK 163m was a capital gain from the sale of a shareholding. Swedbank’s net lending in Russia continued to decrease and amounted to SEK 0.5bn as of 31 December. Group Functions & Other consists of centralised business support units and the product organisation Group Products. The Group staffs comprise Accounting & Finance (including Group Treasury and Communications), Risk, IT, Compliance, Public Affairs, HR and Legal, operate across business areas, and serve as strategic and administrative support.
- 19. Swedbank –Year-end report 2014 Page 19 of 62 Eliminations Income statement Q4 Q3 Q4 Full-year Full-year SEKm 2014 2014 % 2013 % 2014 2013 % Net interest income -4 0 -16 -75 0 -14 Net commission income 22 19 16 34 -35 76 97 -22 Net gains and losses on financial items at fair value 0 0 0 0 0 Other income -82 -69 -19 -94 13 -299 -337 11 Total income -64 -50 -28 -76 -16 -223 -254 12 Staff costs 0 0 -13 0 -13 Variable staff costs 0 0 0 0 0 Other expenses -69 -50 -38 -63 10 -228 -241 5 Depreciation/amortisation 5 0 0 5 0 Total expenses -64 -50 -28 -76 -16 -223 -254 12 Group eliminations mainly consist of eliminations of internal transactions between Group Functions and the other business segments.
- 20. Swedbank –Year-end report 2014 Page 20 of 62 Product areas Swedbank is a market leader in many product areas, including asset management, cards, payments, and mortgage lending. Responsibility for the product units rests with Group Products (Group Functions & Other), but the results are reported in several legal units and in the three business segments. Lending/deposits Swedbank’s lending operations are concentrated in Sweden, Estonia, Latvia, Lithuania and Norway. Lending products account for 66 per cent of the assets on Swedbank’s balance sheet. Swedbank’s total lending to private customers and corporations amounted to SEK 1 325bn as of 31 December (1 215 as of 31 December 2013). Household lending represented the largest part, with mortgages to private customers and tenant owner associations in Sweden accounting for 55 per cent. Swedbank is also a major player in corporate lending in Sweden, with lending of SEK 381bn. Swedbank has a strong position in the property management sector, with lending of SEK 170bn, as well as in the forestry and agricultural sector, with lending of SEK 69bn. In the Baltic countries Swedbank is the largest lender, with market shares of 19-34 per cent. Estonia accounts for nearly half of the Baltic loan portfolio. Of Swedbank’s total lending, the Baltic countries account for 9 per cent. Lending in the Baltic countries amounted to SEK 126bn, about half of which is to households and half to companies. In the Baltic countries property management and manufacturing are the biggest corporate lending sectors. The Swedish mortgage market continued to grow in 2014. The annual growth rate was 6 per cent for the market as a whole as well as for Swedbank. In 2014 Swedbank strengthened its share of new sales to largely the same level as the total mortgage portfolio – 25 per cent as of 31 December. Higher capital requirements for mortgages, coupled with a growing demand for transparency from customers and authorities, are creating new opportunities for Swedish mortgage lenders. To make it easier for customers to see how they can influence their mortgage costs, Swedbank will more clearly explain the factors that determine how a loan is priced. Sweden’s banks promote a sound lending culture through the Swedish Bankers’ Association, which at mid-year 2014 tightened its amortisation recommendation for mortgages, requiring borrowers to amortise down to a 70 per cent loan-to-value ratio (previously 75 per cent) within 10-15 years. As a result, Swedbank is seeing an increasing share of amortising customers, mainly among those with loan-to-value ratios over 70 per cent. In November 2014 the SFSA announced that it will introduce amortisation requirements on mortgages so that new borrowers amortise more. New mortgages will have to be repaid down to a 50 per cent loan-to-value ratio in two stages: first an annual amortisation rate of 2 per cent of the property’s value (definition not yet finalised) down to a 70 per cent loan-to-value ratio and then a rate of 1 per cent down to a loan-to-value ratio of 50 per cent. The new requirements are scheduled to be introduced in 2015. Swedbank already factors these amortisation levels into its credit assessment and does not anticipate that the new requirements will affect whether customers qualify for a loan. It could, on the other hand, affect household consumption and savings. The annual growth rate in the Swedish corporate market was 3.4 per cent as of 31 December. Corporate lending surpassed market growth. Excluding the acquisition of Sparbanken Öresund, corporate lending grew by SEK 32bn, corresponding to a growth rate of 9 per cent. The biggest growth was in property management lending (SEK 26bn), where activity was high in 2014 and Swedbank already had a strong position. Swedbank’s total market share was 19 per cent. The consumer finance market is affected by new technology, regulation and changing customer behaviour. Niche players have been more skilled than the major banks in making their loans easier to buy. Swedbank was among the five largest consumer lenders in the Swedish market, with a market share of about 10 per cent, corresponding to a volume of SEK 25bn. Given the bank’s large share of private customers, this share should be higher, and at the end of the year work to improve the position intensified, including through collaborations with the largest loan brokers in the area. Swedbank is also a major player in deposits in its home markets. Total deposit volumes amounted to SEK 661bn (599), of which SEK 372bn (341) was to private customers and SEK 289bn (258) to corporate customers. Just over 75 per cent of Swedbank’s total deposit volumes are in Sweden. For more information on Swedbank’s lending and deposits, see each business segment. Payment operations Swedbank is a leader in payment and cash management products in its four home markets. Growth in the payment area is a function of economic growth and customers’ increasing use of payment means other than cash. For example, Swish, a mobile payment service shared with other Swedish banks, is growing steadily and is now used by 2 million retail customers. Since its launch in June, a corporate version of Swish has attracted more than 10 000 small businesses, associations and charitable organisations among participating banks. The payment area is strongly affected by external factors. Rapid technological developments pose a challenge in the form of increased competition, especially from e-commerce companies. Swedbank is well equipped in this regard in terms of infrastructure, economies of scale and its long track record of strong consumer protection, an important factor as e- commerce grows. Over time regulatory changes will open up the value chain in parts of the bank’s payment business. The increased competition will be addressed mainly with cost efficiencies. A growing share of customers is managing their payments online. Today over 3.1 million of the bank’s customers in Sweden and 2.3 million in the Baltic countries have access to payment services through the Internet Bank and the Mobile Bank. In 2014 mobile
- 21. Swedbank –Year-end report 2014 Page 21 of 62 payments increased by 94 per cent in Sweden and 74 per cent in the Baltic countries. Users of Mobile BankID, which facilitates online and mobile payments, are steadily increasing in number and now exceed 1 400 000 (700 000). Last autumn Swedbank joined other Latvian banks to launch E-invoice, an online invoicing service and an alternative to Direct Debit (autogiro) that is now established in three of our four home markets and will be introduced in Lithuania as well. E-invoicing simplifies things for customers and strengthens the bank’s digital offering at the same time that a harmonised offering creates efficiencies for the bank. Payments Full-year Full-year Net commission income, SEKm 2014 2013 % Net commission income 979 977 0 of w hich Nordic countries 425 475 -10 of w hich Baltic countries 554 502 10 Net commission income from payments was flat year- on-year. Excluding one-off income of SEK 35m in Lithuania during the second quarter 2014, net commission income decreased. Net commission income in the Nordic region decreased year-on-year, primarily due to the outsourcing of ATMs in the second quarter 2013 to Bankomat AB, which is jointly owned by the five largest Swedish banks. Income from national payments and letters of credit increased, while income from international payments decreased due to margin pressure. Volume growth was about 8 per cent. In the Baltic countries income increased in all product groups in Estonia and Lithuania but decreased in Latvia. The reason for the Latvian decrease was lower income from international payments after the euro’s adoption in 2014. Payments Full-year Full-year Key figures 2014 2013 % International payments (million) 10.7 10.0 6 of w hich Sw eden 4.8 4.4 8 of w hich Baltic countries 5.9 5.6 5 Domestic payments (million) 1) 855.5 841.6 2 of w hich Sw eden 640.0 621.3 3 of w hich Baltic countries 215.5 220.3 -2 E-services payments (million) 2) 361.0 187.0 93 of w hich Sw eden 322.2 162.9 98 of w hich Baltic countries 38.8 24.1 61 Factoring portfolio, SEKm 4 117 4 034 2 of w hich Sw eden 2 274 2 267 0 of w hich Baltic countries 1 843 1 767 4 1) Domestic payments include salary and mass payments, giro payments, direct debit payments, internet payments. 2) E-payments include e-invoices, bank link payments, mobile phone top- up transactions, number of signed transactions and ID transactions through E-ID/BankID. Card business Swedbank issues cards to the public and acquires card payments from merchants via card terminals and online payments in all its home markets as well as in Norway, Denmark and Finland. Swedbank is Europe’s fifth largest card payment acquirer based on number of transactions. Market shares in the bank’s home markets range from 50 to 70 per cent. Swedbank is also the 11th largest card issuer in Europe based on number of transactions. Customers are increasingly making store purchases by card rather than by cash. In Sweden 80 per cent of store purchases are by card, the highest percentage in the EU. In Estonia the corresponding figure is 50 per cent and in Latvia and Lithuania it is lower but steadily growing. The Swedish and Estonian markets are expected to continue to do well, growing by about 9 per cent. In Latvia and Lithuania growth is estimated at 20 to 30 per cent annually. In 2014 the value of payments with Swedbank cards in Sweden grew by 7 per cent at the same time that ATM withdrawals decreased by 7 per cent. The trend is similar in Estonia. In Lithuania, where Swedbank is encouraging greater card use, card payments rose by 17 per cent at the same time that cash withdrawals declined. In Latvia, the increase was no less than 27 per cent. When card payments increase, competition does as well, leading to price pressure. To remain competitive requires simpler internal processes and more cost-effective solutions. The bank is working actively to continuously reduce costs per payment transaction. In card issuance the biggest growth opportunities in the bank’s home markets are in the area of corporate cards, where Swedbank has traditionally been weaker. The bank’s large number of small business customers represents good potential to grow this business. In 2014 the number of corporate debit cards increased by 12 per cent to a total of around 225 000. As digitisation increases, so does e-commerce in society, an important growth area for Swedbank. E- payments with Swedbank’s debit cards increased by 18 per cent in 2014, compared with an increase of 9 per cent for brick-and-mortar purchases. Mobile phones are also increasingly being used for e-commerce and card payments. Swedbank is working to offer cardholders better solutions for mobile card payments. In April Swedbank launched Babs Micro, a mobile card acceptance terminal that has attracted nearly 1 000 new small businesses and associations and allows card payments in places that were previously dependent on cash. The EU is preparing a payment regulation to create a common market and accelerate the transition from cash to electronic payments. This will strengthen consumers’ position through increased competition across borders. The regulation, which is scheduled to be phased in beginning 2015 and fully implemented in 2016, will require capital expenditures on the part of both traders and banks. The regulation also covers the interchange fee that the acquirer pays the issuer. In Sweden fees on credit cards are expected to decrease. In the Baltic countries they are expected to fall on both debit and credit cards, which could adversely affect the card issuance business and increase competition in payment acquisition. The bank’s pricing models and range of card products will be reassessed to compensate for the regulation’s effects. In Sweden, competition is increasing from other EU countries in payment acquisition, at the same time that it gives Swedbank an opportunity to expand its business to other countries. In 2014 Swedbank started a payment acquisition business for Swedish companies in Poland as part of a strategy to support home market customers operating abroad. This strategy also includes the bank’s increased activity in Finland and Norway.
- 22. Swedbank –Year-end report 2014 Page 22 of 62 Card related income Full-year Full-year SEKm 2014 2013 % Total income, SEKm 3 312 2 964 12 of w hich Nordic countries 1 796 1 692 6 of w hich Baltic countries 825 725 14 of w hich Entercard1) 691 548 26 1) Swedbank's share of the profit or loss of Entercard. Acquisition income in the Nordic region decreased during the year as a result of margin pressure and higher interchange fees as well as higher expenses for Visa and MasterCard. Card issuance income in Sweden rose by 12 per cent, in line with the increase in transaction volume. The increased income in the Baltic countries is due to the issuance of more debit and credit cards as a result of increased usage. During the second quarter 2014 Entercard recognised one-off income of SEK 230m when a distribution partner in Norway terminated its contract and redeemed its outstanding credit cards. As a result, Entercard’s credit volumes decreased by about 25 per cent. Credit card income otherwise rose due to increased card transactions in Sweden and the Baltic countries as well as higher annual fees. Full-year Full-year Key ratios, cards 2014 2013 % Acquired transactions, million 1 956 1 776 10 of w hich Nordic countries 1 659 1 505 10 of w hich Baltic countries 297 272 9 Acquired volumes, SEKbn 480 440 9 of w hich Nordic countries 437 401 9 of w hich Baltic countries 44 38 14 Issued cards, millon 7.7 7.7 -1 of w hich Nordic countries 3.9 3.8 2 of w hich Baltic countries 3.8 3.9 -3 Number of card purchases, million 1322 1200 10 of w hich Nordic countries 976 896 9 of w hich Baltic countries 346 303 14 Asset management business Asset management is conducted through the Swedbank Robur group in Swedbank’s four home markets as well as in Norway. Robur is the leader in Sweden, with a market share of 22.7 per cent measured by assets under management. Fund assets under management amounted to SEK 715bn (611) on 31 December, of which the Swedish operations accounted for SEK 686bn. Discretionary assets under management amounted to SEK 326bn (278). Regulatory changes are helping to increase transparency and competition in the fund and insurance market, which is leading to price pressure. A regulation prohibiting commissions in Sweden, which is expected to be introduced in 2017, is one example. The inflow to funds with lower management fees such as fixed income and index-linked funds as well as to mixed funds continued during the fourth quarter, while actively managed mutual funds reported outflows. In December Swedbank Robur received an annual PPM (defined-contribution pension) flow of SEK 5.5bn, corresponding to a market share of 16 per cent. Net inflow Swedish Total Of which Robur Total Of which Robur fund market, SEKbn 2014 2014 Q4 2014 Fixed income funds 67 17 1 1 Mixed funds 70 12 31 7 Equity funds 10 -9 6 -2 of which indexfunds 16 3 8 1 Other funds 6 0 3 0 Total net sales 153 21 40 6 Swedbank Robur’s share of the net inflow improved in 2014 to 13.5 per cent (8.8), which is still lower than the share of total fund assets under management. The inflow to discretionary asset management was SEK 31bn (9) during the period. Swedbank is also a distributor of other companies’ funds, and its share of total net sales in the Swedish fund market during the year was 21.9 per cent. Swedbank Robur’s Morningstar rating was lowered in 2014. Much of its focus has been on management processes, with the aim of improving the funds’ results. To create a clearer offering, the number of funds is being reduced as well. Asset management Full-year Full-year Key ratios, SEKbn 2014 2013 % Total income, SEKm 4 482 4 113 9 Assets under management 715 611 17 of w hich Sw eden 686 589 17 of w hich Baltic countries 25 20 27 of w hich Norw ay 3 2 38 Discretionary asset management 326 278 17 of w hich Sw eden 324 276 17 of w hich Baltic countries 2 2 0 Income from asset management products increased by 9 per cent during the year compared with 2013. The improvement is mainly due to a bullish market, which increased average assets under management by 15 per cent, but also to net inflows. At the same time capital is moving to products with lower margins. Prices were cut on a number of fixed income, index-linked and pension funds during the fourth quarter to adjust to prevailing low interest rates (mainly fixed income funds) and to be more competitive. The cuts had little impact on the result for the quarter, but will have an effect in 2015. Insurance business Swedbank has life insurance operations in all its home markets. In the Swedish market it is the seventh largest company, with a market share of about 7 per cent of premium payments. In Estonia and Lithuania Swedbank is the largest life insurance company, with market shares of 36 and 21 per cent, respectively. Its market share in Latvia is 18 per cent. Non-life insurance is offered in the Baltic countries as well, with solutions primarily for private customers. Here the market share is 14 per cent in Estonia and 3 per cent in Latvia. In Lithuania, where the non-life business was launched in 2011, the market share is 1 per cent. Non-life insurance is offered in Sweden via a third-party solution through the insurance company Tre Kronor. Insurance products are sold through the distribution channels of Swedbank and the savings banks.
- 23. Swedbank –Year-end report 2014 Page 23 of 62 Premium payments Full-year Full-year SEKm 2014 2013 % Sw eden 14 733 13 441 10 of w hich collective occupational pensions 3 663 3 212 14 of w hich endow ment insurance 7 478 6 917 8 of w hich occupational pensions 2 209 2 004 10 of w hich risk insurance 741 665 11 of w hich other 643 643 0 Baltic countries 1 271 1 061 20 of w hich life insurance 798 666 20 of w hich non-life insurance 473 395 19 Sweden In 2014 premium payments in the Swedish life insurance business increased by 10 per cent. Demand for pension and insurance products will be high for the foreseeable future, with the potential to increase sales to existing customers as well. Only 24 per cent of Swedbank’s and the savings banks’ corporate customers with annual sales of over SEK 1m have an occupational pension solution from the bank. Premium payments from occupational pensions, including collective occupational pensions, rose by 13 per cent during the year. This is partly because the portfolio has grown and partly due to transfers from other insurers, which have risen by 54 per cent to SEK 1 272m, of which SEK 667m was transferred from collective occupational pensions. Swedbank is positive to the current debate on free transfers of pension savings. Free transfer rights, combined with a simplified process, would increase the potential for further growth among existing customers. For customers it means being able to consolidate savings in one place at the same time that it could result in lower fees by reducing the number of policies. Swedbank’s share of the total transfer market rose in 2014 to about 7 per cent (4). While parts of the insurance market (mainly customised occupational pension solutions) are associated with high margins, a large percentage of new savings is in low- margin products. Through efficiencies and automation, Swedbank is simplifying its service offering at the same time that the cost savings will improve its opportunities to stay competitive. Current fees being charged in parts of the occupational pension market are not considered sustainable in the prevailing low interest rate environment. The collectively negotiated ITP plan’s 1.5 million private sector employees are one of the fastest growing areas of the occupational pension market. Since July 2013, when Swedbank became a provider of choice, around 13 000 new agreements have been signed and SEK 532m has been transferred from other insurers. During the fourth quarter a decision was made to reduce tax deductions of private pension savings as of 2015. To help our customers avoid double taxation, information has been widely distributed on switching to an investment savings account or endowment insurance, for example. Customers have also been informed through the Mobile Bank, where functions have added that allow customers to open an investment savings account and exchange funds. Swedbank does not expect lower tax deductions to significantly affect the total inflow of private savings. The need for long-term savings has not changed, and by offering other products the bank can maintain and even increase personal savings. Baltic countries The number of new savings products sold in the Baltic countries rose by 12 per cent year-on-year. The corresponding increase for risk products was 61 per cent. More new products meant higher premium income, which rose by 14 per cent in local currency. To meet increased demand for life insurance products and digital self-service options, Swedbank was one of the first life insurers in the Baltic countries to introduce internet-based solutions for electronic identification. This makes it easier for customers, who can now obtain and revise insurance policies and file claims online. The positive trend for non-life premium income continued in the Baltic countries, and total premium income rose by 14 per cent in local currency. Every product saw increases, but especially home insurance, where advertising campaigns and active sales by bank branches led to higher volumes. Assets under management Assets under management 31 Dec 31 Dec SEKbn 2014 2013 % Sw eden 136.1 118.2 15 of w hich collective occupational pensions 58.1 47.6 22 of w hich endow ment insurance 53.7 49.6 8 of w hich occupational pensions 15.1 12.4 22 of w hich other 9.2 8.6 7 Baltic countries 4.0 3.1 29 Assets under management in the Swedish insurance operations rose by 15 per cent during the year to SEK 136.1bn, of which SEK 118.7bn relates to unit linked and deposit insurance. The increase was mainly due to stock market gains and a positive net inflow. Assets under management by the Baltic life insurance company rose by 10 per cent in local currency, mainly due to increased unit linked insurance. Income Insurance related income Full-year Full-year SEKm 2014 2013 % Sw eden 1 488 1 491 0 of w hich life insurance 1 435 1 418 1 of w hich non-life insurance 52 73 -29 Baltic countries 385 390 -1 of w hich life insurance 168 197 -14 of w hich non-life insurance 216 194 12 Total insurance related income 1 873 1 882 0 Swedbank’s total insurance related income amounted to SEK 1 873m (1 882). Income from the Swedish life business rose by 1 per cent, with higher assets under management resulting in increased income from savings products. The result for risk products and the return on equity decreased because the positive effect of reserve reversals was lower than in 2013 following revised assumptions about future claims. The return on equity fell due to lower interest rates. The decrease in Swedish non-life insurance was partly due to lower new sales in 2014 and partly to positive one-off effects in 2013. Income for the Baltic life business amounted to SEK 168m, a decrease of 18 per cent in local currency year- on-year. The decrease is mainly because low interest
- 24. Swedbank –Year-end report 2014 Page 24 of 62 rates have led to higher provisions to cover guaranteed returns in traditional asset management. The result from the company’s core business, savings and risk, continued to rise. Income from the Baltic non-life business increased mainly due to an improved risk result thanks to a mild and relatively snow-free winter. The claims ratio for 2014 was 54 per cent (55).
- 25. Swedbank –Year-end report 2014 Page 25 of 62 Financial information - contents Group Page Income statement, condensed 26 Statement of comprehensive income, condensed 27 Key ratios 28 Balance sheet, condensed 29 Statement of changes in equity, condensed 30 Cash flow statement, condensed 31 Notes Note 1 Accounting policies 31 Note 2 Critical accounting estimates 32 Note 3 Changes in the Group structure 33 Note 4 Operating segments (business areas) 34 Note 5 Net interest income 36 Note 6 Net commission income 37 Note 7 Net gains and losses on financial items at fair value 38 Note 8 Other expenses 39 Note 9 Credit impairments 39 Note 10 Loans 40 Note 11 Impaired loans etc. 41 Note 12 Assets taken over for protection of claims and cancelled leases 41 Note 13 Credit exposures 41 Note 14 Intangible assets 42 Note 15 Amounts owed to credit institutions 43 Note 16 Deposits and borrowings from the public 43 Note 17 Debt securities in issue 43 Note 18 Derivatives 44 Note 19 Financial instruments carried at fair value 44 Note 20 Pledged collateral 47 Note 21 Offsetting financial assets and liabilities 47 Note 22 Capital adequacy consolidated situation 48 Note 23 Risks and uncertainties 51 Note 24 Business combinations 52 Note 25 Discontinued operations 53 Note 26 Related-party transactions 54 Note 27 Swedbank’s share 54 Note 28 Effects of changes in accounting policies 55 Parent company Income statement, condensed 56 Statement of comprehensive income, condensed 56 Balance sheet, condensed 57 Statement of changes in equity, condensed 58 Cash flow statement, condensed 58 Capital adequacy 59 More detailed information can be found in Swedbank’s fact book, www.swedbank.com/ir, under Financial information and publications.
- 26. Swedbank –Year-end report 2014 Page 26 of 62 Income statement, condensed Group Q4 Q3 Q4 Full-year Full-year SEKm 2014 2014 % 2013 % 2014 2013 % Interest income 9 709 10 343 -6 10 919 -11 41 052 43 968 -7 Interest expenses -3 900 -4 514 -14 -5 293 -26 -18 410 -21 939 -16 Net interest income (note 5) 5 809 5 829 0 5 626 3 22 642 22 029 3 Commission income 4 168 4 150 0 3 957 5 16 252 14 692 11 Commission expenses -1 286 -1 334 -4 -1 258 2 -5 048 -4 560 11 Net commission income (note 6) 2 882 2 816 2 2 699 7 11 204 10 132 11 Net gains and losses on financial items at fair value (note 7) 69 799 -91 461 -85 1 986 1 484 34 Insurance premiums 503 422 19 421 19 1 889 1 714 10 Insurance provisions -329 -299 10 -240 37 -1 308 -1 067 23 Net insurance 174 123 41 181 -4 581 647 -10 Share of profit or loss of associates 93 221 -58 209 -56 980 852 15 Other income 352 362 -3 476 -26 1 911 1 794 7 Total income 9 379 10 150 -8 9 652 -3 39 304 36 938 6 Staff costs 2 452 2 469 -1 2 574 -5 10 259 9 651 6 Other expenses (note 8) 1 661 1 508 10 1 689 -2 6 625 6 258 6 Depreciation/amortisation 180 187 -4 221 -19 718 739 -3 Total expenses 4 293 4 164 3 4 484 -4 17 602 16 648 6 Profit before impairments 5 086 5 986 -15 5 168 -2 21 702 20 290 7 Impairment of intangible assets (note 14) 0 0 12 1 182 -99 Impairment of tangible assets 33 19 74 311 -89 256 693 -63 Credit impairments (note 9) 254 235 8 -32 419 60 Operating profit 4 799 5 732 -16 4 877 -2 21 026 19 355 9 Tax expense 1 000 1 164 -14 1 212 -17 4 301 4 099 5 Profit for the period from continuing operations 3 799 4 568 -17 3 665 4 16 725 15 256 10 Profit for the period from discontinued operations, after tax -3 -2 50 -48 -94 -262 -2 340 -89 Profit for the period 3 796 4 566 -17 3 617 5 16 463 12 916 27 Profit for the period attributable to the shareholders of Swedbank AB 3 795 4 560 -17 3 612 5 16 447 12 901 27 of w hich profit for the period from continuing operations 3 798 4 562 -17 3 660 4 16 709 15 241 10 of w hich profit for the period from discontinued operations -3 -2 50 -48 -94 -262 -2 340 -89 Non-controlling interests 1 6 -83 5 -80 16 15 7 of w hich profit for the period from continuing operations 1 6 -83 5 -80 16 15 7 of w hich profit for the period from discontinued operations 0 0 0 0 0