Download to read offline
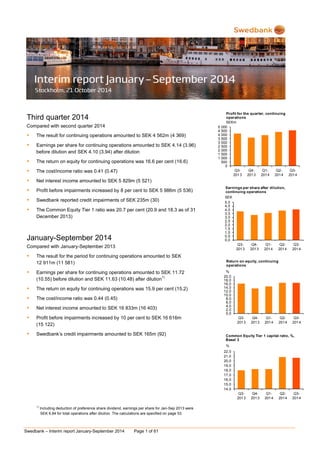


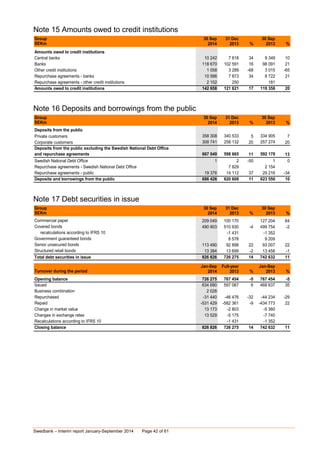


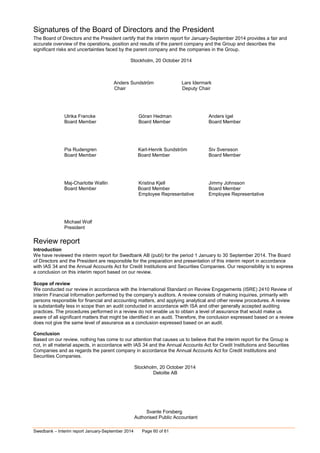


The document is Swedbank's interim report for January-September 2014. It summarizes that Swedbank reported a strong third quarter result, with profit for continuing operations of SEK 4.5 billion, up 4% from the third quarter of 2013. For the first nine months of 2014, profit for continuing operations was SEK 12.9 billion, an increase of 12% over the same period in 2013. However, economic growth remains uncertain globally and in Swedbank's key markets due to geopolitical risks and tensions between Russia and Ukraine. Swedbank aims to lower costs towards SEK 16 billion in 2016 through cost synergies, digitization, and staff reductions of 600-800 employees.


