Download to read offline


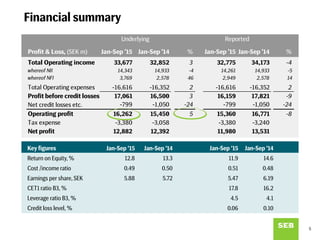


- SEB reported financial results for the first three quarters of 2015, with operating profit of SEK 16.3 billion, up 5% from the same period in 2014. - Net interest income declined 4% due to lower lending margins, while net fee and commission income rose 9% driven by higher asset management fees. - Asset quality remained strong with a low net credit loss level of 0.06% and non-performing loans declining to SEK 8.5 billion.


