Download to read offline
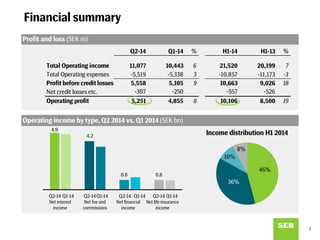
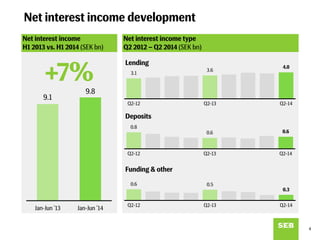
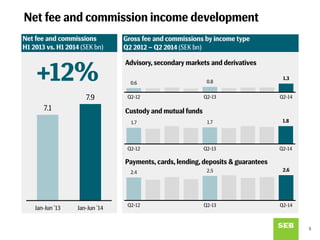
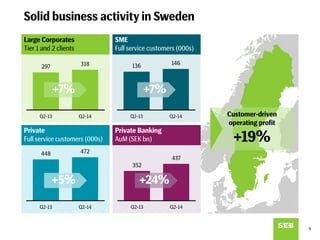
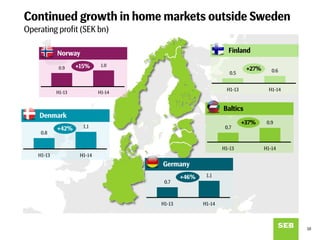
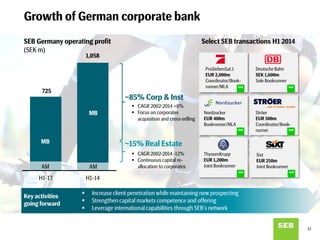
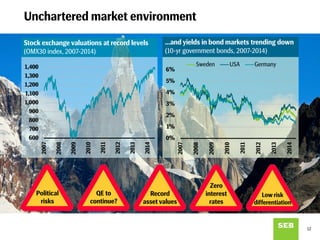
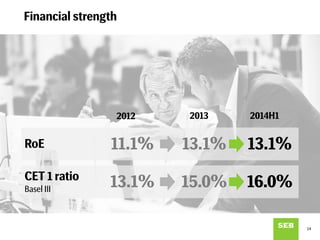
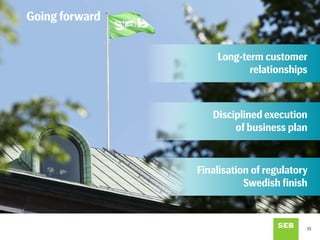

SEB reported strong financial results for the first half of 2014, with total operating income increasing 7% compared to the first half of 2013. Net interest income grew 7% driven by higher lending volumes, and net fee and commission income increased 12% from higher asset management fees. The bank continued its customer-driven growth across the Nordic region and Germany. Looking forward, SEB aims to deepen customer relationships, execute its business plan efficiently, and adapt to ongoing regulatory changes.


