Download to read offline

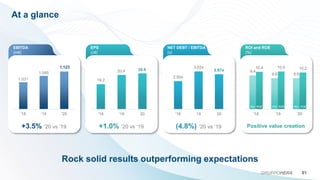


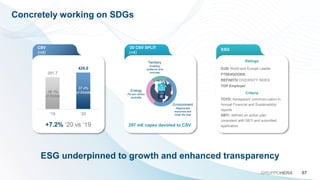
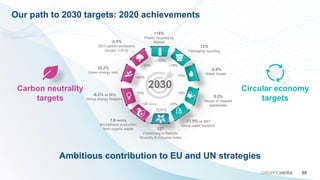
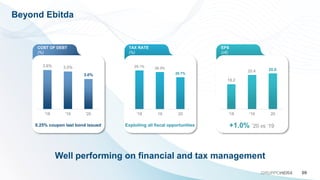
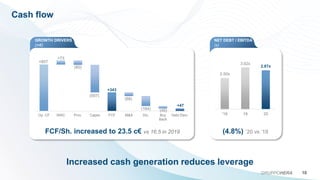

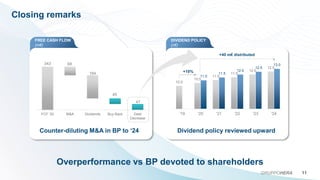

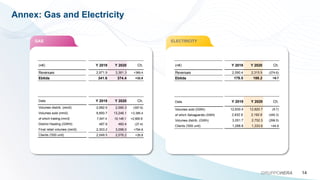
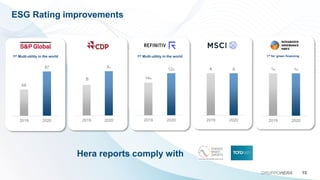

Hera Group reported strong financial results for 2020 that exceeded expectations. EBITDA increased 3.5% to €1,123 million despite negative impacts from COVID-19 of €31 million. Net profit was stable at €302.7 million. Cash flow generation was strong, allowing increased dividends of 10% and debt reduction. Organic growth drivers included over €500 million in green capex. Hera also improved its ESG ratings and remains committed to its 2030 sustainability targets.


