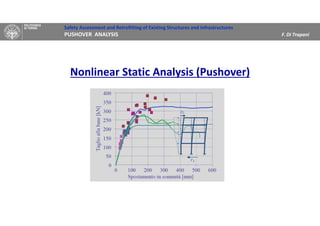
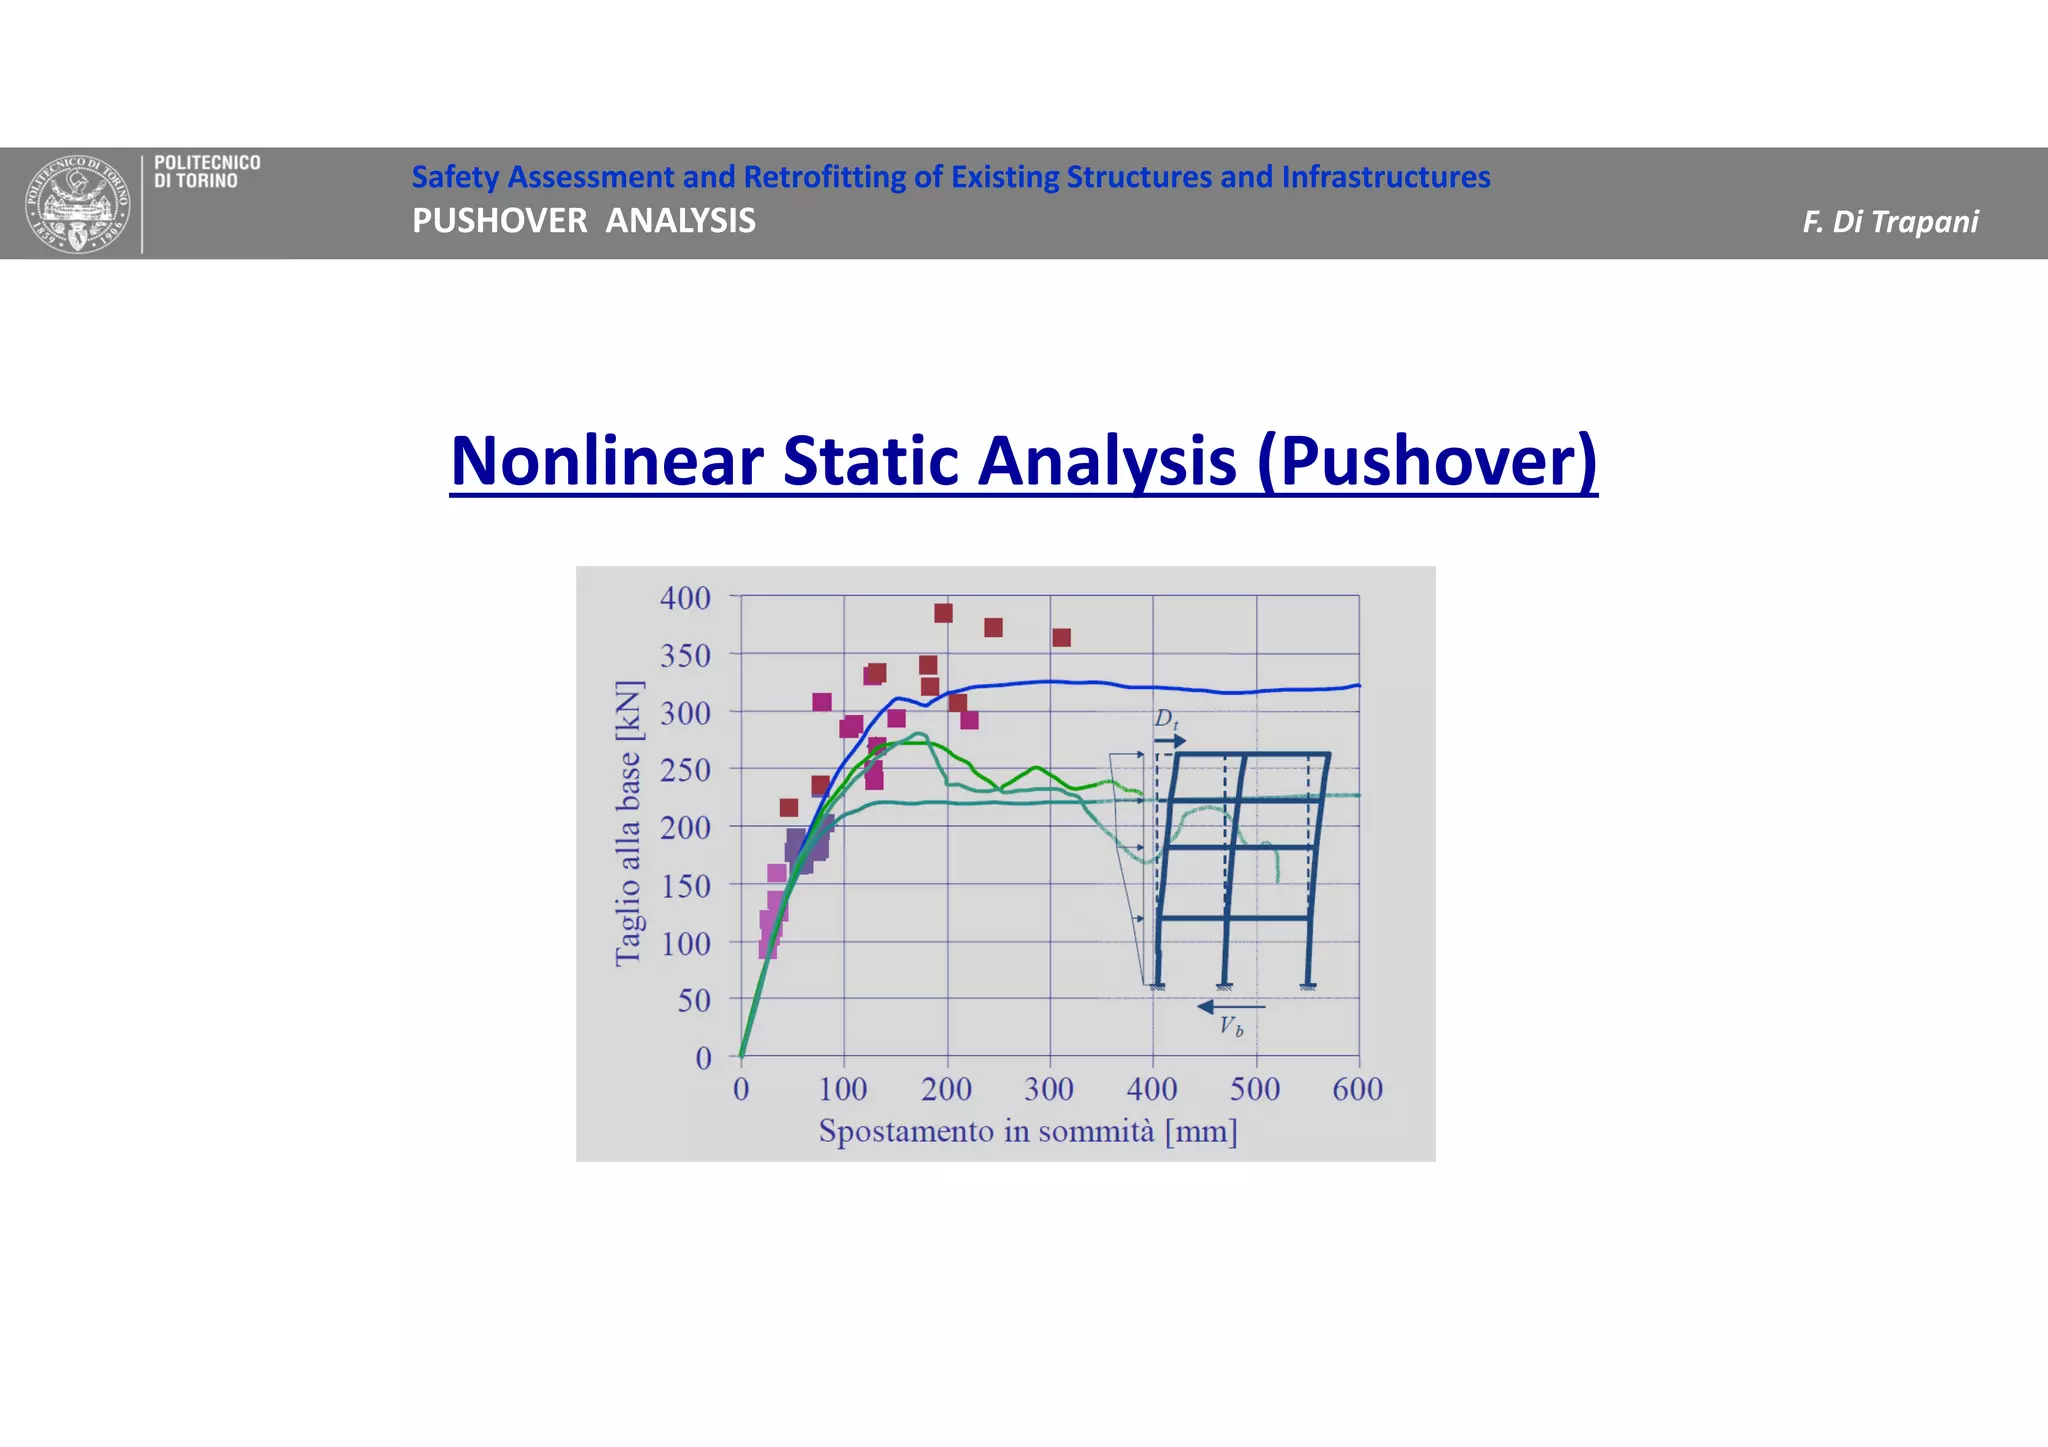
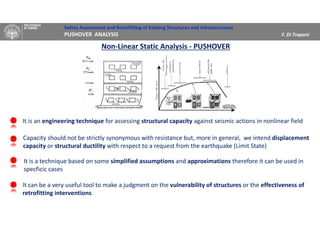
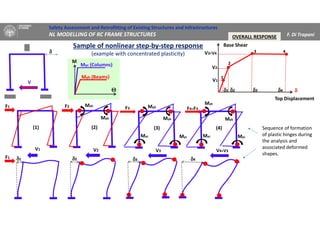
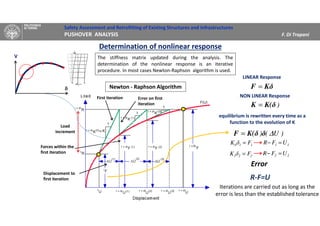
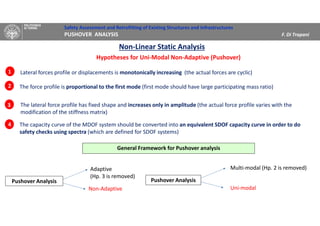
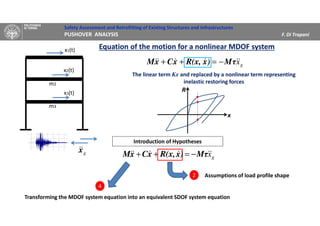
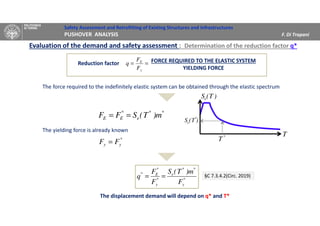
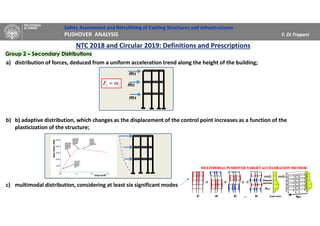
This document discusses nonlinear static (pushover) analysis for assessing structural capacity against seismic actions. It provides an overview of key aspects of pushover analysis including:
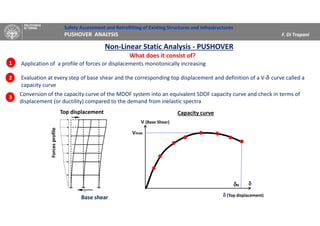
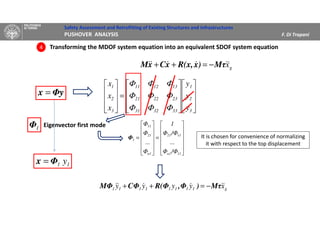
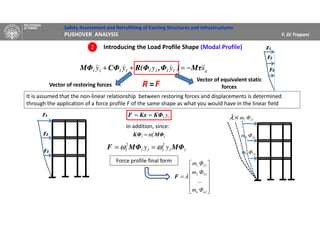
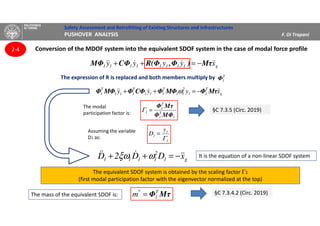
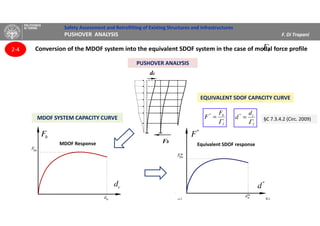
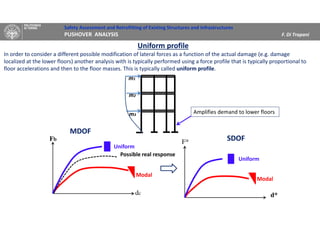
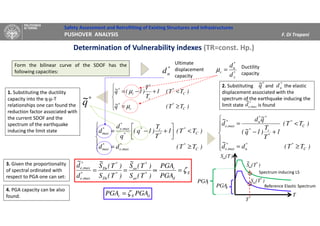
1. Converting the response of a multi-degree of freedom system into an equivalent single-degree of freedom system for comparison to demand spectra.
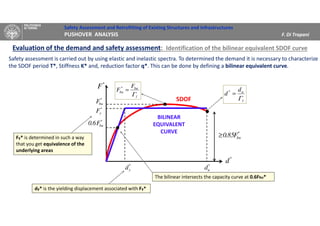
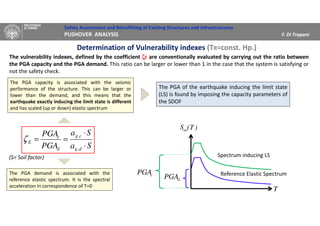
2. Defining the capacity curve from the pushover analysis and establishing a bilinearized equivalent curve for demand evaluation.
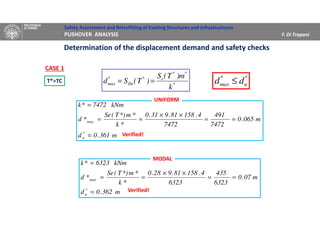
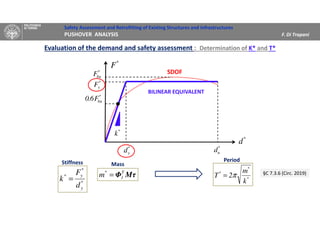
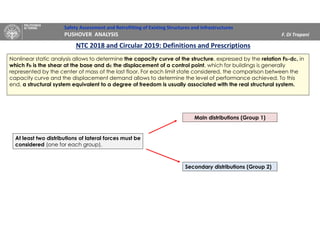
3. Evaluating demand based on the equivalent linear system period and comparing displacements and ductility demands to the system capacity to determine safety.


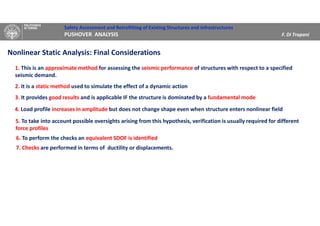
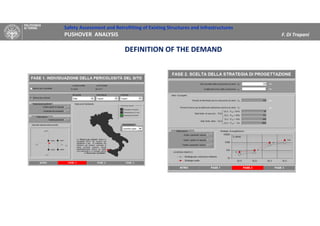
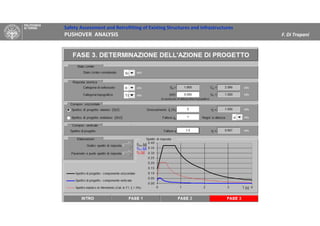
![Safety Assessment and Retrofitting of Existing Structures and Infrastructures
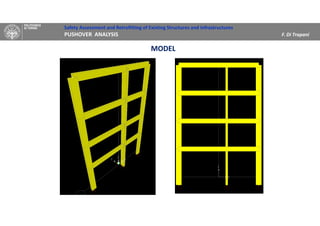
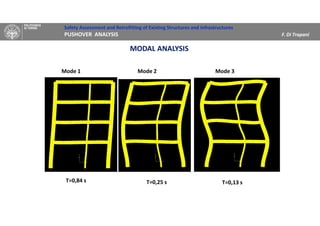
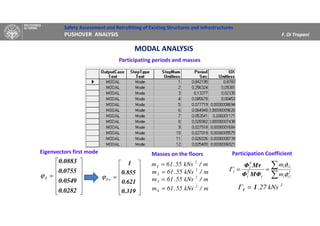
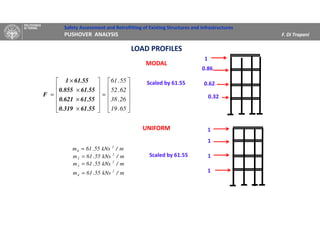
PUSHOVER ANALYSIS F. Di Trapani
0
50
100
150
200
250
300
350
400
450
500
0 0,1 0,2 0,3 0,4 0,5
MODALE
UNIFORME
Baseshear[kN]
Top Displacement [m]
UNIFORM
MODAL PROFILE
1° Yield strength 1° Yield strength CollapseCollapse
UNIFORM PROFILE
RESPONSES
Capacity Curves](https://image.slidesharecdn.com/7-200824114229/85/Nonlinear-Static-Analysis-Pushover-36-320.jpg)
![Safety Assessment and Retrofitting of Existing Structures and Infrastructures
PUSHOVER ANALYSIS F. Di Trapani
0
50
100
150
200
250
300
350
400
0 0,1 0,2 0,3 0,4
Serie1
FXTRI BIL
0
50
100
150
200
250
300
350
400
450
500
0 0,1 0,2 0,3 0,4 0,5
MODALE
UNIFORME
BaseShear[kN]
Top Displacement [m]
CONVERSION TO THE EQUIVALENT SDOF
0
50
100
150
200
250
300
350
400
0 0,1 0,2 0,3 0,4
Serie1
Serie2
Top Displacement [m]
BaseShear[kN]
MDOF SDOF
BaseShear[kN]
Top Displacement [m]
UNIFORM
2
kNs27.11 =Γ
BaseShear[kN]
Top Displacement [m]
MODAL
m/kN6323*k
s99.0*T
m046.0*d
kN290*F
m/kNs4.158*m
y
y
2
=
=
=
=
=](https://image.slidesharecdn.com/7-200824114229/85/Nonlinear-Static-Analysis-Pushover-37-320.jpg)
![Safety Assessment and Retrofitting of Existing Structures and Infrastructures
PUSHOVER ANALYSIS F. Di Trapani
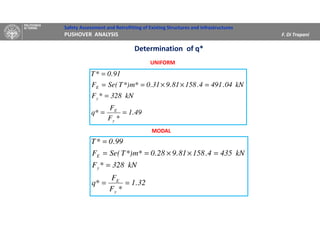
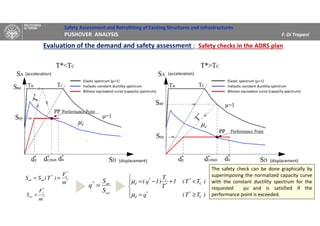
g31.0*)T(Se
91.0*T
=
=
g28.0*)T(Se
99.0*T
=
=
MODALUNIFORM
T [s]
Se(T)
[g]](https://image.slidesharecdn.com/7-200824114229/85/Nonlinear-Static-Analysis-Pushover-40-320.jpg)