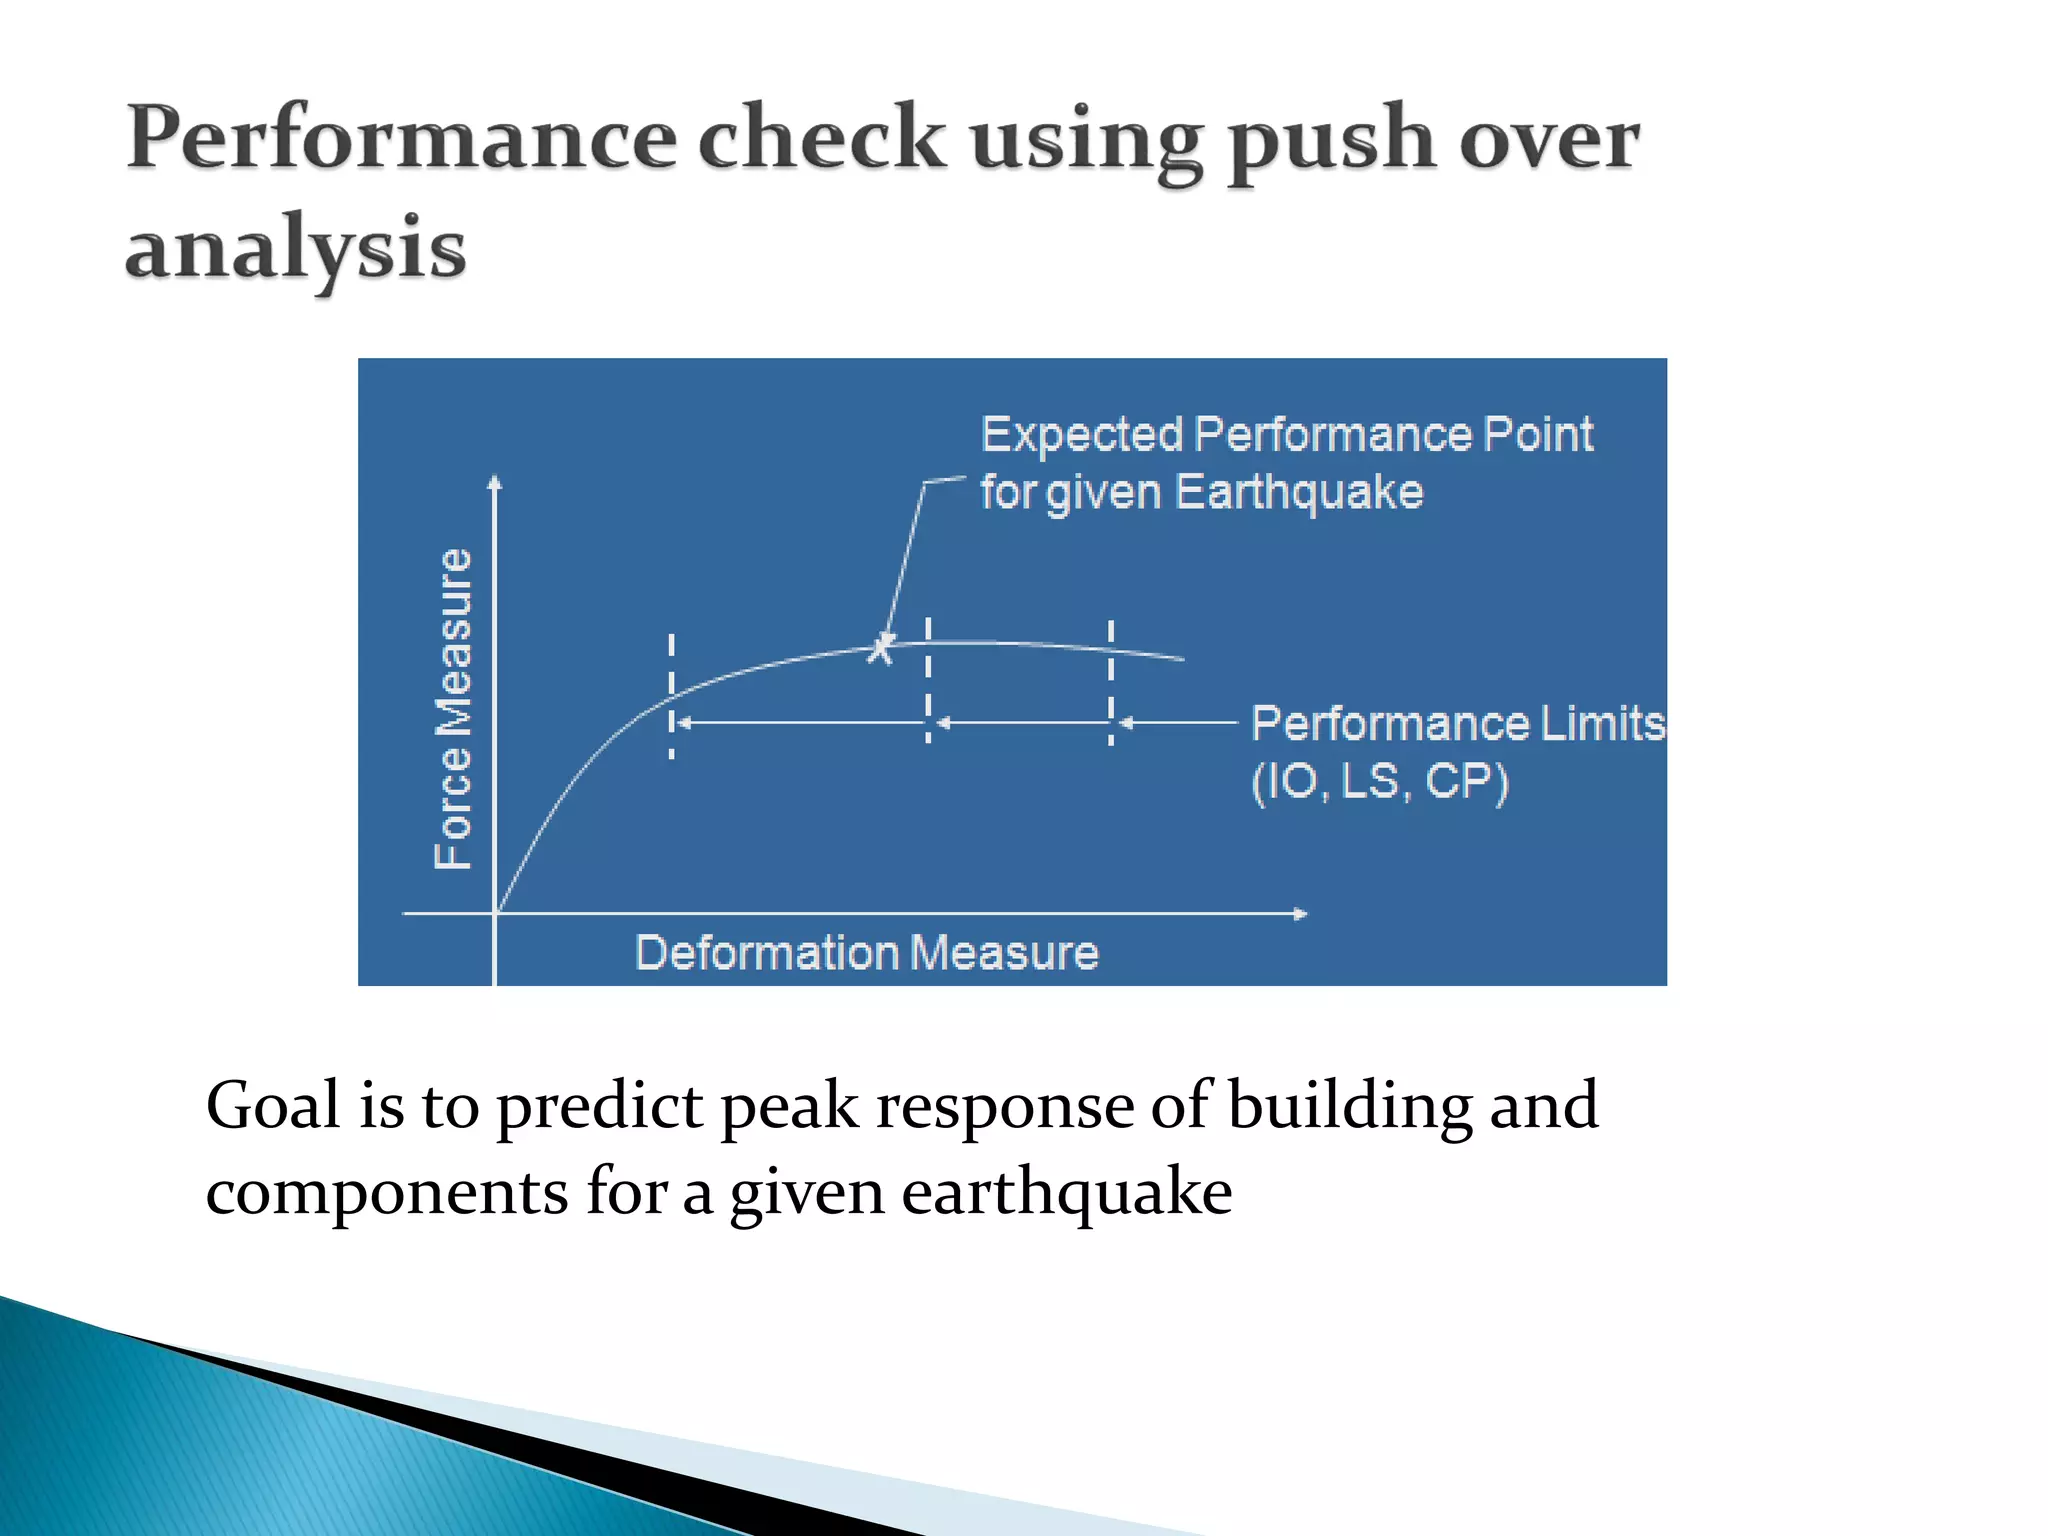
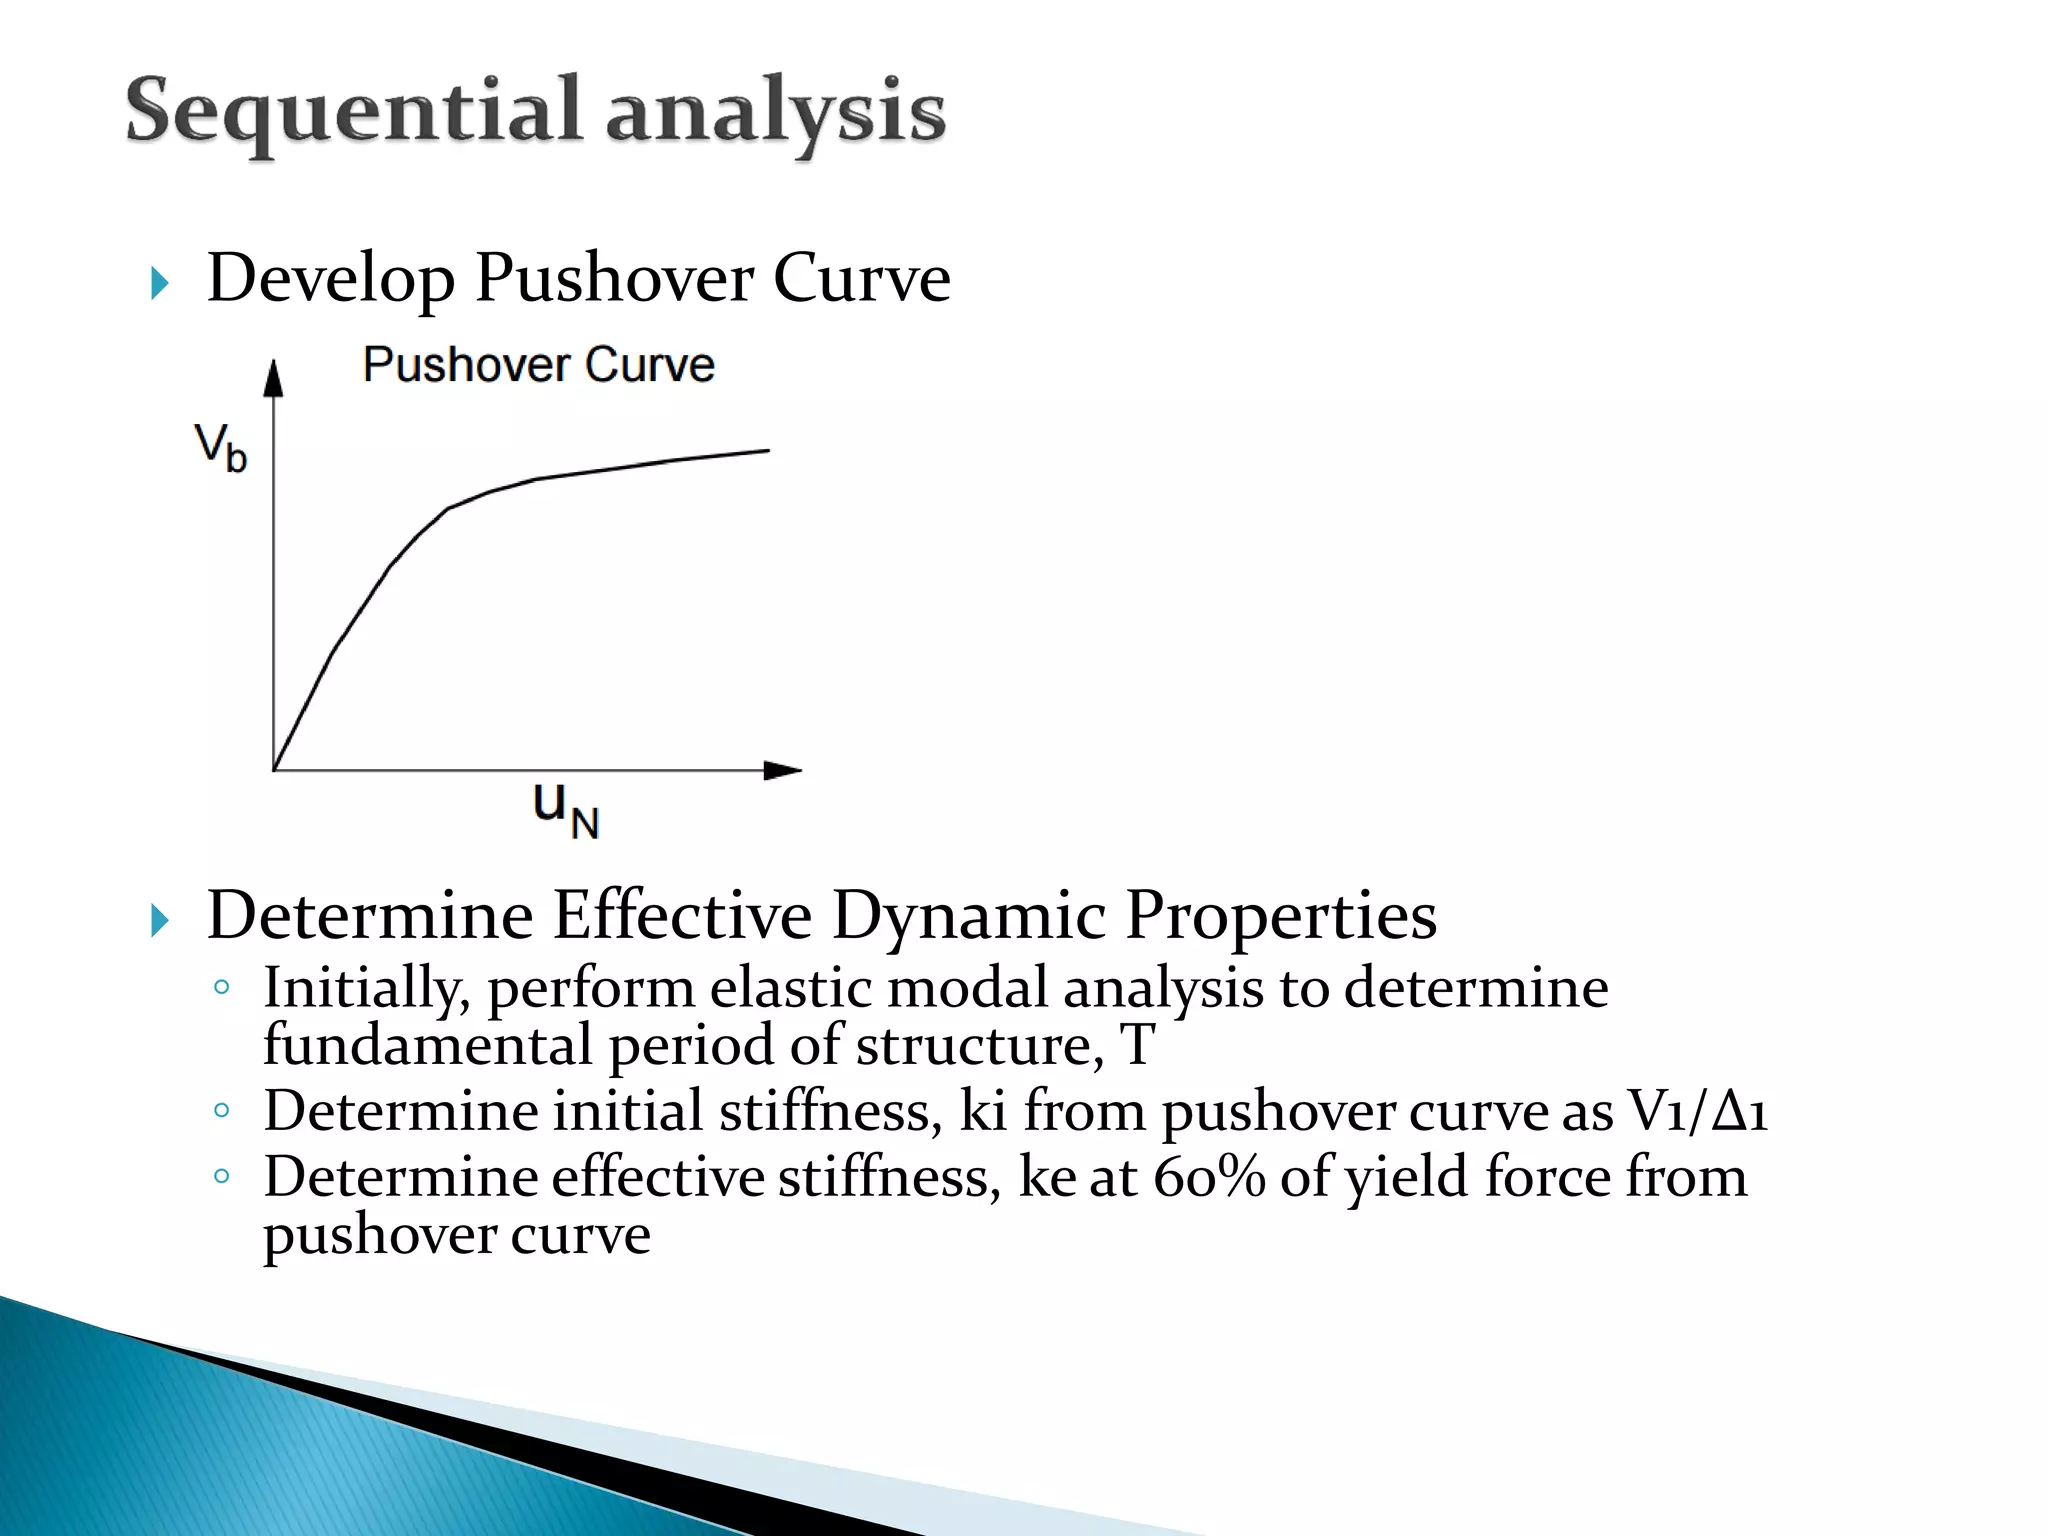
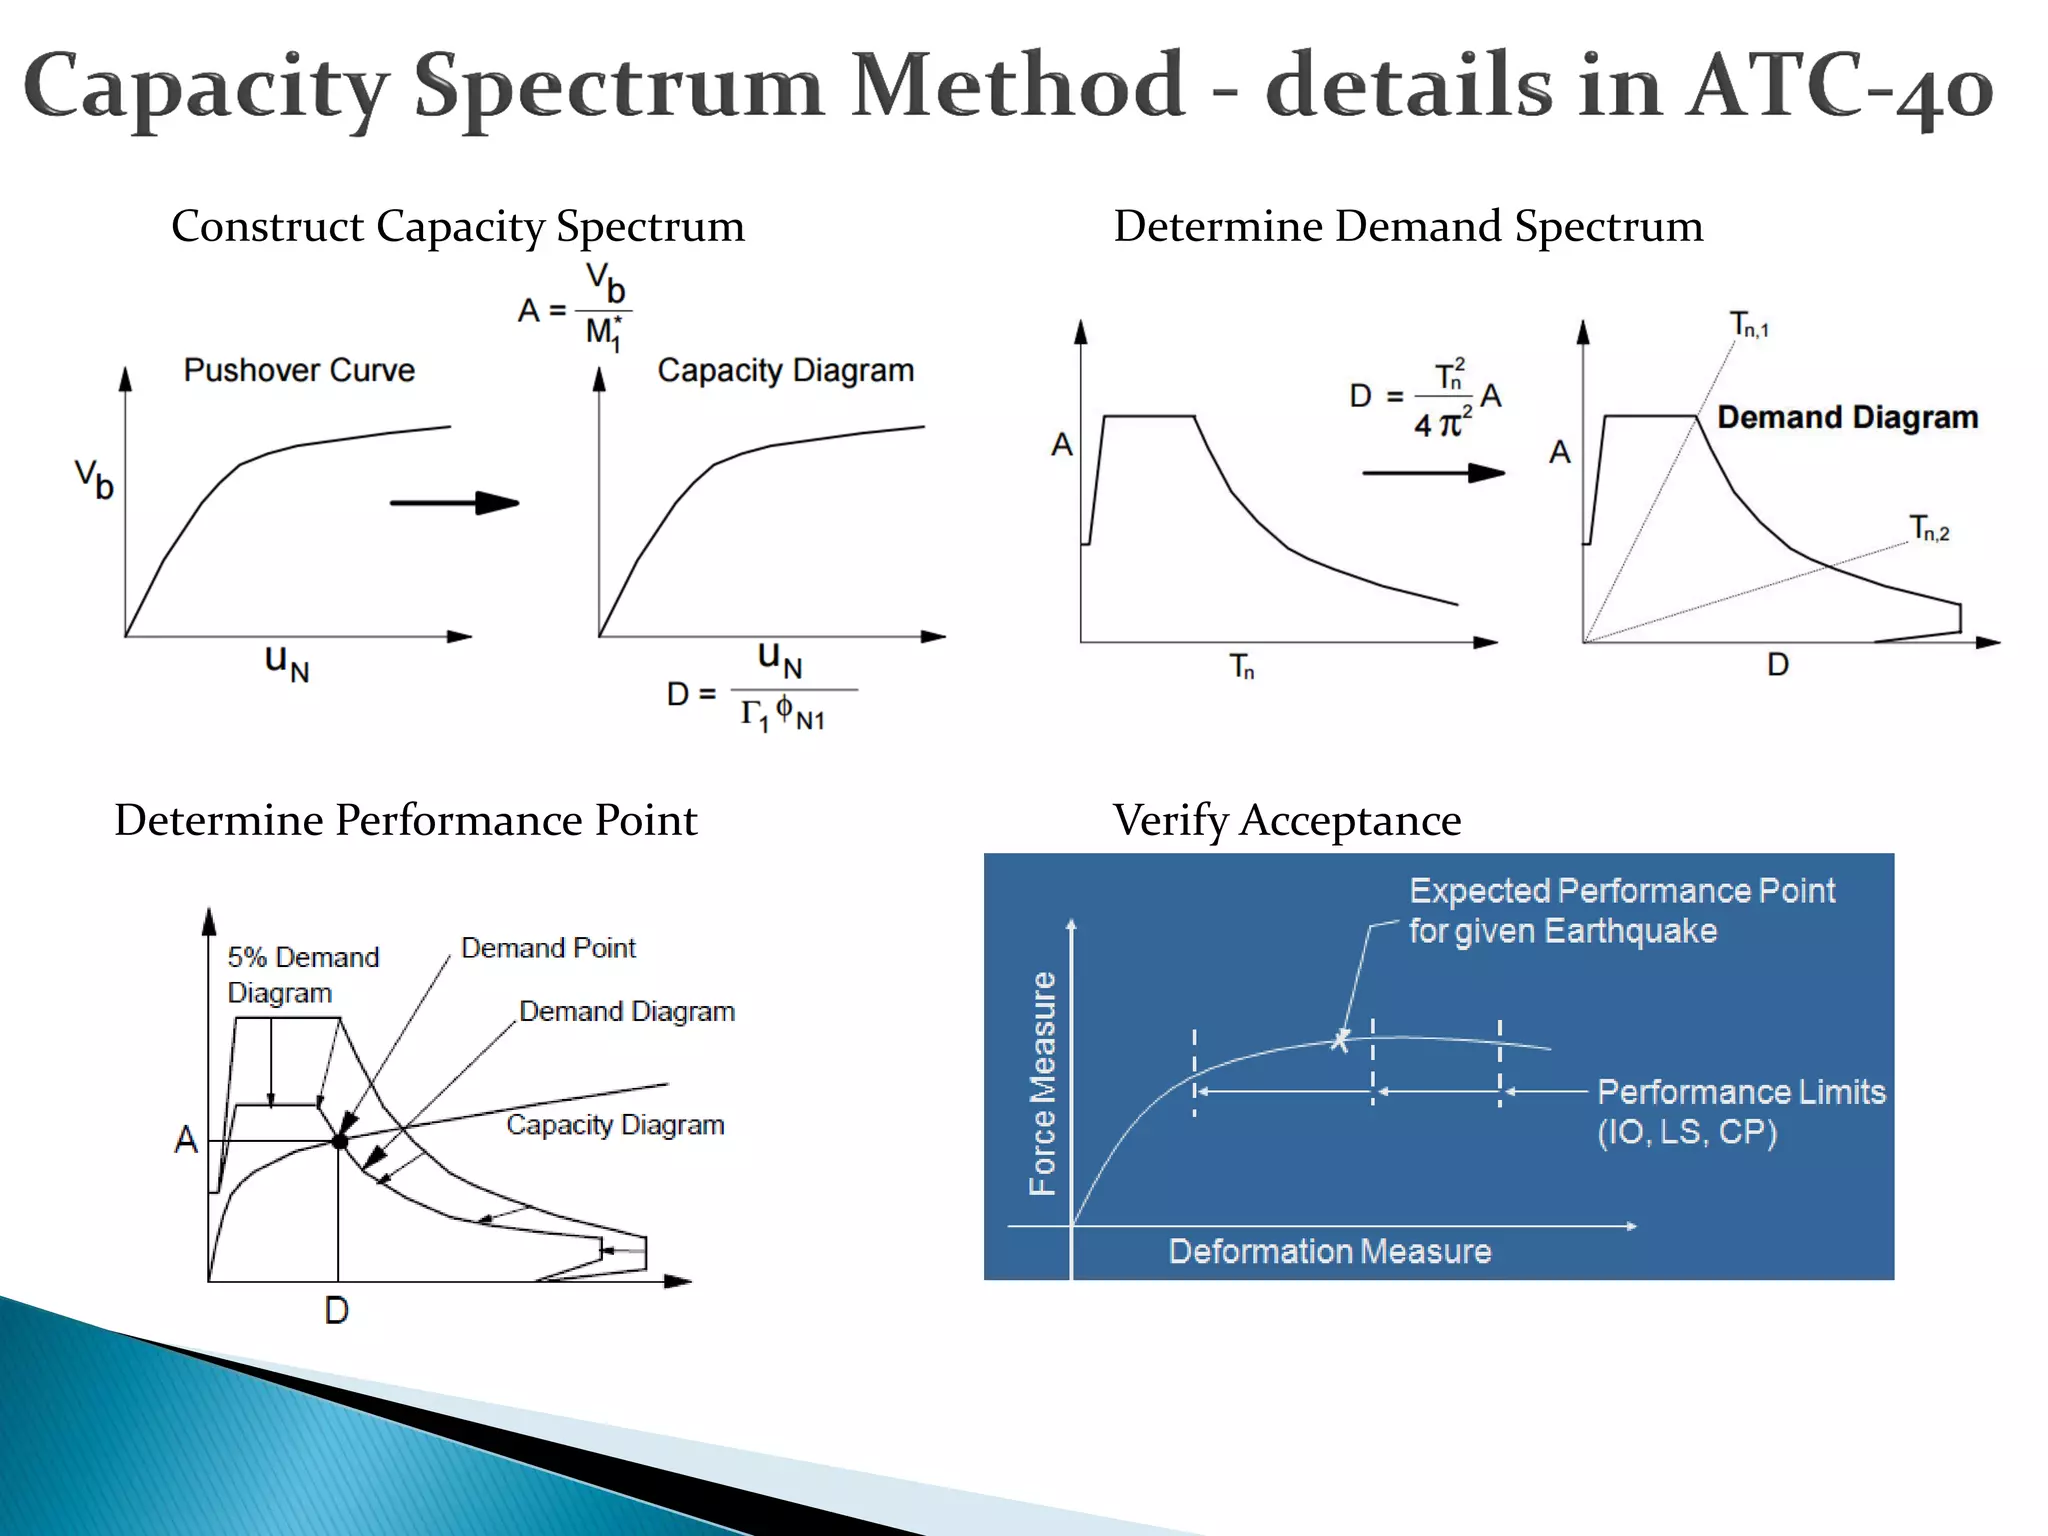
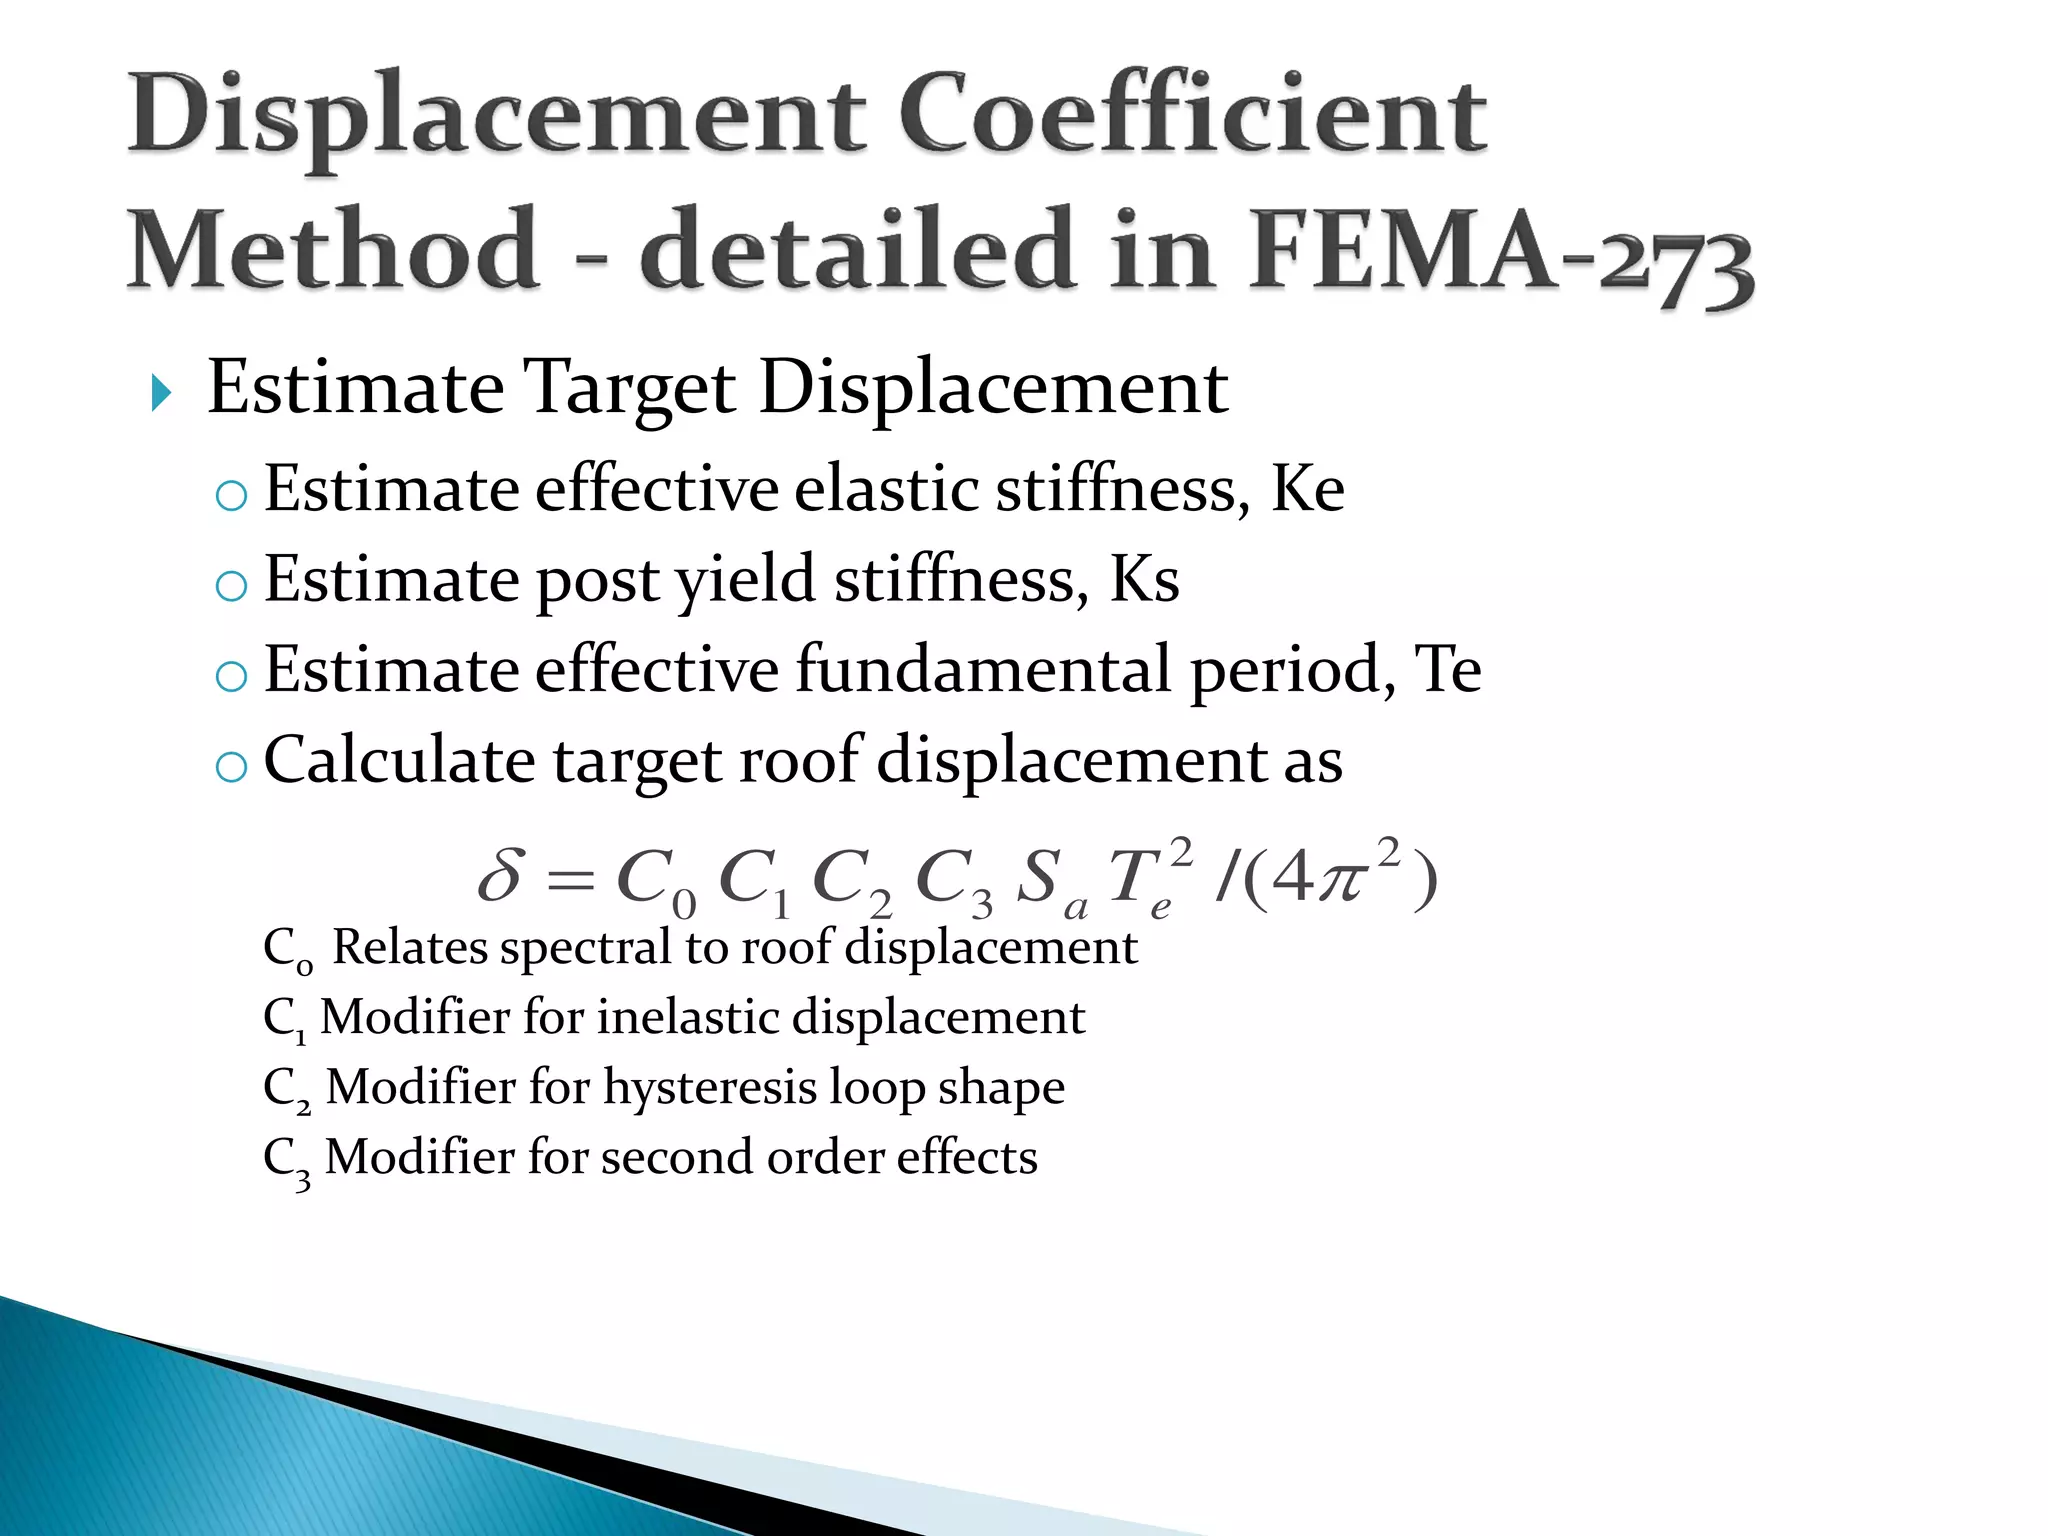
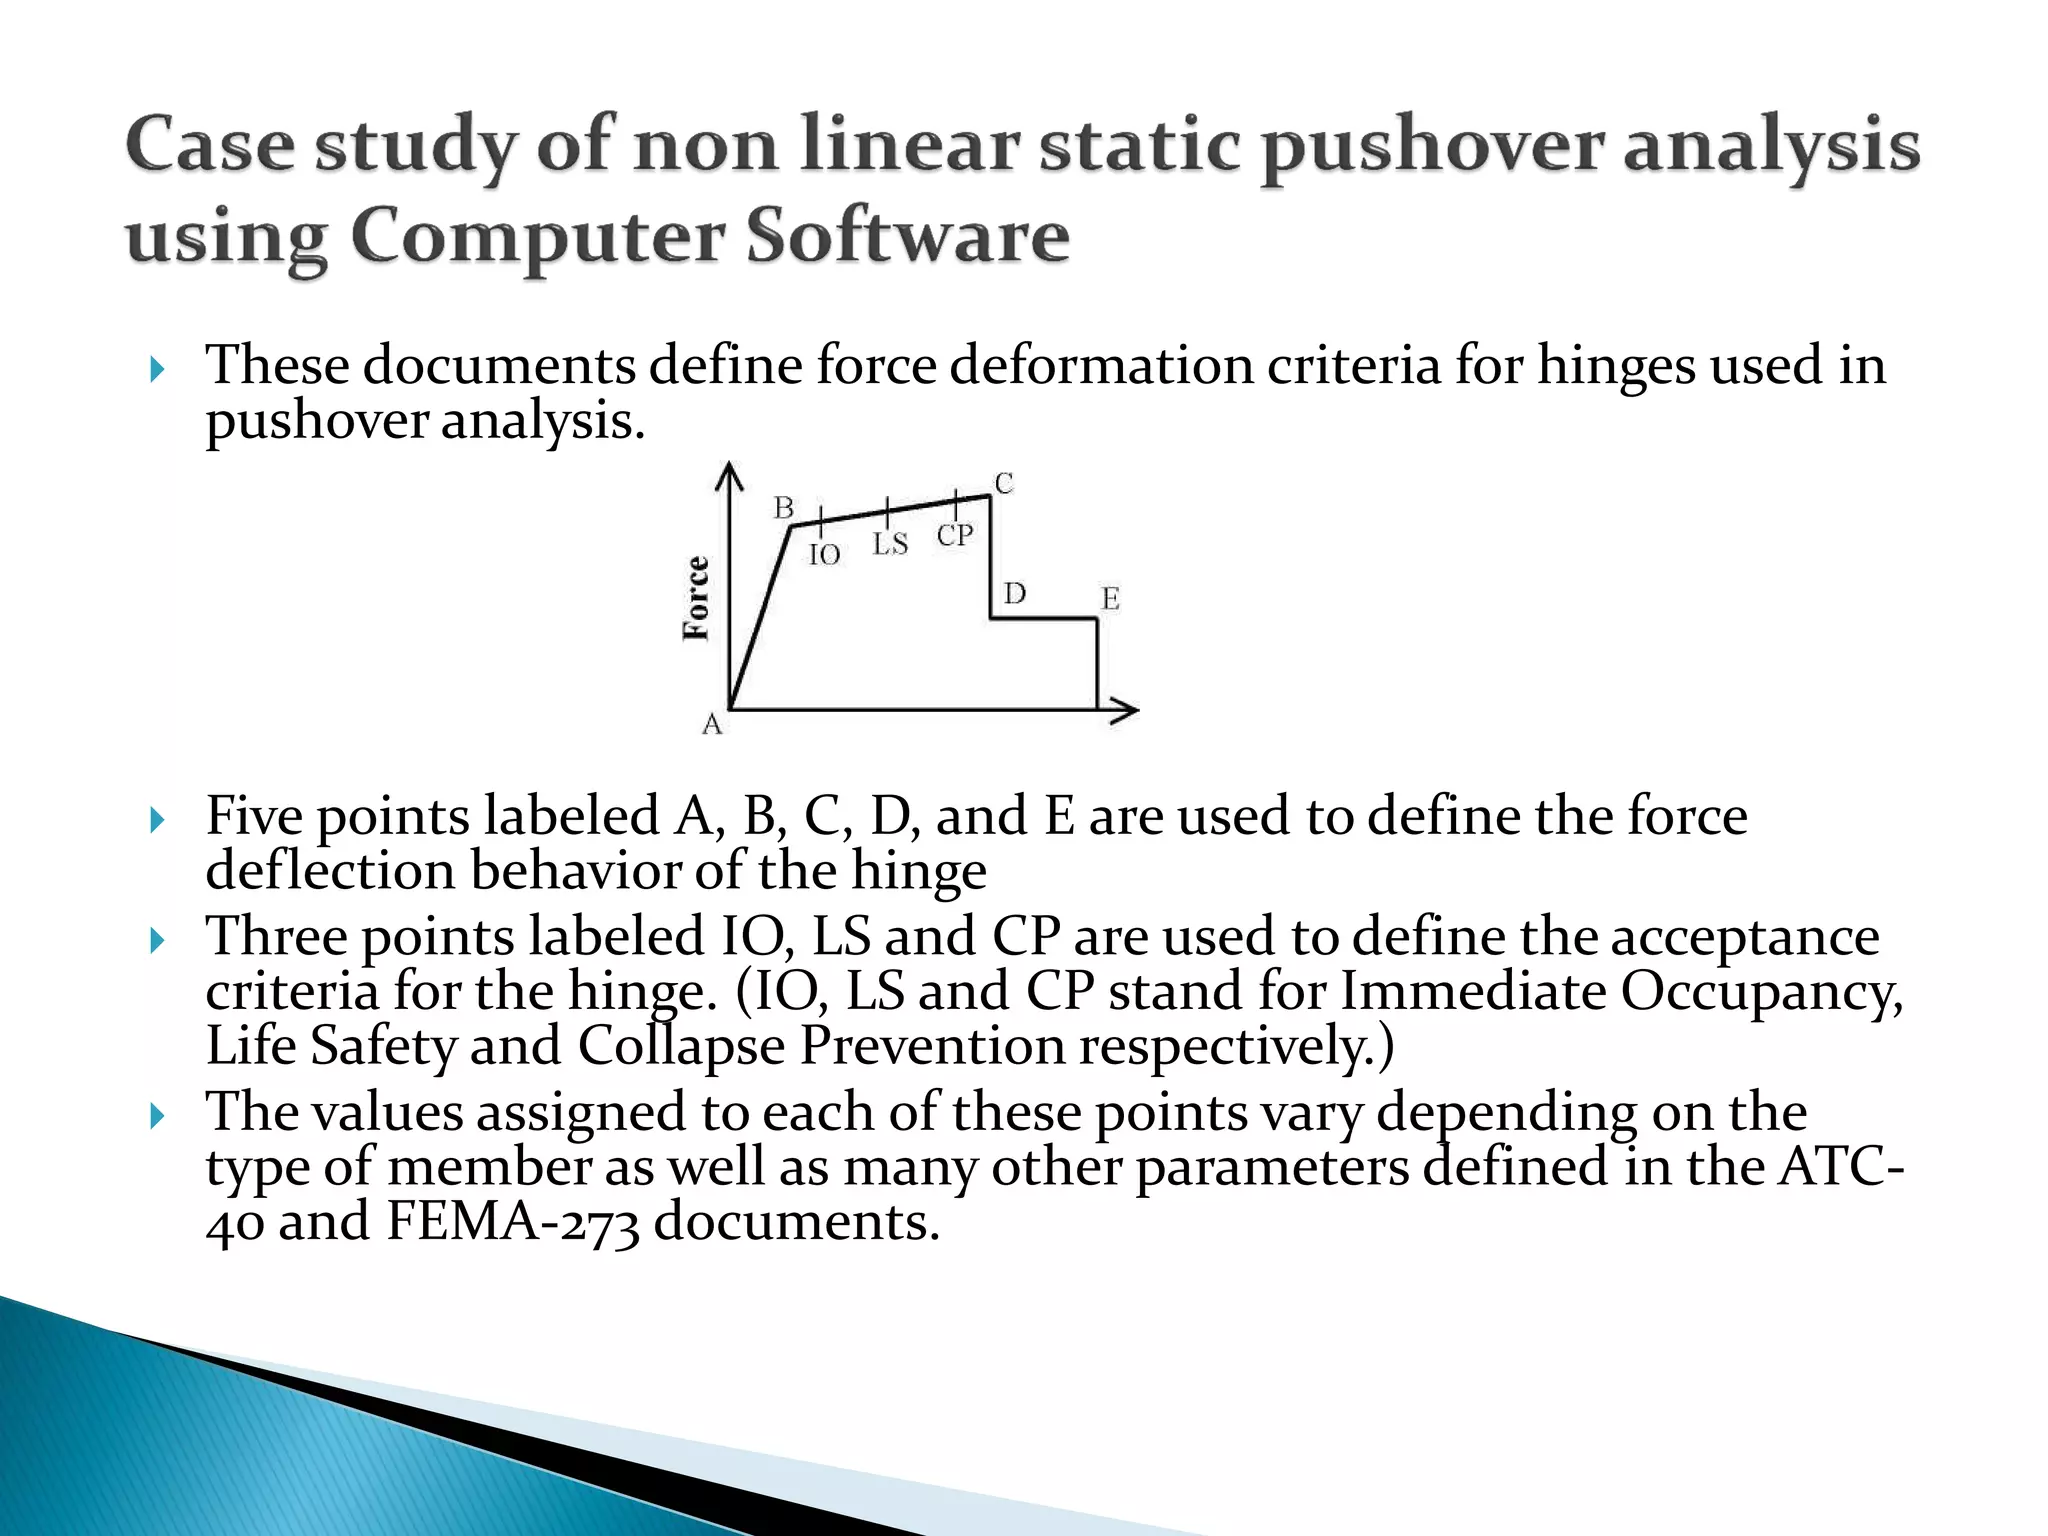
By
R.Jeyanthi
 Pushover is a static-nonlinear analysis method where a structure is
subjected to gravity loading and a monotonic displacement-
controlled lateral load pattern
 Lateral load may represent the range of base shear induced by
earthquake loading
 Output generates a static-pushover curve which plots a strength-
based parameter against deflection.
 For example, performance may relate the strength level achieved in
certain members against displacement at the top of the structure
 Results provide information about ductile capacity of the
structural system and indicate the mechanism, load level and
deflection at which failure occurs
 Purpose
How will a structure perform when subjected to given level
of earthquake
 Types of performance check:
◦ Linear static analysis
◦ Linear dynamic analysis
◦ Non Linear static analysis (Push over analysis)
◦ Non Linear dynamic analysis
 The existing building can become seismically deficient since seismic design
code requirements are constantly upgraded and advancement in engineering
knowledge.
 Further, Indian buildings built over past two decades are seismically deficient
because of lack of awareness regarding seismic behavior of structures.
 The widespread damage especially to RC buildings during earthquakes
exposed the construction practices being adopted around the world and
generated a great demand for seismic evaluation and retrofitting of existing
building stocks.
 Better understand building behavior
- Identify weak elements
- Realistic prediction of element demands
 Less conservative acceptance criteria can be used
 Simple to perform
Goal is to predict peak response of building and
components for a given earthquake
 Construct Pushover curve
 Select earthquake level(s) to check
 Select performance level(s) to check
 Select acceptance criteria for each performance level
 Verify acceptance
◦ Capacity Spectrum Method (ATC-40)
◦ Displacement Coefficient Method (FEMA 273)
 Define Structural Model
◦ Elements (components)
◦ Strength - deformation properties
 Define Loads
◦ Gravity
◦ Lateral load pattern
 Select Control Displacements or Drifts
 Perform Pushover Analysis
 Modeling the structure
 Perform a series of linear analysis
 Develop push over curve
 Determine effective dynamic properties
 Determine demand lateral displacement
 Check adequacy of elements
 Understand the structure before attempting a non
linear analysis
 Identify the following things,
◦ Critical elements
◦ Probable yield failure modes
◦ Importance of torsional behavior and need for 3D
modeling
 For best estimates design or specified strengths
should be used in determining material capacities
 use of artificially low nominal strengths will result
in under estimates of strength demands on some
elements
 Expected Steel yield - 1.25Fy
 Expected concrete compressive strength 1.33f’c
 Select a loading pattern for the structure
◦ Loading pattern should produce a deflected shape in the
structure similar to that it would undergo in earthquake
response
 Loading Pattern Alternatives
◦ Inverse triangular
◦ Rectangular
◦ First mode
◦ Modal dynamic
◦ Modal dynamic variant
◦ Multi-mode
 FEMA 356 requires use of at least:
◦ Inverse triangular or first mode
◦ Rectangular
 FEMA 440 found that there is not substantial difference in the
accuracy produced by the various load patterns
 Develop Pushover Curve
 Determine Effective Dynamic Properties
◦ Initially, perform elastic modal analysis to determine
fundamental period of structure, T
◦ Determine initial stiffness, ki from pushover curve as V1/Δ1
◦ Determine effective stiffness, ke at 60% of yield force from
pushover curve
 Determine Demand Lateral Displacement
◦ Capacity Spectrum Method - detailed in ATC-40
◦ Displacement Coefficient Method - detailed in FEMA-273
ATC 40 and FEMA 273 (FEDERAL EMERGENCY MANAGEMENT AGENCY are
the documents containing
◦ Modeling procedures
◦ Acceptance criterias
◦ Analysis procedure for pushover analysis
Construct Capacity Spectrum Determine Demand Spectrum
Determine Performance Point Verify Acceptance
 Estimate Target Displacement
oEstimate effective elastic stiffness, Ke
oEstimate post yield stiffness, Ks
oEstimate effective fundamental period, Te
oCalculate target roof displacement as
C0 Relates spectral to roof displacement
C1 Modifier for inelastic displacement
C2 Modifier for hysteresis loop shape
C3 Modifier for second order effects
)4/( 22
3210  ea TSCCCC
 Magnitude of the structural loading is incrementally
increased, which leads to the identification of
◦ weak links
◦ Failure modes of the structure
 ATC 40 and FEMA 273 are the documents containing
◦ Modeling procedures
◦ Acceptance criterias
◦ Analysis procedure for pushover analysis
 These documents define force deformation criteria for hinges used in
pushover analysis.
 Five points labeled A, B, C, D, and E are used to define the force
deflection behavior of the hinge
 Three points labeled IO, LS and CP are used to define the acceptance
criteria for the hinge. (IO, LS and CP stand for Immediate Occupancy,
Life Safety and Collapse Prevention respectively.)
 The values assigned to each of these points vary depending on the
type of member as well as many other parameters defined in the ATC-
40 and FEMA-273 documents.
 Create the basic computer model (without the pushover
data)
 Define properties and acceptance criteria for the pushover
hinges
 The program includes several built-in default hinge
properties that are based on average values from ATC-40
for concrete members and average values from FEMA-273
for steel members.
These built in properties can be useful for preliminary
analyses, but user-defined properties are recommended
for final analyses. This example uses default properties
 Locate the pushover hinges on the model by selecting one
or more frame members
 Define the pushover load cases
o Gravity load case and lateral load case .
o Pushover load cases can be force controlled,
ie. pushed to a certain defined force level,
or they can be displacement controlled,
ie. pushed to a specified displacement.
 Run the basic static analysis and, if desired, dynamic
analysis. Then run the static nonlinear pushover analysis
 Display the pushover curve, the number of hinges in each
state as defined in Figure 1 can be viewed
 Display the capacity spectrum curve. The performance
point for a given set of values is defined by the intersection
of the capacity curve (green) and the single demand
spectrum curve (yellow).
 Review the pushover displaced shape and sequence of
hinge formation on a step-by-step basis

Non linear static pushover analysis

  • 1.
  • 2.
     Pushover isa static-nonlinear analysis method where a structure is subjected to gravity loading and a monotonic displacement- controlled lateral load pattern  Lateral load may represent the range of base shear induced by earthquake loading  Output generates a static-pushover curve which plots a strength- based parameter against deflection.  For example, performance may relate the strength level achieved in certain members against displacement at the top of the structure  Results provide information about ductile capacity of the structural system and indicate the mechanism, load level and deflection at which failure occurs
  • 3.
     Purpose How willa structure perform when subjected to given level of earthquake  Types of performance check: ◦ Linear static analysis ◦ Linear dynamic analysis ◦ Non Linear static analysis (Push over analysis) ◦ Non Linear dynamic analysis
  • 4.
     The existingbuilding can become seismically deficient since seismic design code requirements are constantly upgraded and advancement in engineering knowledge.  Further, Indian buildings built over past two decades are seismically deficient because of lack of awareness regarding seismic behavior of structures.  The widespread damage especially to RC buildings during earthquakes exposed the construction practices being adopted around the world and generated a great demand for seismic evaluation and retrofitting of existing building stocks.
  • 5.
     Better understandbuilding behavior - Identify weak elements - Realistic prediction of element demands  Less conservative acceptance criteria can be used  Simple to perform
  • 6.
    Goal is topredict peak response of building and components for a given earthquake
  • 7.
     Construct Pushovercurve  Select earthquake level(s) to check  Select performance level(s) to check  Select acceptance criteria for each performance level  Verify acceptance ◦ Capacity Spectrum Method (ATC-40) ◦ Displacement Coefficient Method (FEMA 273)
  • 8.
     Define StructuralModel ◦ Elements (components) ◦ Strength - deformation properties  Define Loads ◦ Gravity ◦ Lateral load pattern  Select Control Displacements or Drifts  Perform Pushover Analysis
  • 9.
     Modeling thestructure  Perform a series of linear analysis  Develop push over curve  Determine effective dynamic properties  Determine demand lateral displacement  Check adequacy of elements
  • 10.
     Understand thestructure before attempting a non linear analysis  Identify the following things, ◦ Critical elements ◦ Probable yield failure modes ◦ Importance of torsional behavior and need for 3D modeling
  • 11.
     For bestestimates design or specified strengths should be used in determining material capacities  use of artificially low nominal strengths will result in under estimates of strength demands on some elements  Expected Steel yield - 1.25Fy  Expected concrete compressive strength 1.33f’c
  • 12.
     Select aloading pattern for the structure ◦ Loading pattern should produce a deflected shape in the structure similar to that it would undergo in earthquake response  Loading Pattern Alternatives ◦ Inverse triangular ◦ Rectangular ◦ First mode ◦ Modal dynamic ◦ Modal dynamic variant ◦ Multi-mode  FEMA 356 requires use of at least: ◦ Inverse triangular or first mode ◦ Rectangular  FEMA 440 found that there is not substantial difference in the accuracy produced by the various load patterns
  • 13.
     Develop PushoverCurve  Determine Effective Dynamic Properties ◦ Initially, perform elastic modal analysis to determine fundamental period of structure, T ◦ Determine initial stiffness, ki from pushover curve as V1/Δ1 ◦ Determine effective stiffness, ke at 60% of yield force from pushover curve
  • 14.
     Determine DemandLateral Displacement ◦ Capacity Spectrum Method - detailed in ATC-40 ◦ Displacement Coefficient Method - detailed in FEMA-273 ATC 40 and FEMA 273 (FEDERAL EMERGENCY MANAGEMENT AGENCY are the documents containing ◦ Modeling procedures ◦ Acceptance criterias ◦ Analysis procedure for pushover analysis
  • 15.
    Construct Capacity SpectrumDetermine Demand Spectrum Determine Performance Point Verify Acceptance
  • 16.
     Estimate TargetDisplacement oEstimate effective elastic stiffness, Ke oEstimate post yield stiffness, Ks oEstimate effective fundamental period, Te oCalculate target roof displacement as C0 Relates spectral to roof displacement C1 Modifier for inelastic displacement C2 Modifier for hysteresis loop shape C3 Modifier for second order effects )4/( 22 3210  ea TSCCCC
  • 17.
     Magnitude ofthe structural loading is incrementally increased, which leads to the identification of ◦ weak links ◦ Failure modes of the structure  ATC 40 and FEMA 273 are the documents containing ◦ Modeling procedures ◦ Acceptance criterias ◦ Analysis procedure for pushover analysis
  • 18.
     These documentsdefine force deformation criteria for hinges used in pushover analysis.  Five points labeled A, B, C, D, and E are used to define the force deflection behavior of the hinge  Three points labeled IO, LS and CP are used to define the acceptance criteria for the hinge. (IO, LS and CP stand for Immediate Occupancy, Life Safety and Collapse Prevention respectively.)  The values assigned to each of these points vary depending on the type of member as well as many other parameters defined in the ATC- 40 and FEMA-273 documents.
  • 19.
     Create thebasic computer model (without the pushover data)  Define properties and acceptance criteria for the pushover hinges  The program includes several built-in default hinge properties that are based on average values from ATC-40 for concrete members and average values from FEMA-273 for steel members. These built in properties can be useful for preliminary analyses, but user-defined properties are recommended for final analyses. This example uses default properties
  • 20.
     Locate thepushover hinges on the model by selecting one or more frame members  Define the pushover load cases o Gravity load case and lateral load case . o Pushover load cases can be force controlled, ie. pushed to a certain defined force level, or they can be displacement controlled, ie. pushed to a specified displacement.  Run the basic static analysis and, if desired, dynamic analysis. Then run the static nonlinear pushover analysis
  • 21.
     Display thepushover curve, the number of hinges in each state as defined in Figure 1 can be viewed  Display the capacity spectrum curve. The performance point for a given set of values is defined by the intersection of the capacity curve (green) and the single demand spectrum curve (yellow).  Review the pushover displaced shape and sequence of hinge formation on a step-by-step basis