Download to read offline

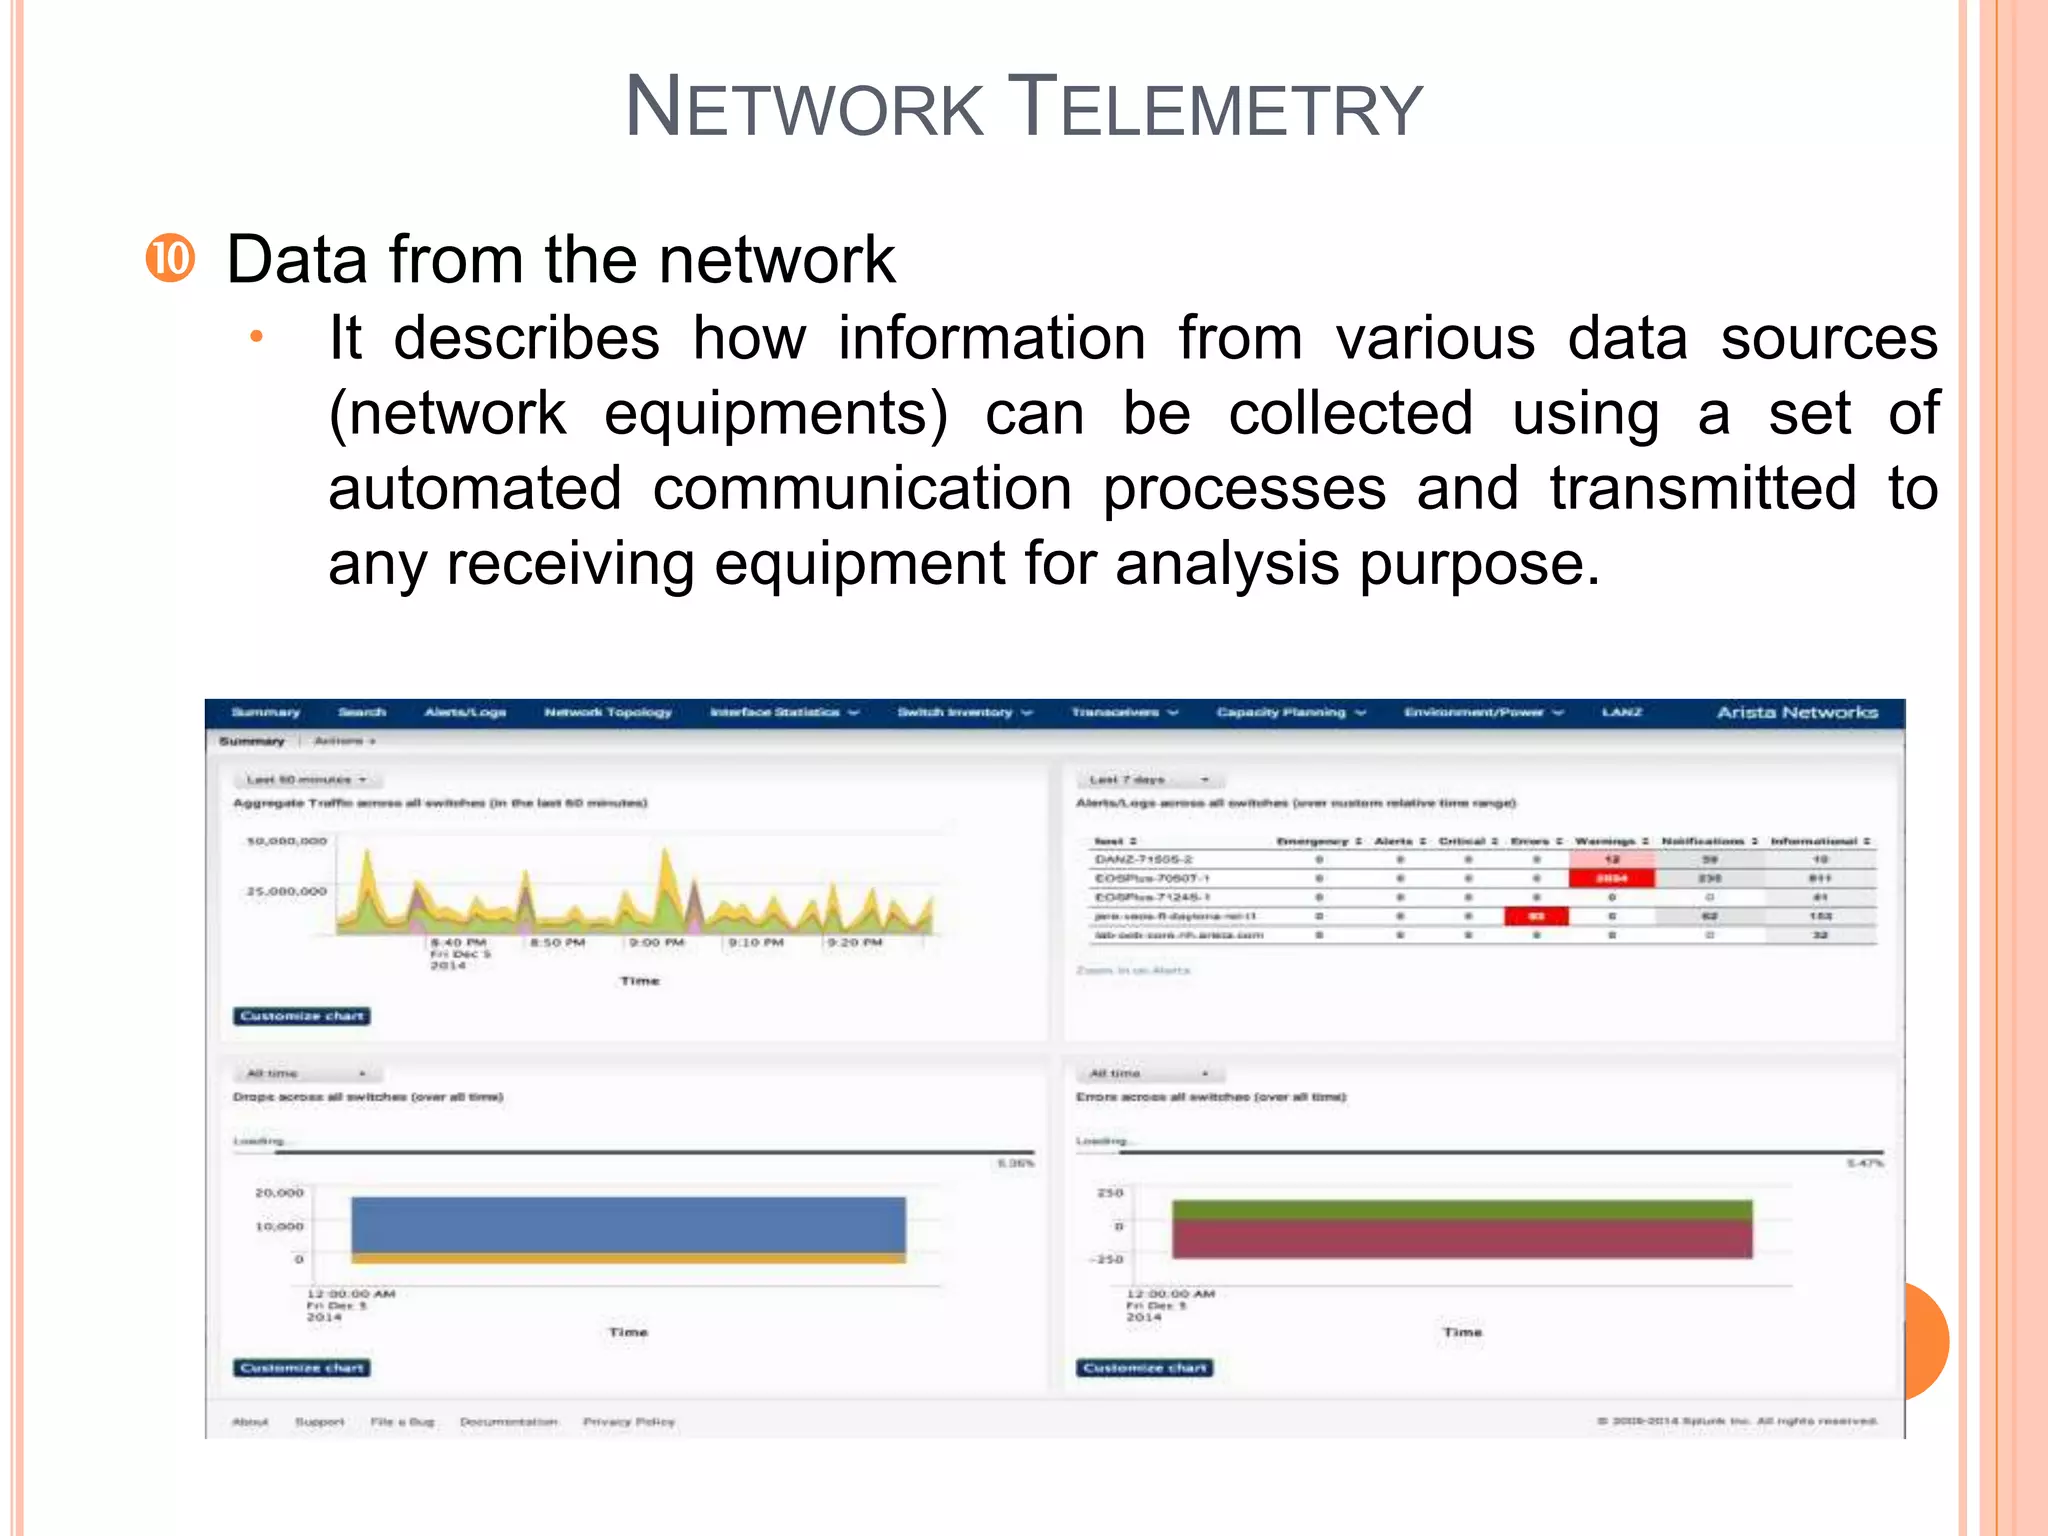
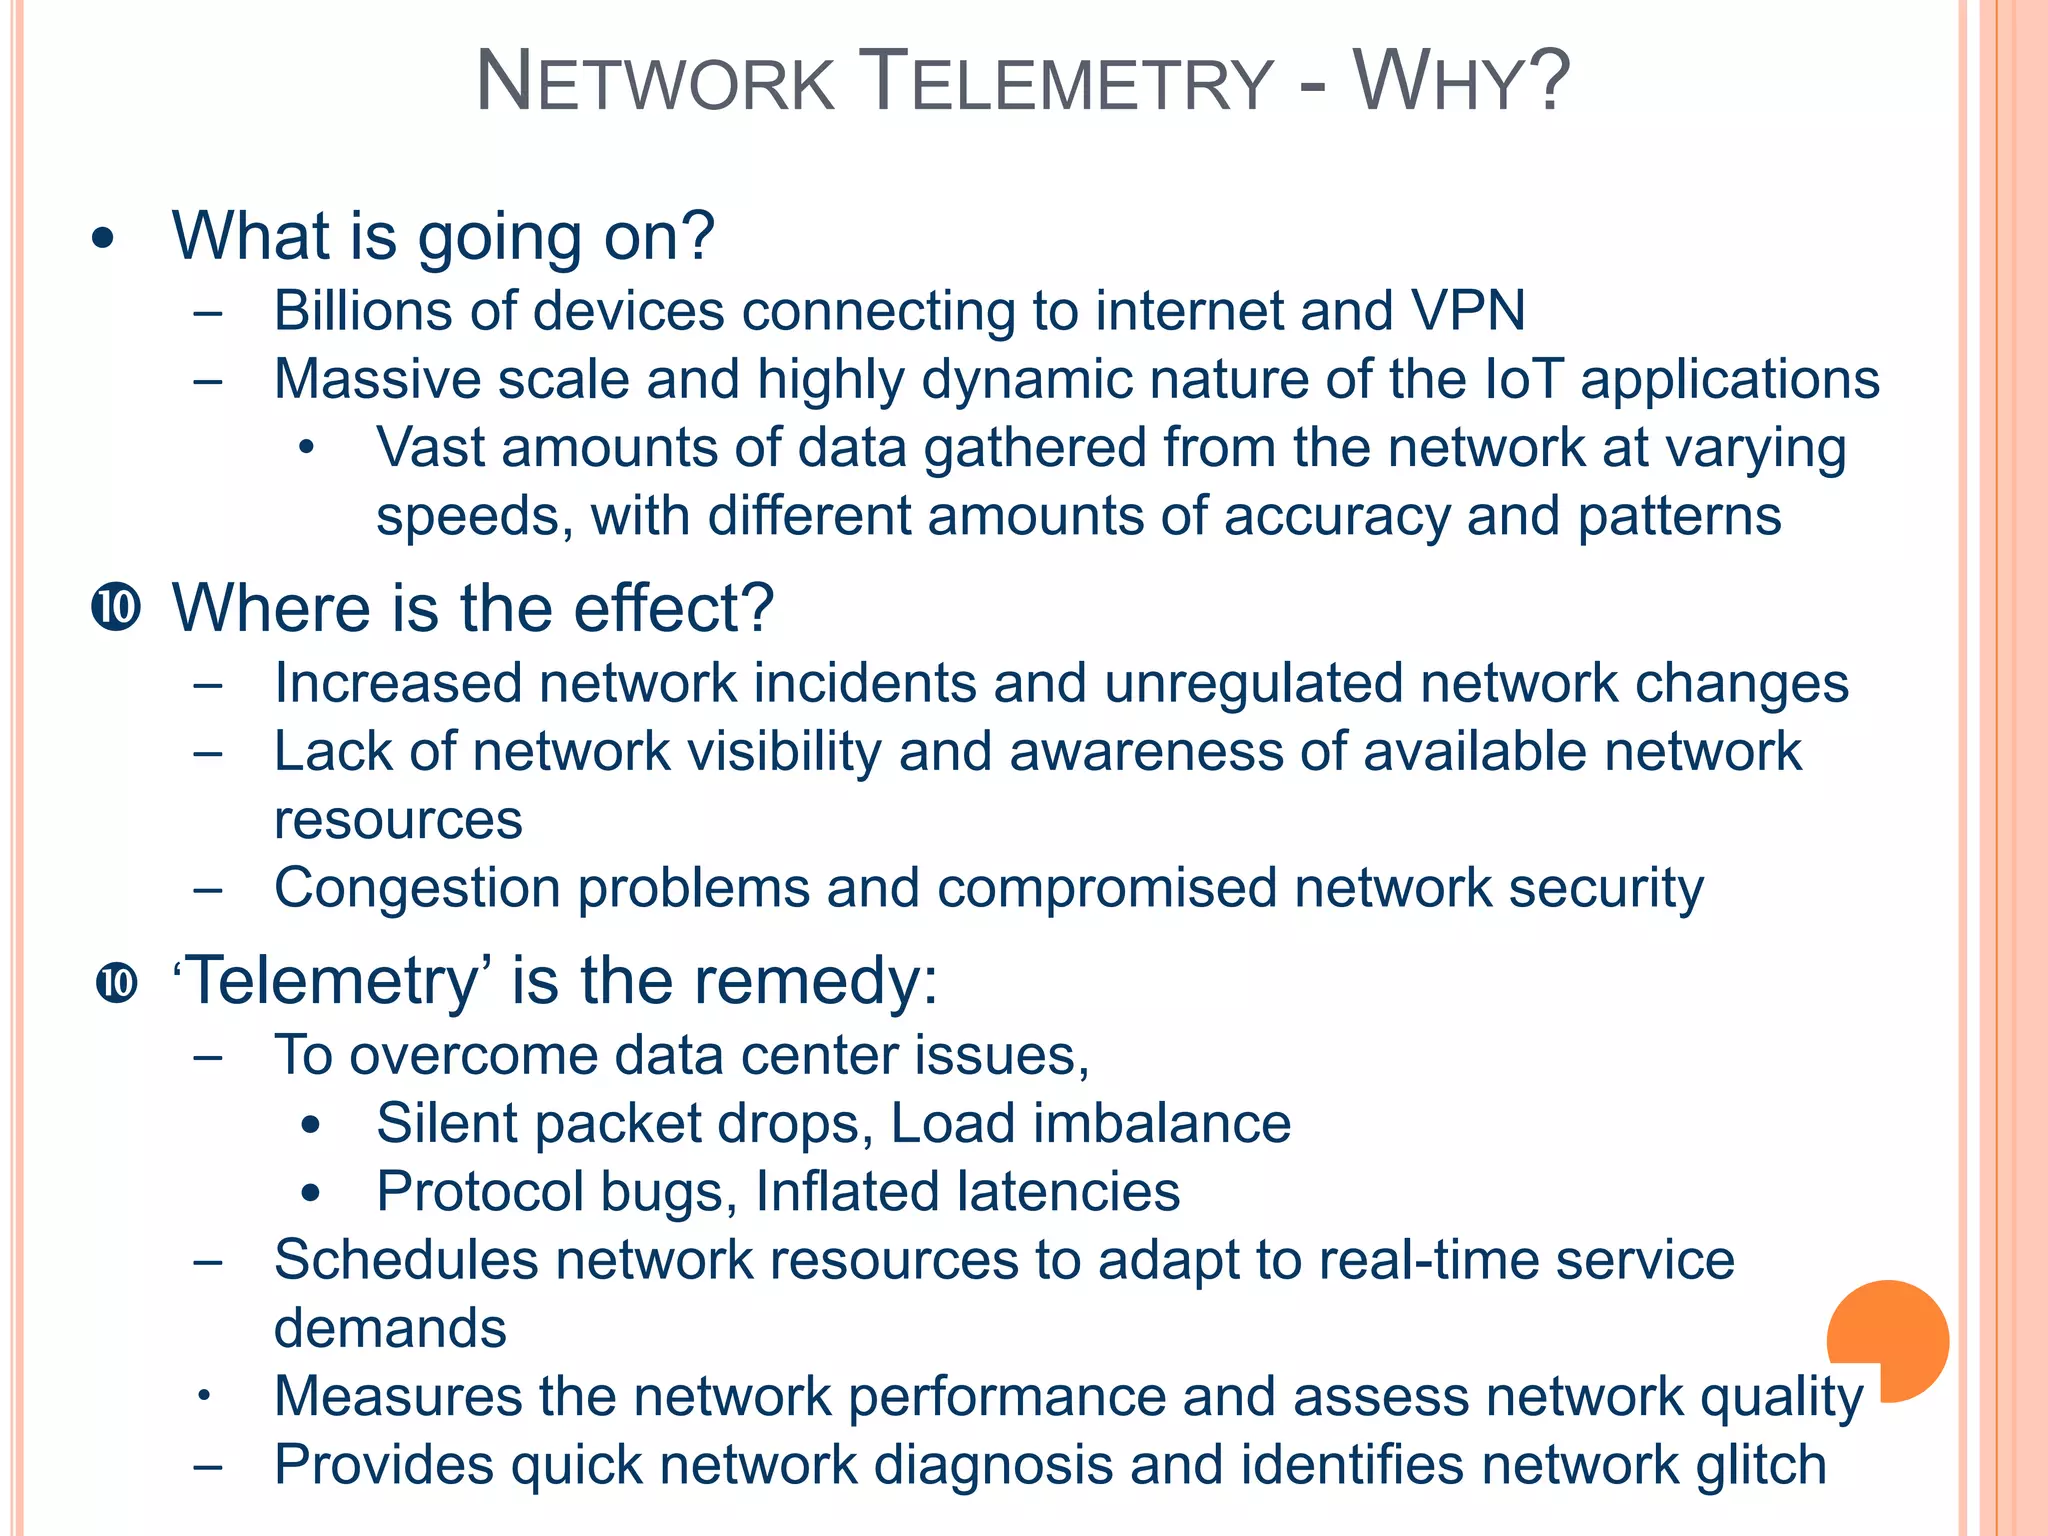
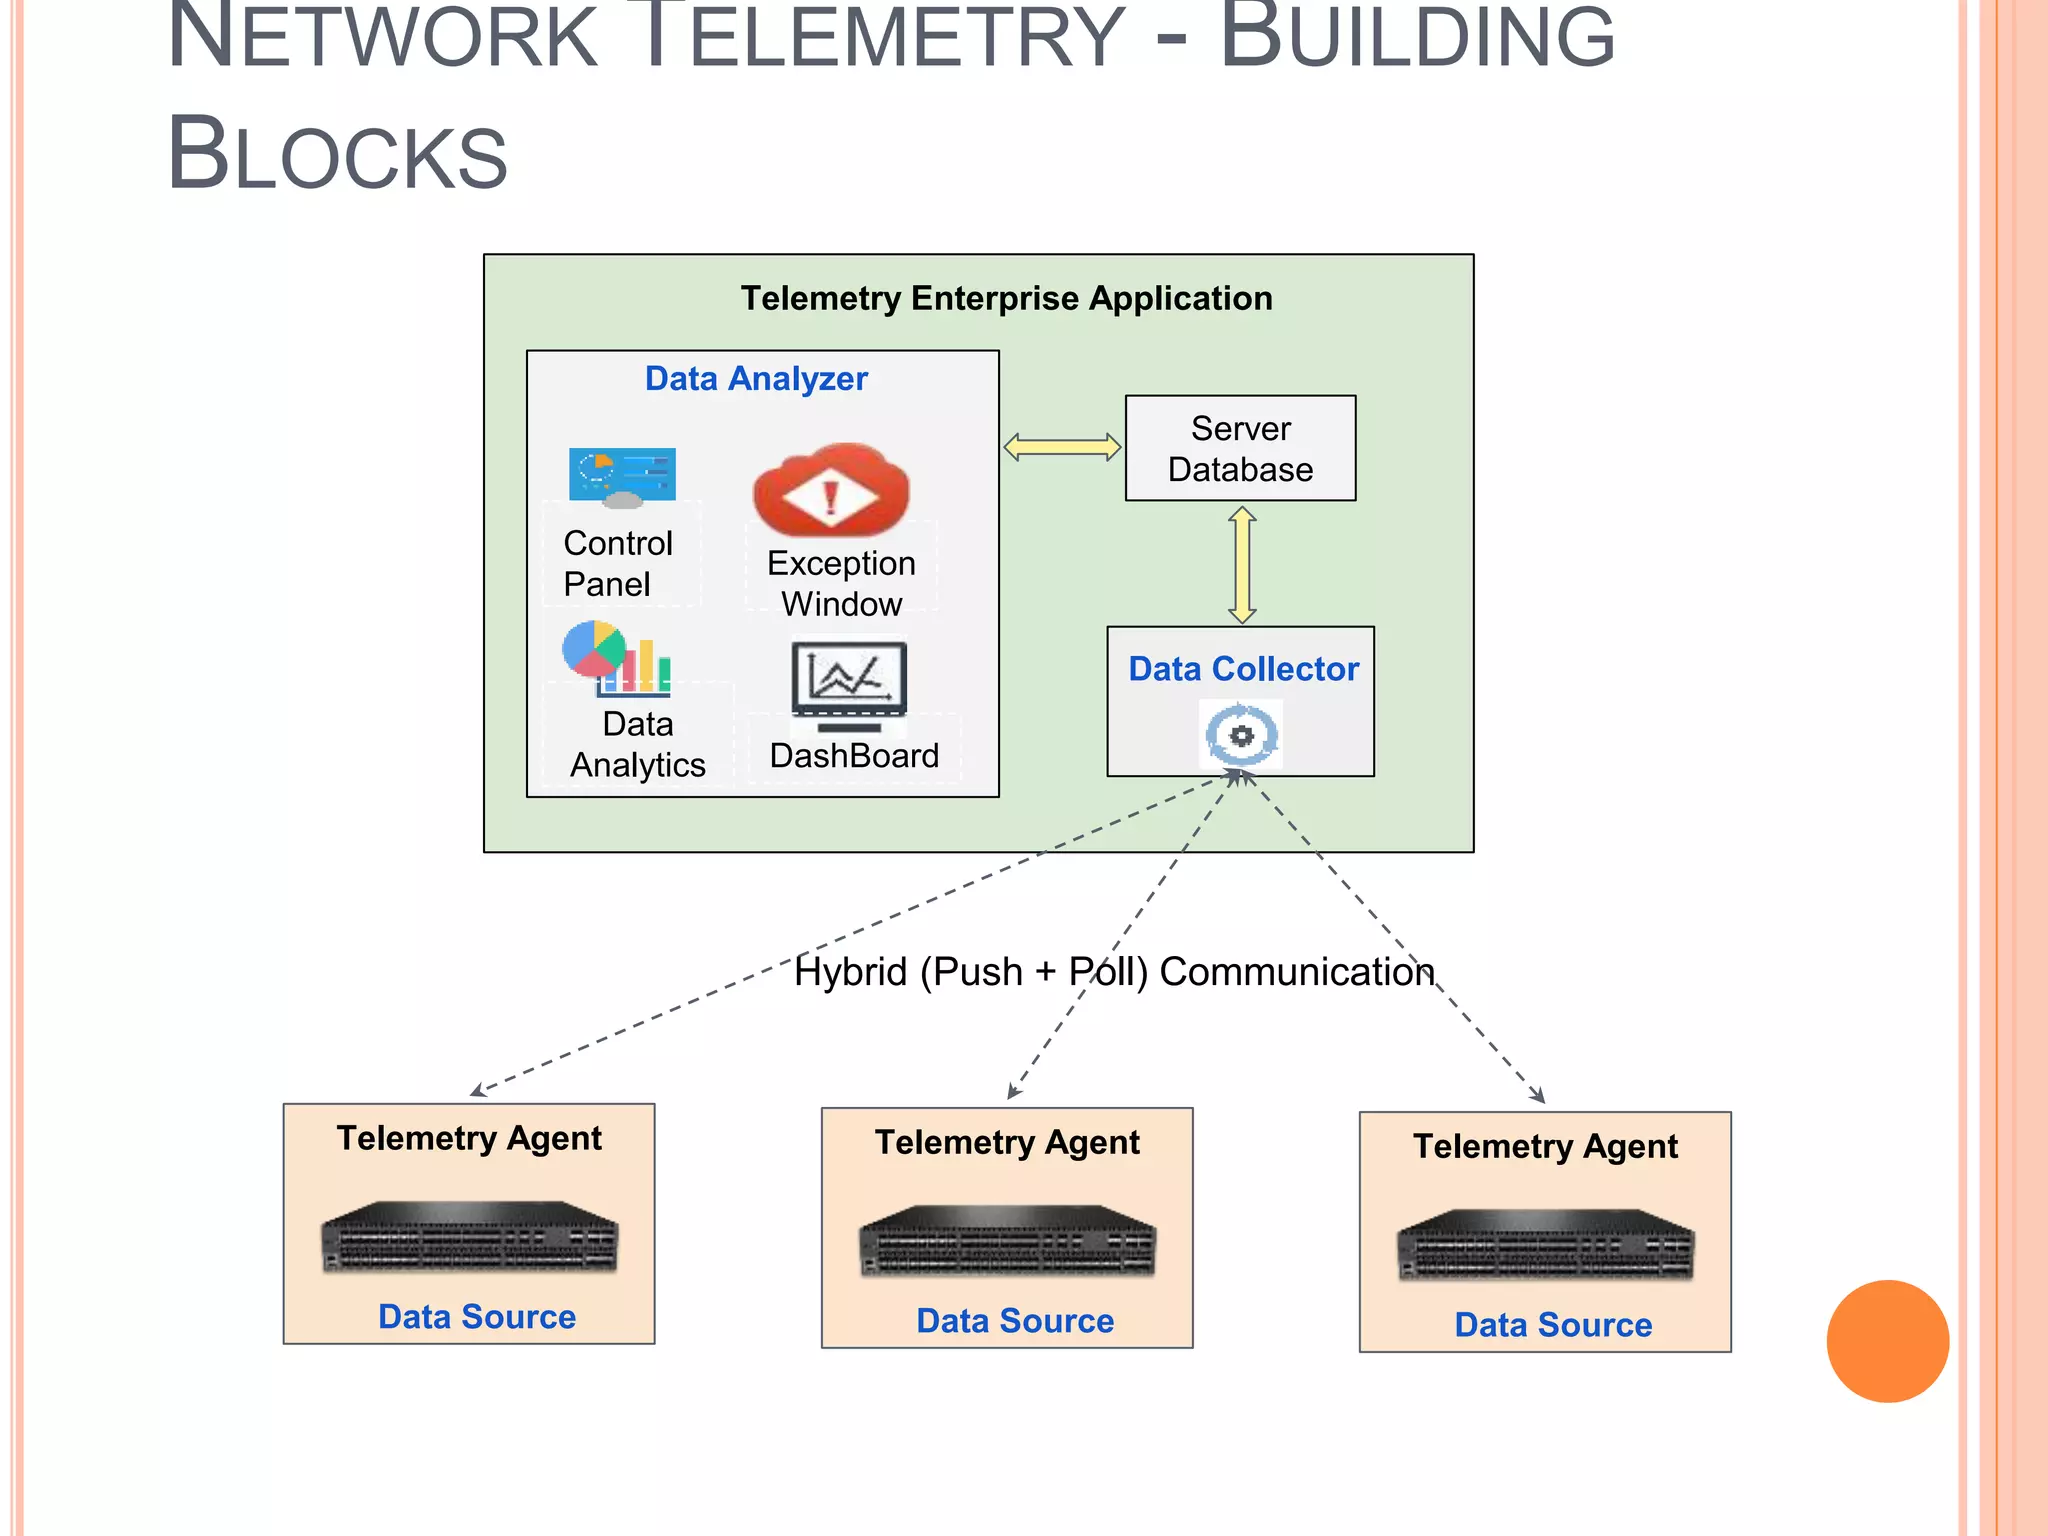
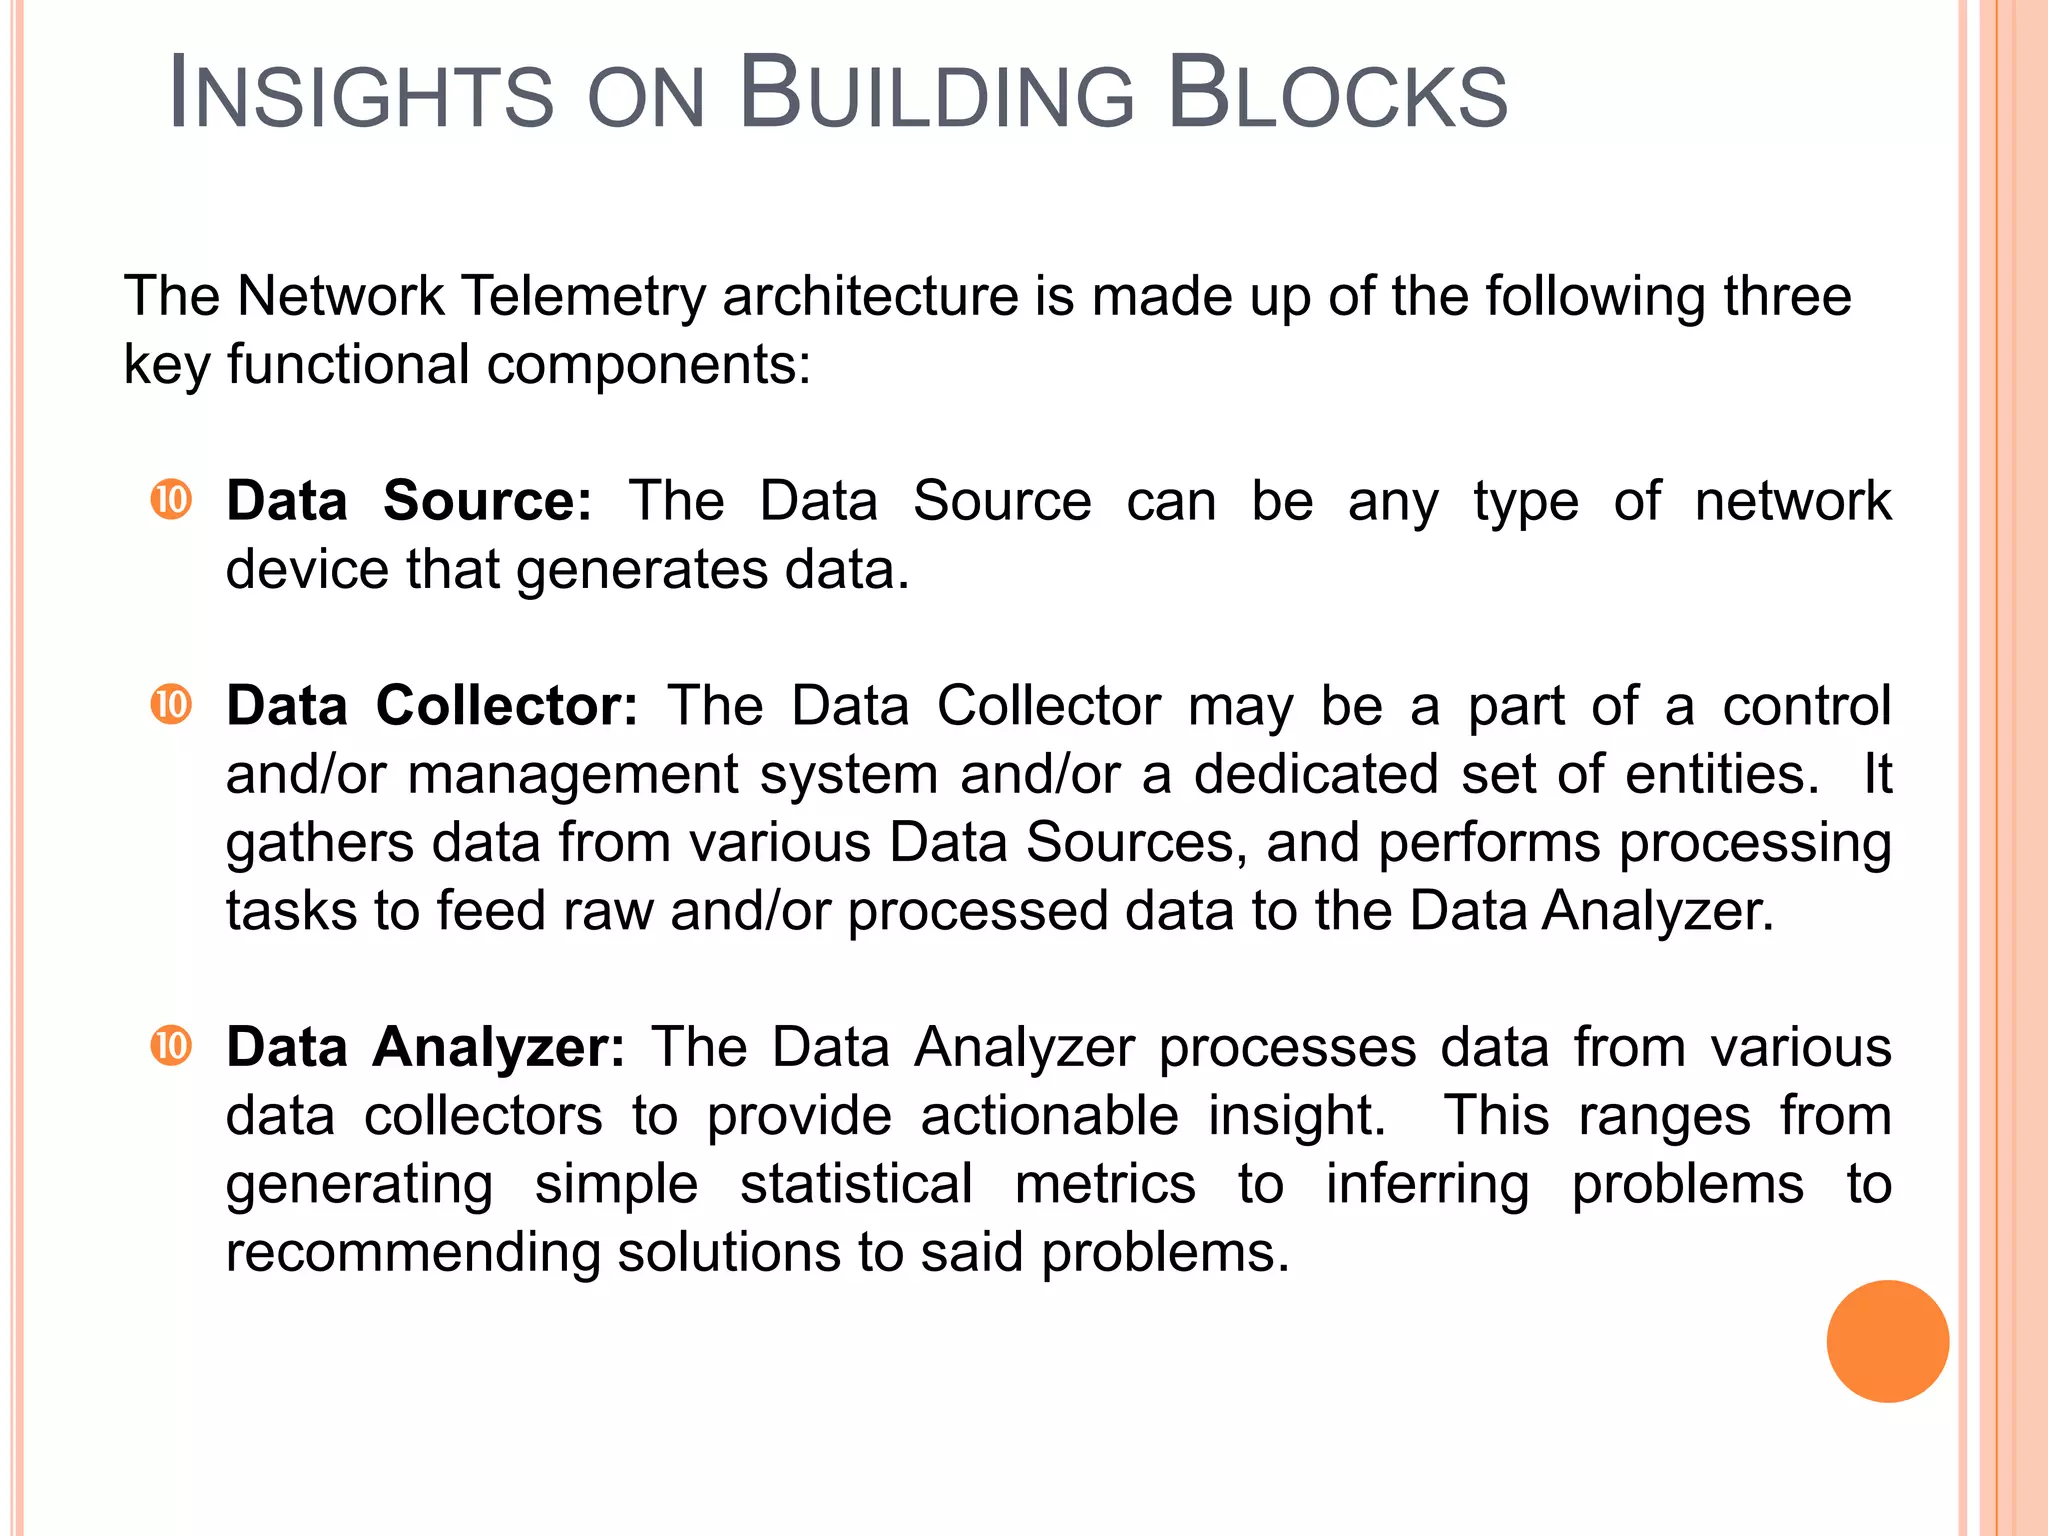
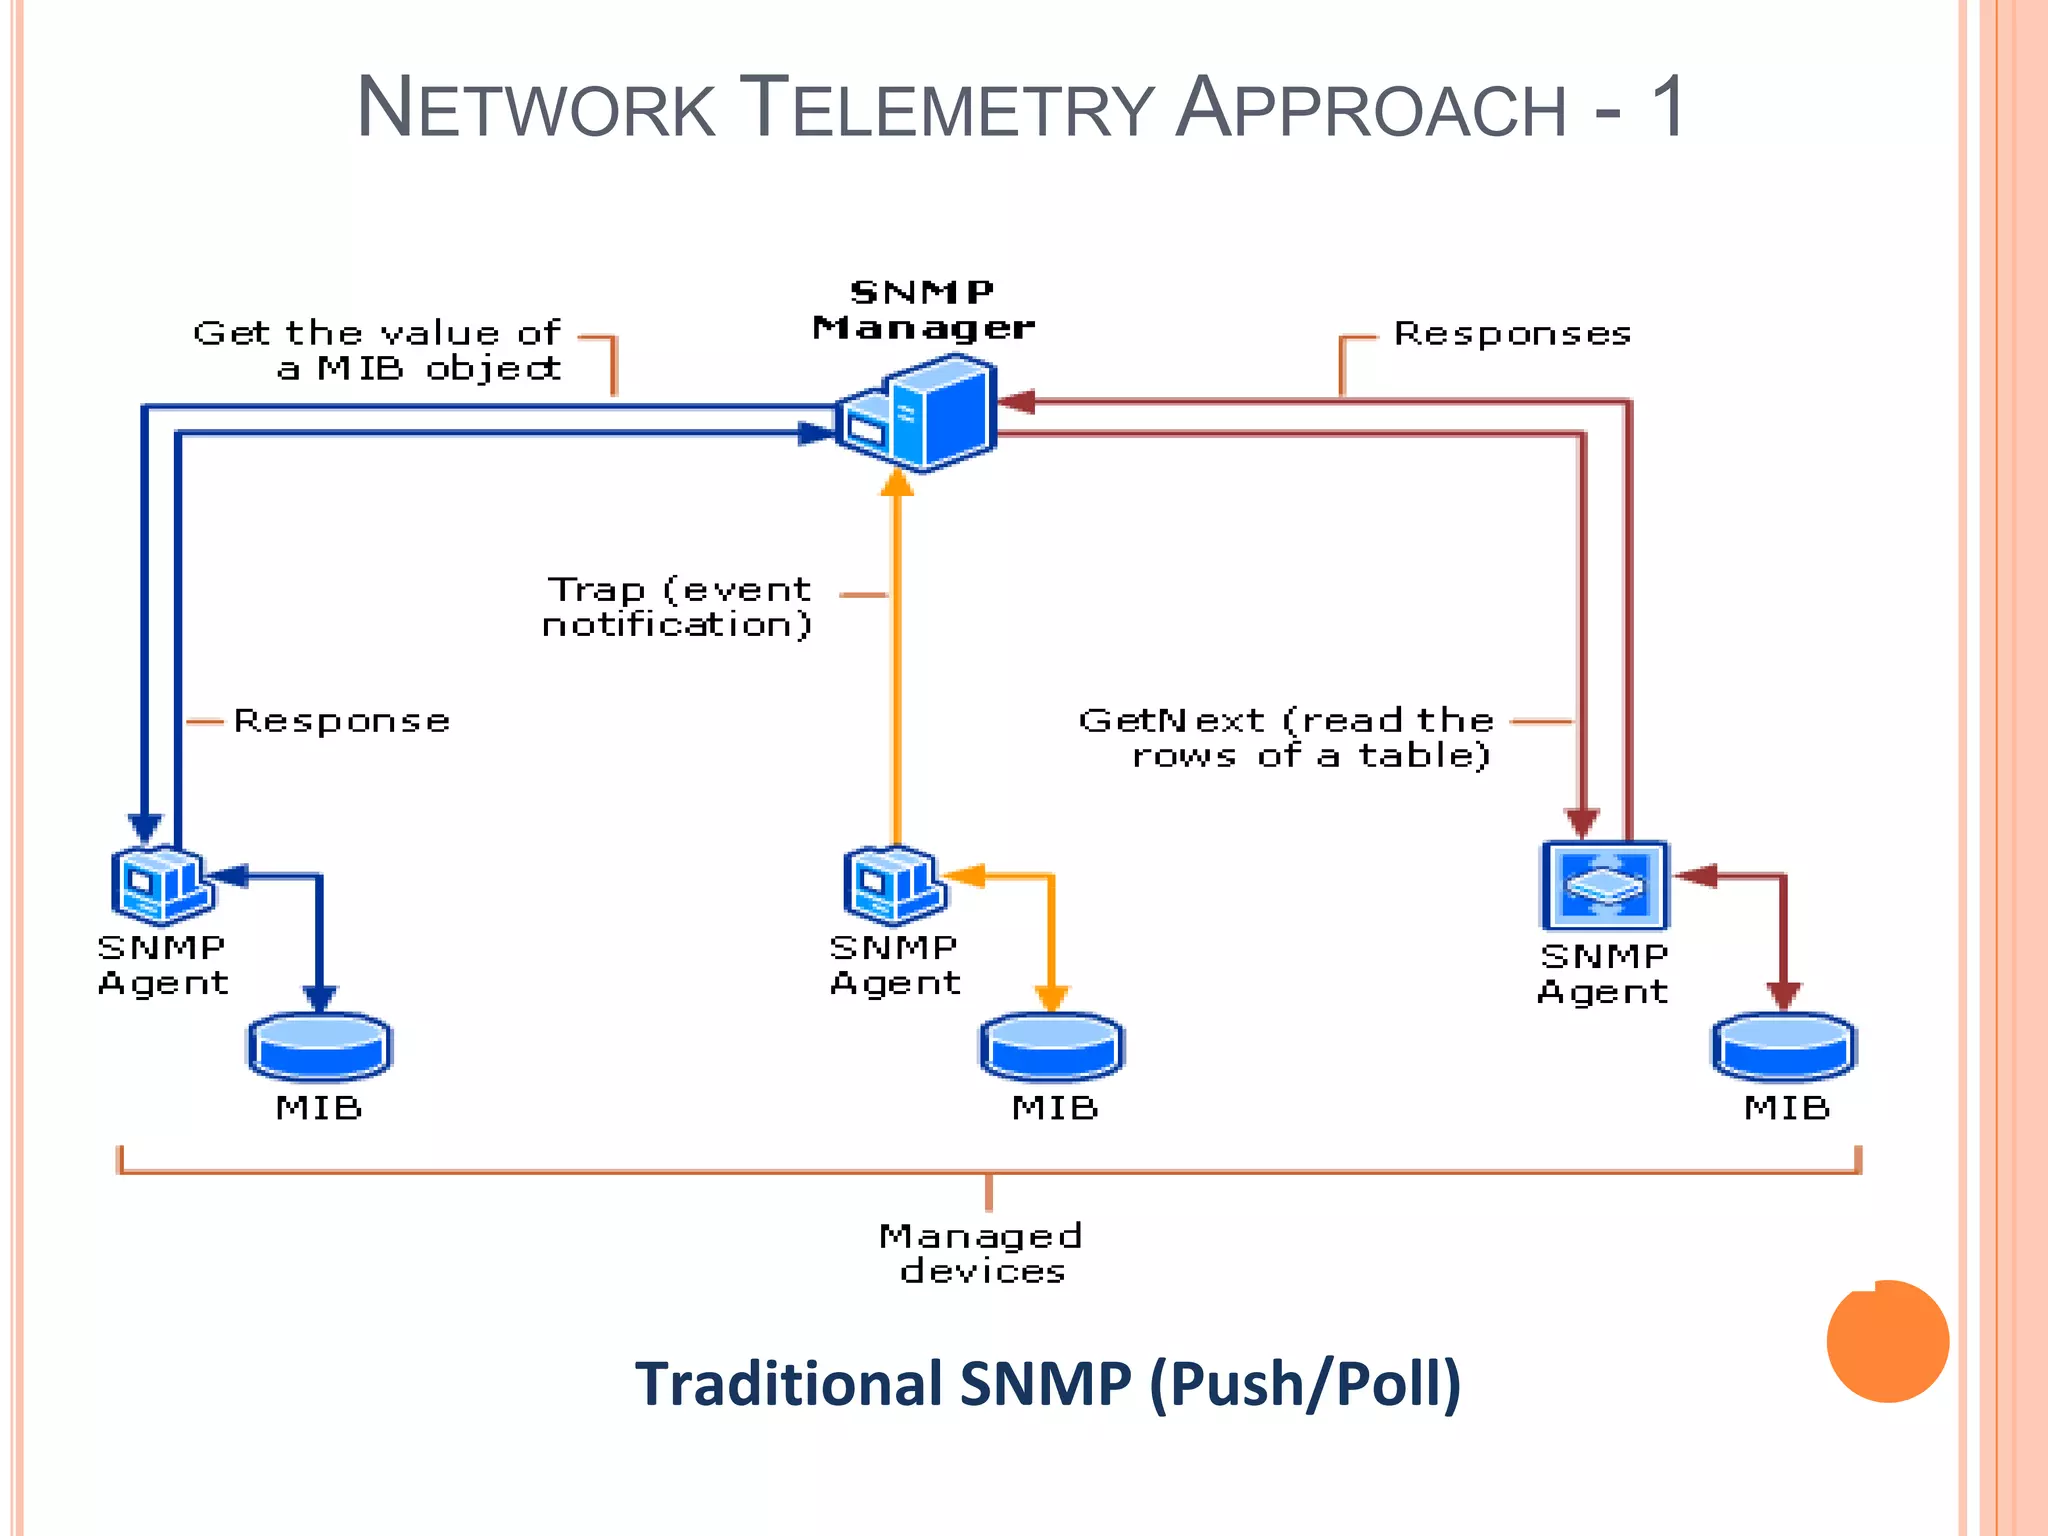
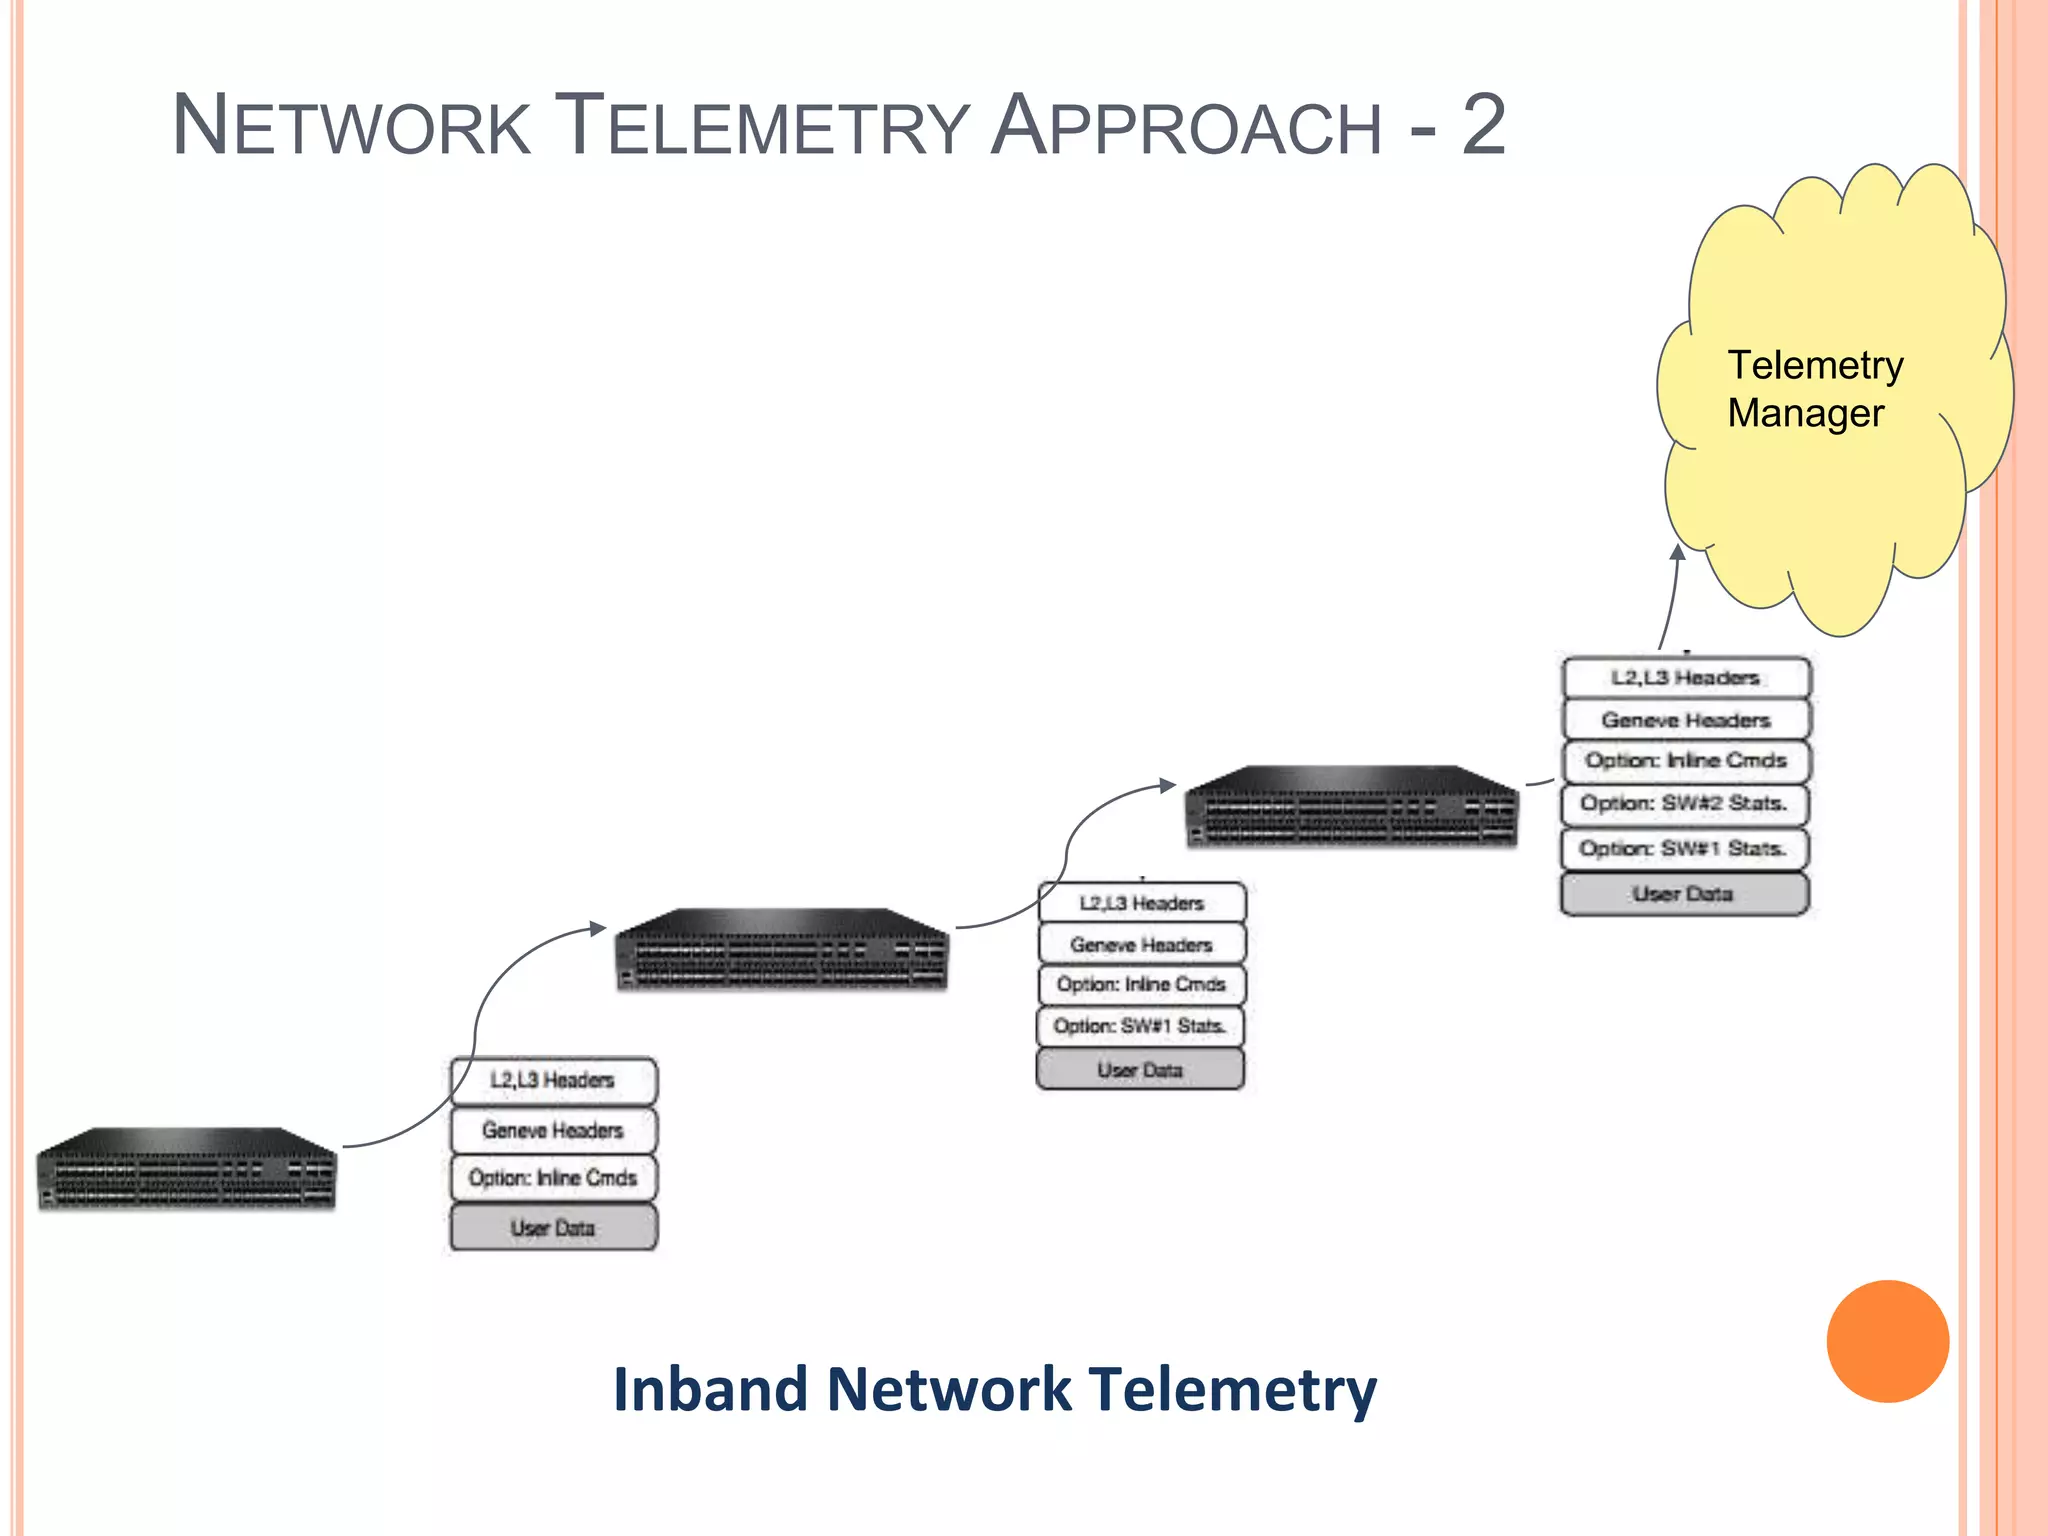

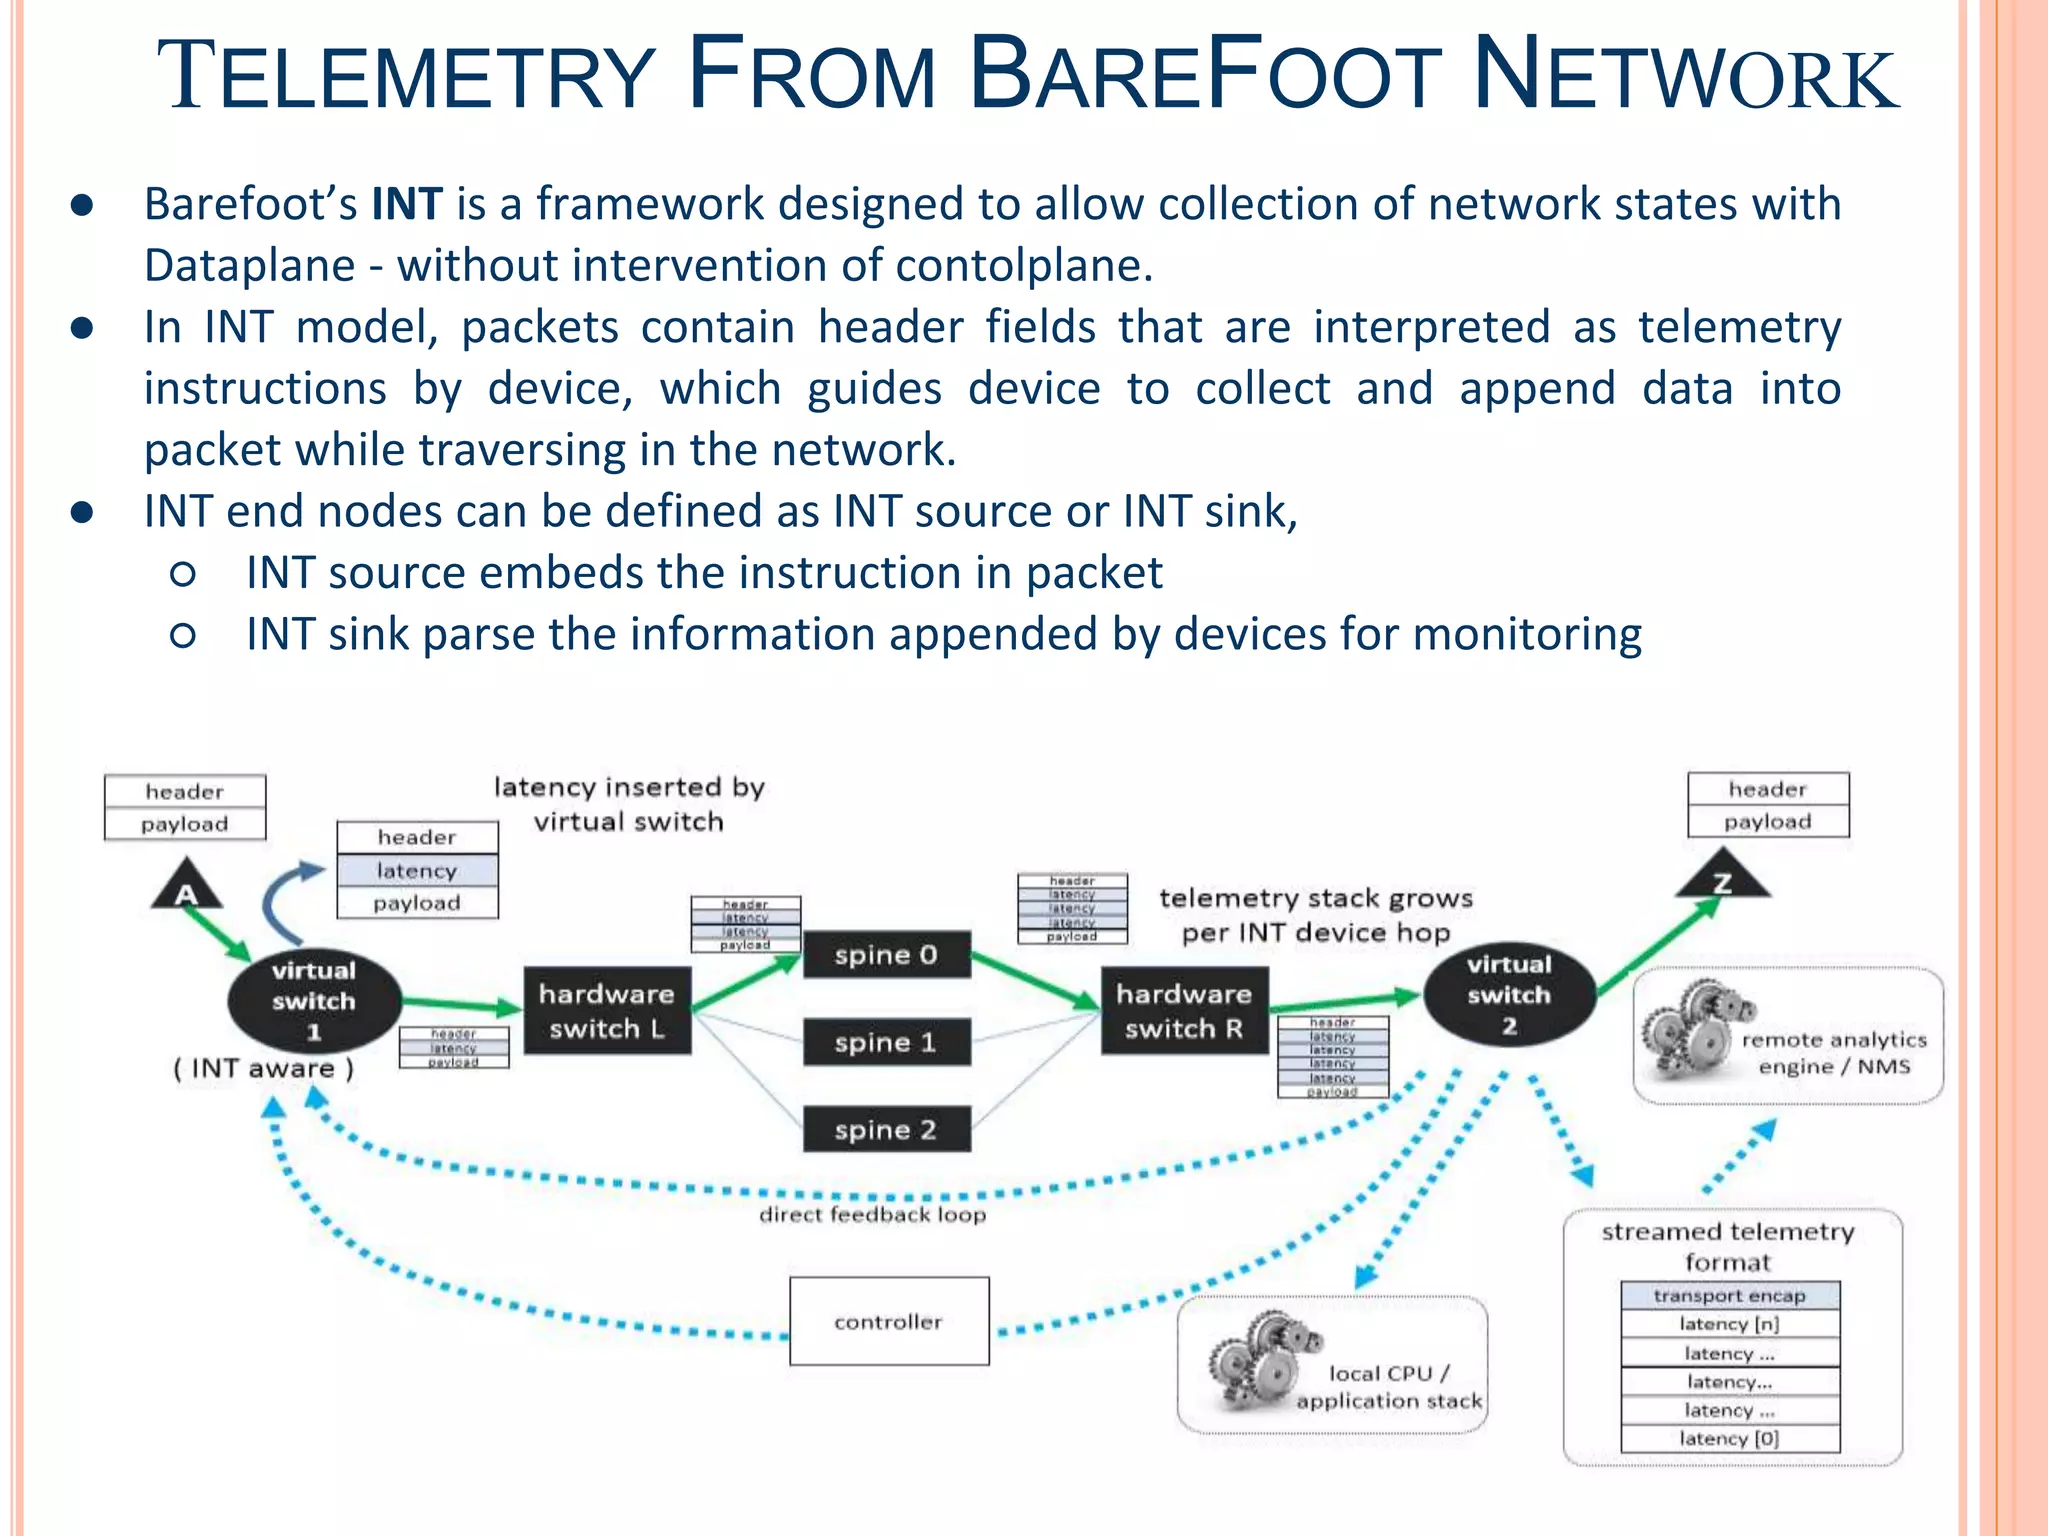
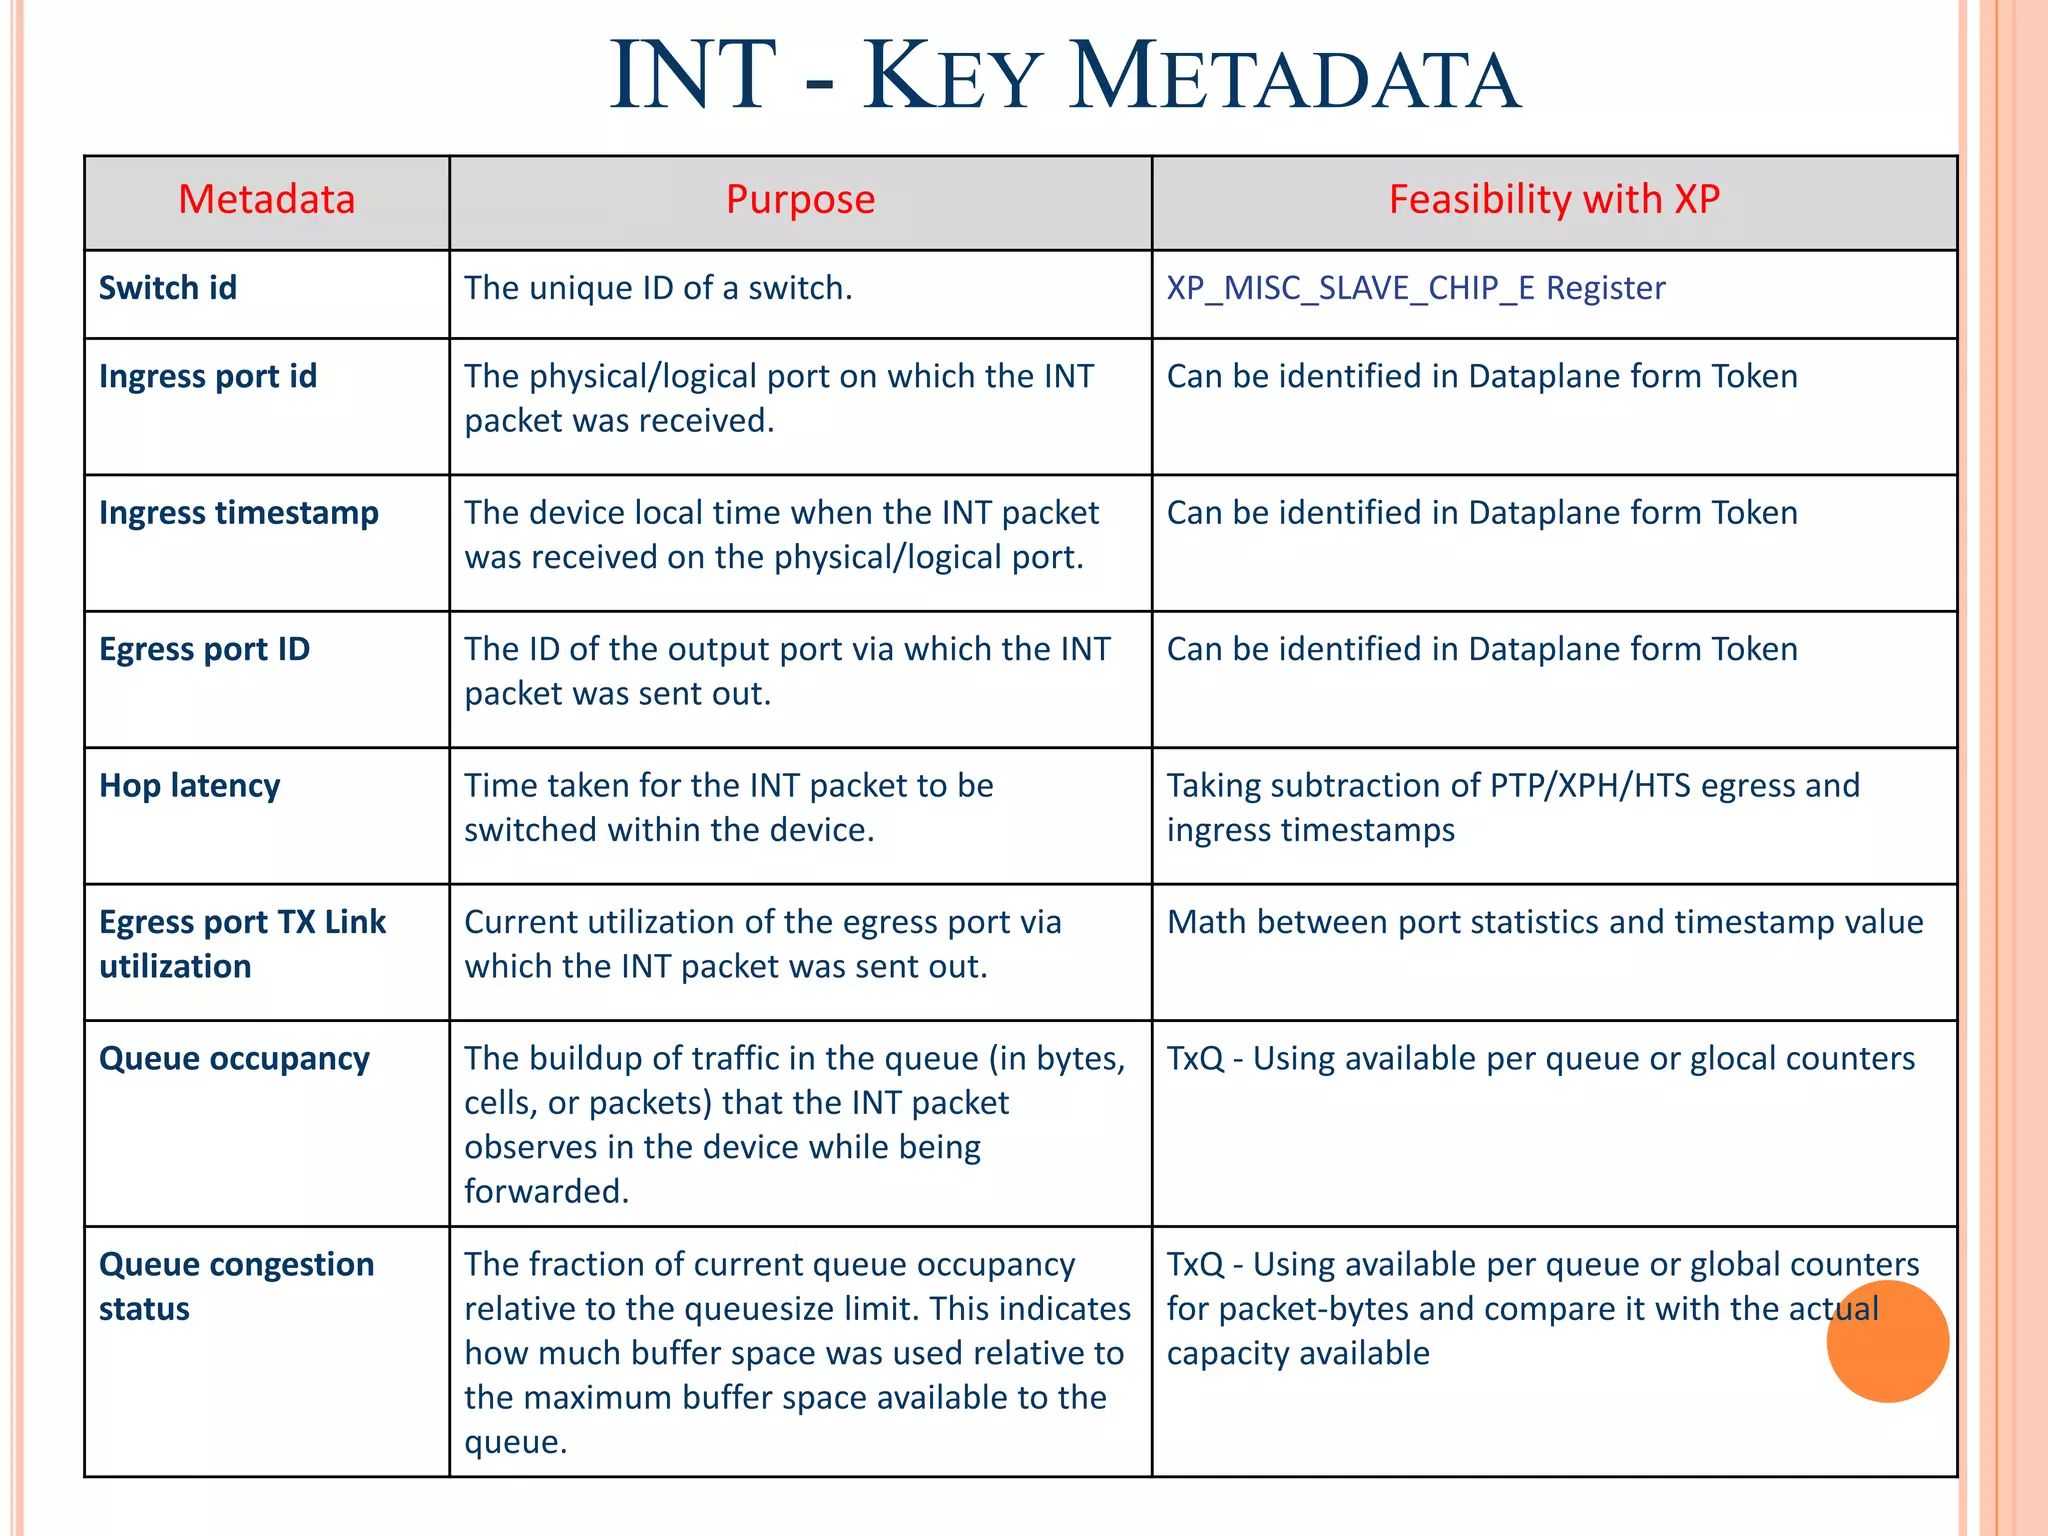
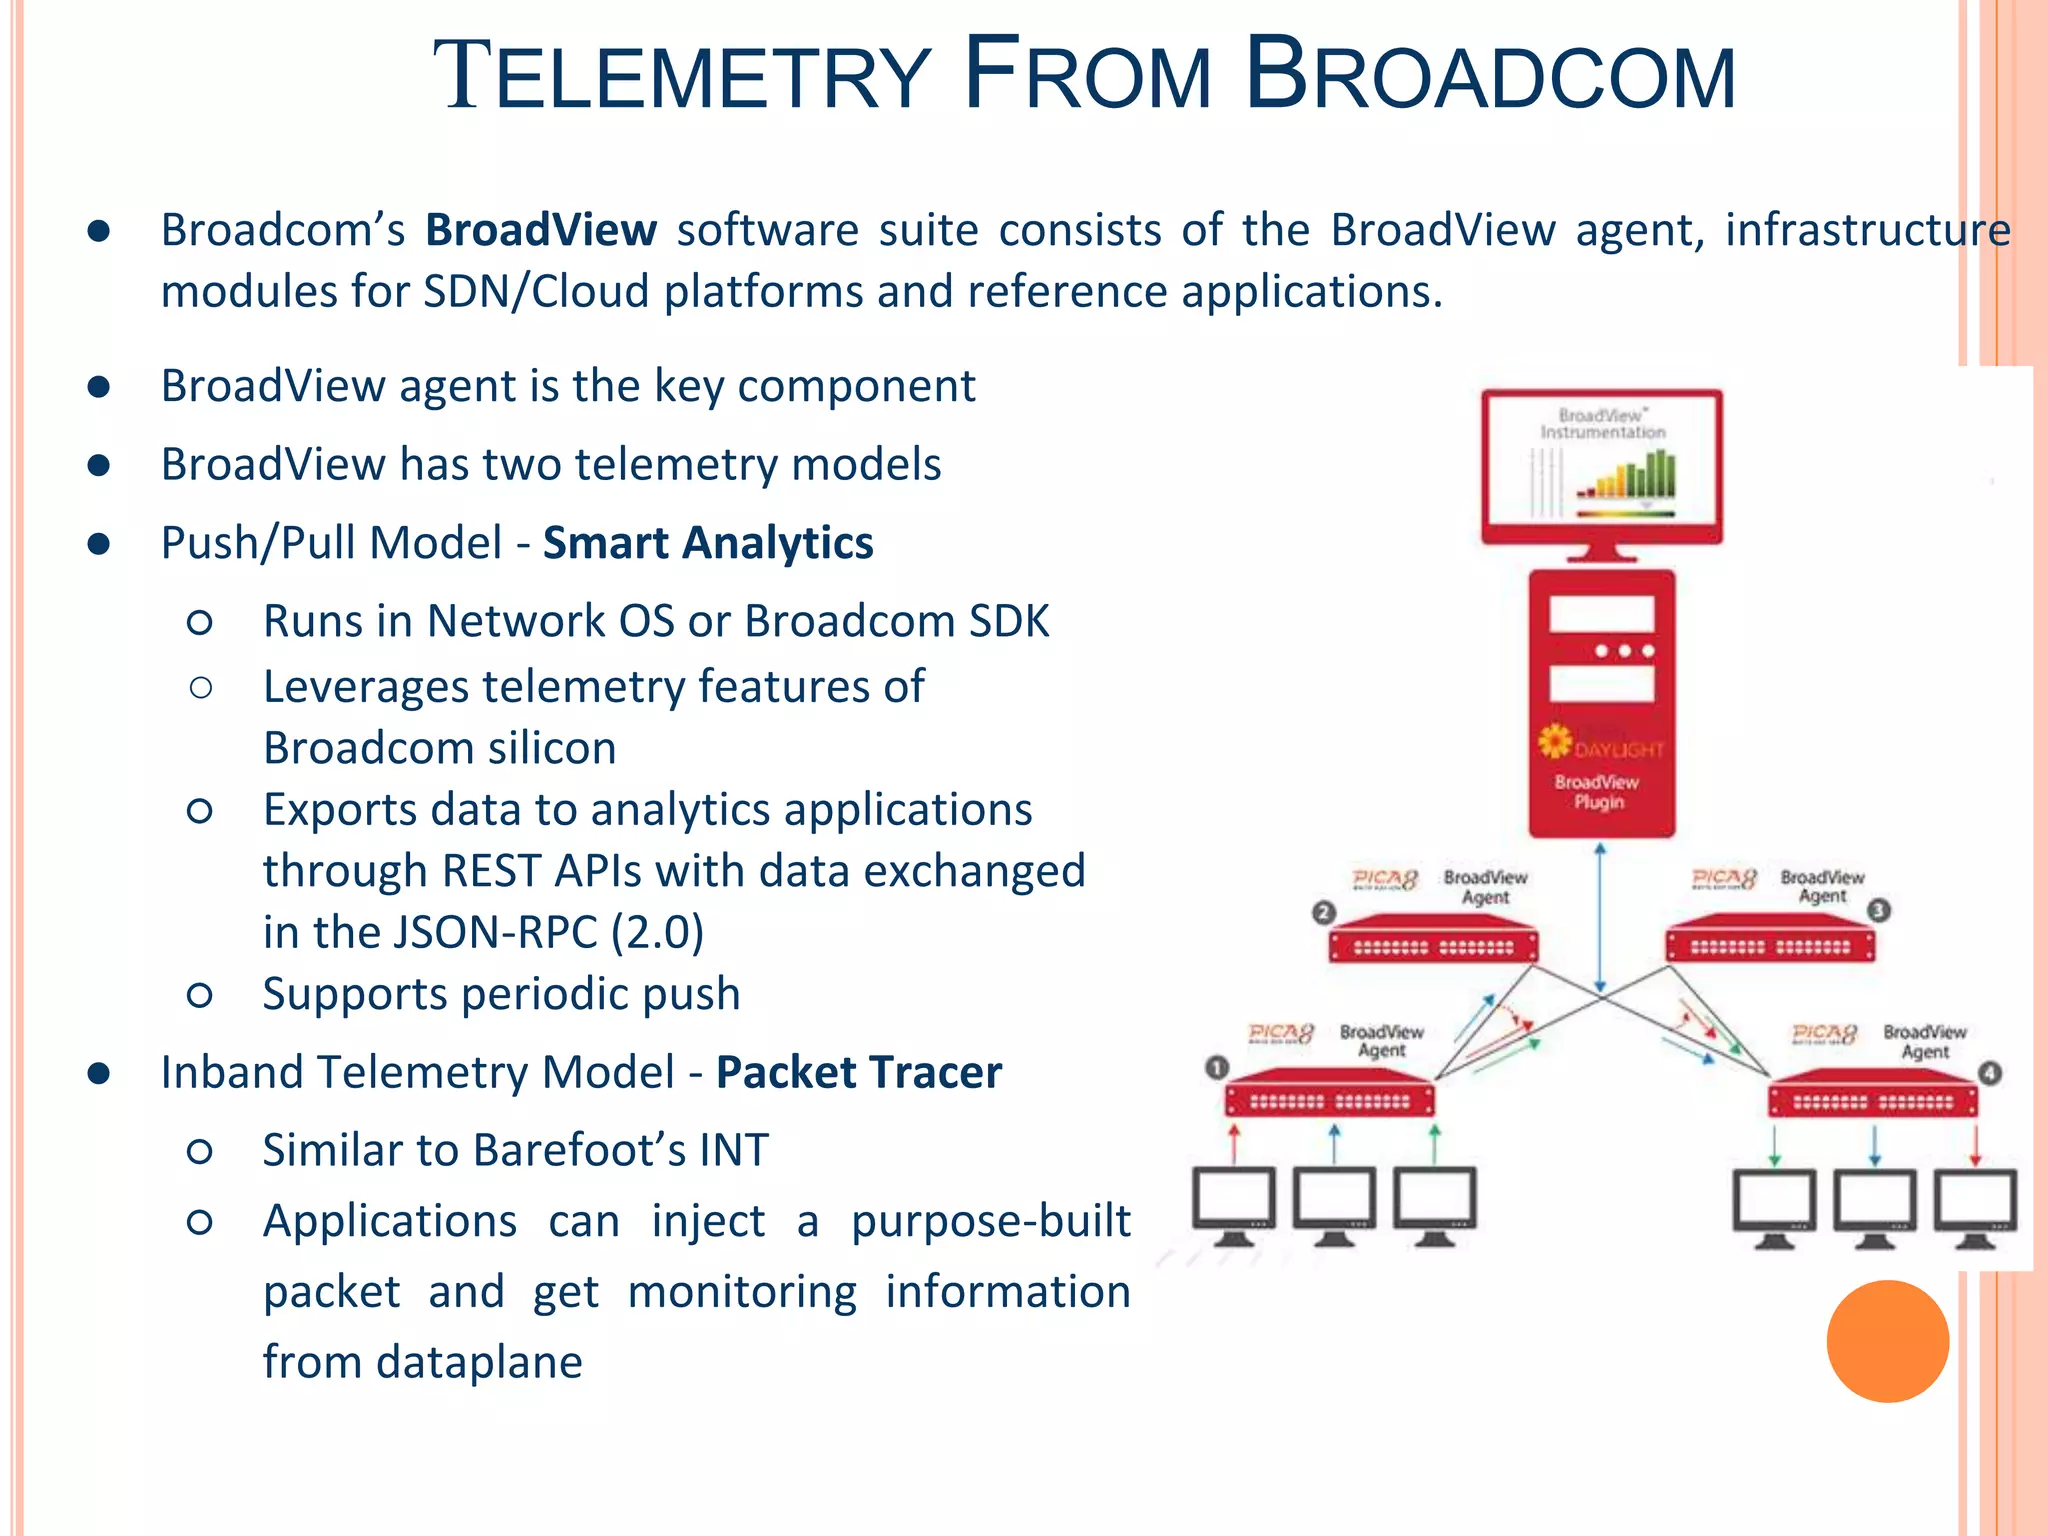
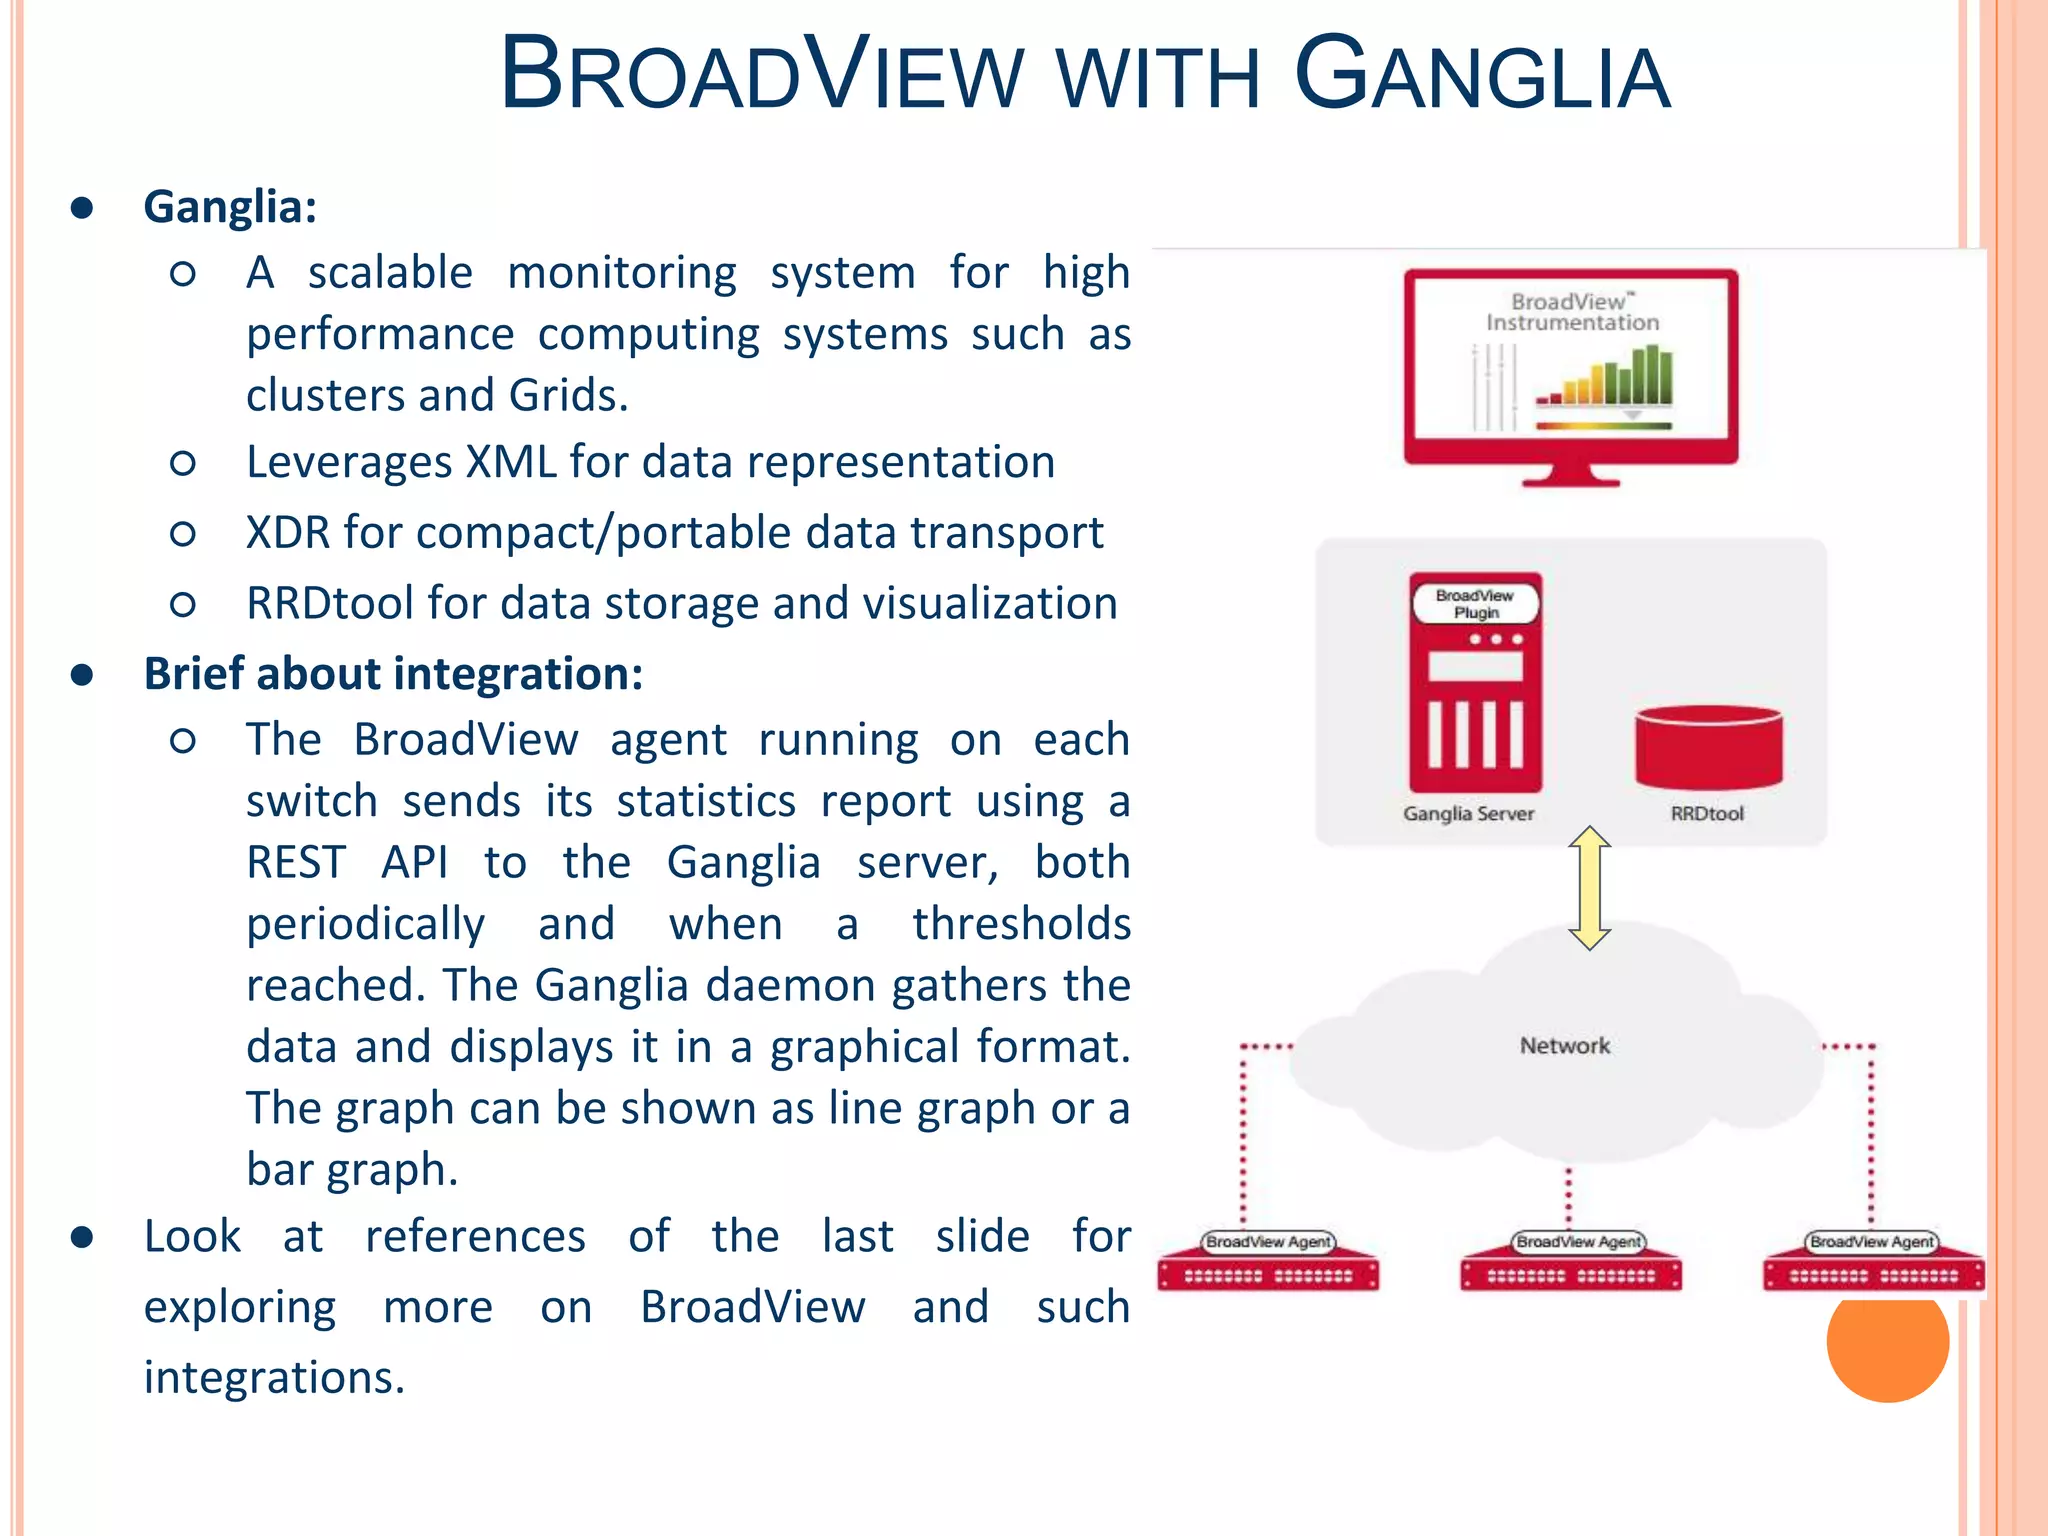


The document discusses network telemetry, detailing how data from various network devices is collected and analyzed to improve network performance and security. It outlines the challenges posed by the increasing number of devices and the need for real-time monitoring and diagnosis through telemetry systems. Key architectures and technologies from companies like Barefoot Networks, Broadcom, and Arista are also explained, highlighting their contributions to effective network data management.