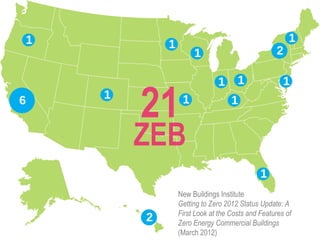
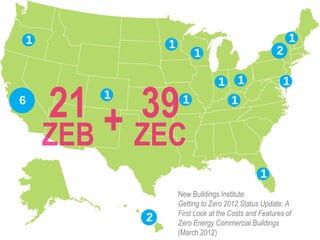
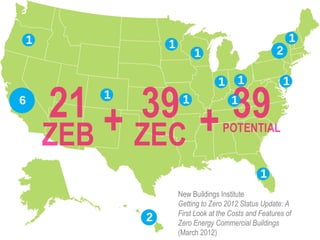
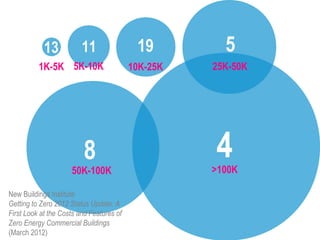
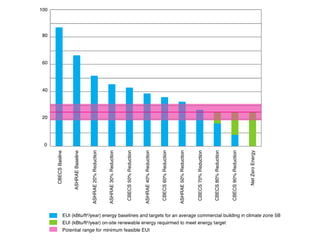
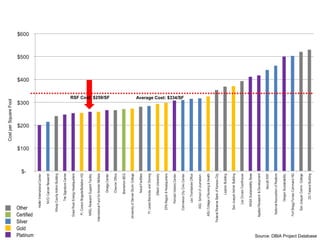
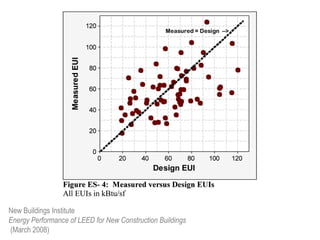
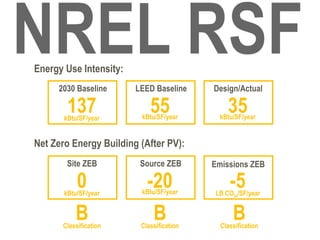
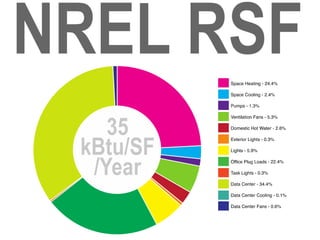
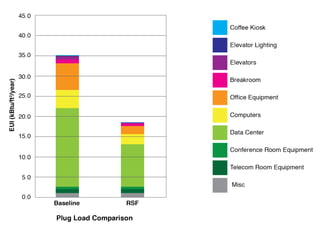
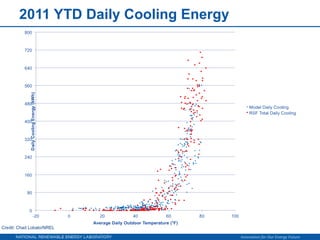
Shanti Pless, LEED AP
NREL, Commercial Buildings Research Group


Tom Hootman, AIA, LEED AP
RNL, Director of Sustainability
1                                                     1
            1
                     1                            2

                             1      1               1
6   1            1                1


                                            1
                New Buildings Institute
                Getting to Zero 2012 Status Update: A
                First Look at the Costs and Features of
        2       Zero Energy Commercial Buildings
                (March 2012)
California PUC 2030

  Massachusetts 2030

   Federal / EISA 2030

  ASHRAE Vision 2020

     2030 Challenge

Living Building Challenge
13           11                19         5
          1K-5K 5K-10K                    10K-25K   25K-50K


                         8
                     50K-100K
                                                    4
                                                    >100K

New Buildings Institute
Getting to Zero 2012 Status Update: A
First Look at the Costs and Features of
Zero Energy Commercial Buildings
(March 2012)
RSF Cost: $259/SF   Average Cost: $334/SF
Cost per Square Foot


                       Other
                       Certified
                       Silver
                       Gold
                       Platinum                                                Source: DBIA Project Database
Images courtesy of Architectural Nexus
Image
                                                  Image


Image courtesy of GSA, Beck Group and Westlake Reed Leskosky
New Buildings Institute
Energy Performance of LEED for New Construction Buildings
(March 2008)
Goal Setting

Contractual Performance

 Design for Operations

  Manage Plug Loads

     The Handoff

    Feedback Loop
I want a green building
Design a LEED <rating> building
Design a building to use 30% less
energy than ASHRAE 90.1-2004
Design a building to use less than
25,000 BTU/sqft
Design a net zero energy building
1. Mission Critical
Safety

LEED Platinum

Energy Star
2. Highly Desirable
800 staff Capacity              Flexible workspace

25kBTU/sf/year                  Support future technologies

Architectural integrity         “How to” manual

Honor future staff needs        Real-time PR” campaign

Measurable ASHRAE 90.1          Secure collaboration with outsiders

Support culture and amenities   Building information modeling

Expandable building             Substantial Completion by 2010

Ergonomics
3. If Possible
Net zero design approach
Most energy efficient building in the world
LEED Platinum Plus
ASHRAE 90.1 + 50%
Visual displays of current energy efficiency
Support public tours
National and global recognition and awards
Support personnel turnover
Predictive Modeling
    (Absolute energy target)


     VERSUS
Compliance Modeling
(Percent better than ASHRAE 90.1)
COMPETITION        DESIGN       CONSTRUCTION     OPERATIONS


CHARRETTE MODEL
            AS-DESIGNED MODEL
                LEED MODEL + BASELINE
                                  AS-BUILT MODEL
                                            OPERATIONS MODEL
Energy Use Intensity:
     2030 Baseline      LEED Baseline     Design/Actual

        137
       kBtu/SF/year
                            55
                         kBtu/SF/year
                                              35
                                            kBtu/SF/year


Net Zero Energy Building (After PV):
        Site ZEB         Source ZEB       Emissions ZEB

           0
       kBtu/SF/year
                           -20
                         kBtu/SF/year
                                               -5
                                          LB CO2e/SF/year


          B
      Classification
                             B
                         Classification
                                                B
                                            Classification
Operators      Occupants

 Executives    IT Managers


Food Service   HR Managers
First day of Net zero – June
          23, 2011
Measured Versus Modeled Monthly and Cumulative EUI


                                       Innovation for Our Energy Future
October 2010 – September 2011 Lighting Power Density


                                            Innovation for Our Energy Future
October 2010 – September 2011 Plug Load Power
Density


                               Note: The elevators are included in the plug loads
                                                   Innovation for Our Energy Future
October 2010 – September 2011 Daily Heating Energy


                                         Innovation for Our Energy Future
2011 YTD Daily Cooling Energy


                                Innovation for Our Energy Future
October 2010 – September 2011 Mechanical System
Power Density
                                     Note: Control of the VFDs was
                                     optimized in late October 2010,
                                     resulting in energy savings


                                     Note: Control of the dampers was
                                     optimized in April 2011, resulting in
                                     energy savings


                                     Note: The mechanical load is
                                     comprised of only fans and pumps
                                           Innovation for Our Energy Future
Coordinate with Commissioning

  Coordinate with O&M Plan

Plan Energy Information System

Analyze and Report Energy Data
Manage Plug and Process Loads

 Educate and Train Occupants

   Plan for Future Changes

     Celebrate Success!
SAVE A SEAT
  FOR YOUR
DESIGN-BUILD
   TEAM?
Owning zero usgbc co rmg 2012

Owning zero usgbc co rmg 2012

  • 2.
    Shanti Pless, LEEDAP NREL, Commercial Buildings Research Group Tom Hootman, AIA, LEED AP RNL, Director of Sustainability
  • 5.
    1 1 1 1 2 1 1 1 6 1 1 1 1 New Buildings Institute Getting to Zero 2012 Status Update: A First Look at the Costs and Features of 2 Zero Energy Commercial Buildings (March 2012)
  • 6.
    1 1 1 1 2 1 1 1 6 1 1 1 1 New Buildings Institute Getting to Zero 2012 Status Update: A First Look at the Costs and Features of 2 Zero Energy Commercial Buildings (March 2012)
  • 7.
    1 1 1 1 2 1 1 1 6 1 1 1 1 New Buildings Institute Getting to Zero 2012 Status Update: A First Look at the Costs and Features of 2 Zero Energy Commercial Buildings (March 2012)
  • 8.
    California PUC 2030 Massachusetts 2030 Federal / EISA 2030 ASHRAE Vision 2020 2030 Challenge Living Building Challenge
  • 9.
    13 11 19 5 1K-5K 5K-10K 10K-25K 25K-50K 8 50K-100K 4 >100K New Buildings Institute Getting to Zero 2012 Status Update: A First Look at the Costs and Features of Zero Energy Commercial Buildings (March 2012)
  • 11.
    RSF Cost: $259/SF Average Cost: $334/SF Cost per Square Foot Other Certified Silver Gold Platinum Source: DBIA Project Database
  • 16.
    Images courtesy ofArchitectural Nexus
  • 17.
    Image Image Image courtesy of GSA, Beck Group and Westlake Reed Leskosky
  • 21.
    New Buildings Institute EnergyPerformance of LEED for New Construction Buildings (March 2008)
  • 23.
    Goal Setting Contractual Performance Design for Operations Manage Plug Loads The Handoff Feedback Loop
  • 24.
    I want agreen building Design a LEED <rating> building Design a building to use 30% less energy than ASHRAE 90.1-2004 Design a building to use less than 25,000 BTU/sqft Design a net zero energy building
  • 30.
    1. Mission Critical Safety LEEDPlatinum Energy Star
  • 31.
    2. Highly Desirable 800staff Capacity Flexible workspace 25kBTU/sf/year Support future technologies Architectural integrity “How to” manual Honor future staff needs Real-time PR” campaign Measurable ASHRAE 90.1 Secure collaboration with outsiders Support culture and amenities Building information modeling Expandable building Substantial Completion by 2010 Ergonomics
  • 32.
    3. If Possible Netzero design approach Most energy efficient building in the world LEED Platinum Plus ASHRAE 90.1 + 50% Visual displays of current energy efficiency Support public tours National and global recognition and awards Support personnel turnover
  • 48.
    Predictive Modeling (Absolute energy target) VERSUS Compliance Modeling (Percent better than ASHRAE 90.1)
  • 49.
    COMPETITION DESIGN CONSTRUCTION OPERATIONS CHARRETTE MODEL AS-DESIGNED MODEL LEED MODEL + BASELINE AS-BUILT MODEL OPERATIONS MODEL
  • 50.
    Energy Use Intensity: 2030 Baseline LEED Baseline Design/Actual 137 kBtu/SF/year 55 kBtu/SF/year 35 kBtu/SF/year Net Zero Energy Building (After PV): Site ZEB Source ZEB Emissions ZEB 0 kBtu/SF/year -20 kBtu/SF/year -5 LB CO2e/SF/year B Classification B Classification B Classification
  • 60.
    Operators Occupants Executives IT Managers Food Service HR Managers
  • 63.
    First day ofNet zero – June 23, 2011
  • 65.
    Measured Versus ModeledMonthly and Cumulative EUI Innovation for Our Energy Future
  • 66.
    October 2010 –September 2011 Lighting Power Density Innovation for Our Energy Future
  • 67.
    October 2010 –September 2011 Plug Load Power Density Note: The elevators are included in the plug loads Innovation for Our Energy Future
  • 68.
    October 2010 –September 2011 Daily Heating Energy Innovation for Our Energy Future
  • 69.
    2011 YTD DailyCooling Energy Innovation for Our Energy Future
  • 70.
    October 2010 –September 2011 Mechanical System Power Density Note: Control of the VFDs was optimized in late October 2010, resulting in energy savings Note: Control of the dampers was optimized in April 2011, resulting in energy savings Note: The mechanical load is comprised of only fans and pumps Innovation for Our Energy Future
  • 71.
    Coordinate with Commissioning Coordinate with O&M Plan Plan Energy Information System Analyze and Report Energy Data
  • 72.
    Manage Plug andProcess Loads Educate and Train Occupants Plan for Future Changes Celebrate Success!
  • 73.
    SAVE A SEAT FOR YOUR DESIGN-BUILD TEAM?

Editor's Notes

  • #5 1 February 2011 NREL Case Study by RNL