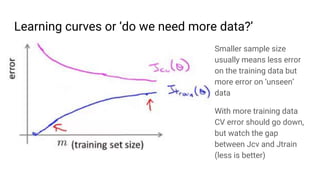
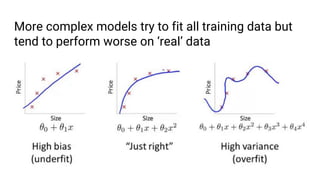
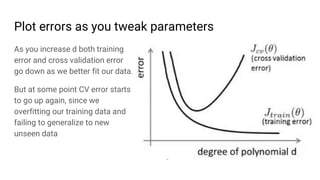
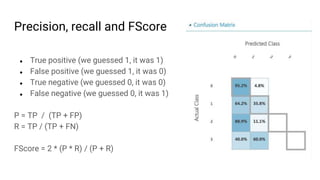
Applying Machine Learning
To classify Performance Tests results
By Igor Kochetov (@k04a)
Kiev 2017
What dog are you?
.NET developer since 2007
Python developer since 2015
Toolsmith for Unity
Technologies
Religious about good code,
software design, TDD, SOLID
Love to learn new stuff
Fun Microsoft booth at NDC Oslo 2016
In this talk
❏ Applications of machine learning and most common algorithms
❏ Using machine learning to classify performance tests results in Unity
implemented in .NET
❏ How to debug machine learning algorithms
The definition of Machine Learning (ML)
Field of study that gives computers
the ability to learn without being
explicitly programmed - Arthur Samuel (1959)
A computer program is said to learn
from experience E with respect to some
class of tasks T and performance
measure P, if its performance at tasks in
T, as measured by P, improves with
experience E. - Tom Michel (1999)
Cat or Dog?
Applications of Machine Learning
❏ Handwriting recognition
❏ Natural language processing (NLP)
❏ Computer vision (self-driving cars)
❏ Self customizing programs and User activities
monitoring
❏ Medical records
❏ Spam filters
Types of learning algorithms
➢ Supervised learning (labeled data)
○ Regression
○ Classification
○ Neural Networks
➢ Unsupervised learning (unlabeled data)
○ Clustering
○ Dimensionality reduction and PCA
○ Anomaly detection
What type of problem we have at hand?
Performance Tests - The problem we are solving
In Performance Tests we have:
● Around 120 runtime tests
● Around 500 native tests
● Which run nightly on 8 platforms:
iOS, Android, mac/win
editor/standalone, ps4, xbox
● Also about 25 editor tests for 2
platformsTotals of 5000 tests producing historical data points (performance of measured
component in ms) nightly across few major branches
Performance Tests - Classify into 1 of 4 categories
❏ Stable
❏ Unstable
❏ Progression
❏ Regression
200 inputs - Chronologically ordered set of samples from performance tests
4 outputs - Regression, progression, unstable, stable
Classifying MNIST dataset is the “Hello world” in ML
Introducing Neural Networks
Activation unit modeling a neuron
Logistic (sigmoid) function
Classification problem and Decision boundary
Classify input data into
one of two discrete
classes (yes/no, 1/0, etc)
Find the best “line”
separating negative and
positive examples (y = 1,
y = 0)
To better fit data we need more complex model
Every node receives its input from previous layer
(forward propagation)
There could be more layers
And more than one output
How do we build and train NN?
Structure:
● Define input layer (number of input nodes)
● Define output layer (number of output nodes)
● Define hidden layer (number of nodes and layers)
Training:
● Randomize the weights and apply them to the inputs (forward propagation)
● Adjust the weights guided by output error (back propagation)
Objective:
Demo
How do we know we did anything good?
To access performance of the algorithm split
training data into 3 subsets
● Training set (about 60% of your data)
● Cross validation set (20%)
● Test set (20%)
Use test set to validate % of correct answers on unseen data
Use cross validation (CV) set to fine tune your algorithm, plot errors as a function
for both Training and CV sets
Learning curves or ‘do we need more data?’
Smaller sample size
usually means less error
on the training data but
more error on ‘unseen’
data
With more training data
CV error should go down,
but watch the gap
between Jcv and Jtrain
(less is better)
More complex models try to fit all training data but
tend to perform worse on ‘real’ data
Plot errors as you tweak parameters
As you increase d both training
error and cross validation error
go down as we better fit our data.
But at some point CV error starts
to go up again, since we
overfitting our training data and
failing to generalize to new
unseen data
Is your data distributed evenly?
Precision, recall and FScore
● True positive (we guessed 1, it was 1)
● False positive (we guessed 1, it was 0)
● True negative (we guessed 0, it was 0)
● False negative (we guessed 0, it was 1)
P = TP / (TP + FP)
R = TP / (TP + FN)
FScore = 2 * (P * R) / (P + R)
Mean normalization and feature scaling
Conclusions
In order to successfully solve machine learning
problem
● Identify task at hand and figure out suitable algorithm
● Carefully select your training (and validation and testing) data
● Normalize your data
● Validate results
● Debug your model and diagnose problem instead of randomly tweaking
parameters
References
C# version developed based on AForge.NET
https://github.com/IgorKochetov/Machine-Learning-PerfTests-Classifying
http://www.aforgenet.com/framework/docs/
http://accord-framework.net/
Stanford University course on Machine Learning by prof. Andrew Ng
https://www.coursera.org/learn/machine-learning
Book by Tariq Rashid “Make Your Own Neural Network”
https://github.com/makeyourownneuralnetwork/makeyourownneuralnetwork
How to reach me
Twitter: @k04a
Linkedin: Igor Kochetov
Q & A

.NET Fest 2017. Игорь Кочетов. Классификация результатов тестирования производительности с помощью Machine Learning

  • 1.
    Applying Machine Learning Toclassify Performance Tests results By Igor Kochetov (@k04a) Kiev 2017
  • 2.
    What dog areyou? .NET developer since 2007 Python developer since 2015 Toolsmith for Unity Technologies Religious about good code, software design, TDD, SOLID Love to learn new stuff Fun Microsoft booth at NDC Oslo 2016
  • 3.
    In this talk ❏Applications of machine learning and most common algorithms ❏ Using machine learning to classify performance tests results in Unity implemented in .NET ❏ How to debug machine learning algorithms
  • 4.
    The definition ofMachine Learning (ML) Field of study that gives computers the ability to learn without being explicitly programmed - Arthur Samuel (1959) A computer program is said to learn from experience E with respect to some class of tasks T and performance measure P, if its performance at tasks in T, as measured by P, improves with experience E. - Tom Michel (1999)
  • 5.
  • 6.
    Applications of MachineLearning ❏ Handwriting recognition ❏ Natural language processing (NLP) ❏ Computer vision (self-driving cars) ❏ Self customizing programs and User activities monitoring ❏ Medical records ❏ Spam filters
  • 7.
    Types of learningalgorithms ➢ Supervised learning (labeled data) ○ Regression ○ Classification ○ Neural Networks ➢ Unsupervised learning (unlabeled data) ○ Clustering ○ Dimensionality reduction and PCA ○ Anomaly detection
  • 8.
    What type ofproblem we have at hand?
  • 9.
    Performance Tests -The problem we are solving In Performance Tests we have: ● Around 120 runtime tests ● Around 500 native tests ● Which run nightly on 8 platforms: iOS, Android, mac/win editor/standalone, ps4, xbox ● Also about 25 editor tests for 2 platformsTotals of 5000 tests producing historical data points (performance of measured component in ms) nightly across few major branches
  • 10.
    Performance Tests -Classify into 1 of 4 categories ❏ Stable ❏ Unstable ❏ Progression ❏ Regression 200 inputs - Chronologically ordered set of samples from performance tests 4 outputs - Regression, progression, unstable, stable
  • 11.
    Classifying MNIST datasetis the “Hello world” in ML
  • 12.
  • 13.
  • 14.
  • 15.
    Classification problem andDecision boundary Classify input data into one of two discrete classes (yes/no, 1/0, etc) Find the best “line” separating negative and positive examples (y = 1, y = 0)
  • 16.
    To better fitdata we need more complex model
  • 17.
    Every node receivesits input from previous layer (forward propagation)
  • 18.
    There could bemore layers
  • 19.
    And more thanone output
  • 20.
    How do webuild and train NN? Structure: ● Define input layer (number of input nodes) ● Define output layer (number of output nodes) ● Define hidden layer (number of nodes and layers) Training: ● Randomize the weights and apply them to the inputs (forward propagation) ● Adjust the weights guided by output error (back propagation) Objective:
  • 21.
  • 23.
    How do weknow we did anything good?
  • 24.
    To access performanceof the algorithm split training data into 3 subsets ● Training set (about 60% of your data) ● Cross validation set (20%) ● Test set (20%) Use test set to validate % of correct answers on unseen data Use cross validation (CV) set to fine tune your algorithm, plot errors as a function for both Training and CV sets
  • 25.
    Learning curves or‘do we need more data?’ Smaller sample size usually means less error on the training data but more error on ‘unseen’ data With more training data CV error should go down, but watch the gap between Jcv and Jtrain (less is better)
  • 26.
    More complex modelstry to fit all training data but tend to perform worse on ‘real’ data
  • 27.
    Plot errors asyou tweak parameters As you increase d both training error and cross validation error go down as we better fit our data. But at some point CV error starts to go up again, since we overfitting our training data and failing to generalize to new unseen data
  • 28.
    Is your datadistributed evenly?
  • 29.
    Precision, recall andFScore ● True positive (we guessed 1, it was 1) ● False positive (we guessed 1, it was 0) ● True negative (we guessed 0, it was 0) ● False negative (we guessed 0, it was 1) P = TP / (TP + FP) R = TP / (TP + FN) FScore = 2 * (P * R) / (P + R)
  • 30.
    Mean normalization andfeature scaling
  • 31.
  • 32.
    In order tosuccessfully solve machine learning problem ● Identify task at hand and figure out suitable algorithm ● Carefully select your training (and validation and testing) data ● Normalize your data ● Validate results ● Debug your model and diagnose problem instead of randomly tweaking parameters
  • 33.
    References C# version developedbased on AForge.NET https://github.com/IgorKochetov/Machine-Learning-PerfTests-Classifying http://www.aforgenet.com/framework/docs/ http://accord-framework.net/ Stanford University course on Machine Learning by prof. Andrew Ng https://www.coursera.org/learn/machine-learning Book by Tariq Rashid “Make Your Own Neural Network” https://github.com/makeyourownneuralnetwork/makeyourownneuralnetwork
  • 34.
    How to reachme Twitter: @k04a Linkedin: Igor Kochetov
  • 35.

Editor's Notes

  • #5 Instead of programming some rules we feed training data (learning examples) into algorithm and access results
  • #7 Web data (click-stream or click through data) Mine to understand users better Huge segment of silicon valley Self customizing programs Netflix Amazon iTunes genius Take users info Learn based on your behavior Next - types of learning tasks
  • #8 Unsupervised - unlabeled data. Given the data find patterns and structure in the data Anomaly Detection (Fraud detection, Manufacturing, DataCenter monitoring) Anomaly detection vs. supervised learning: very small number of positive examples Content based recommendation and Collaborative filtering (if we have a set of features for movie rating you can learn a user's preferences, and vice versa, If you have your users preferences you can therefore determine a film's features) More examples: cocktail party algorithm More details on Recommender Systems: Recommender systems typically produce a list of recommendations in one of two ways – through collaborative and content-based filtering or the personality-based approach.[7] Collaborative filtering approaches build a model from a user's past behaviour (items previously purchased or selected and/or numerical ratings given to those items) as well as similar decisions made by other users. This model is then used to predict items (or ratings for items) that the user may have an interest in.[8] Content-based filtering approaches utilize a series of discrete characteristics of an item in order to recommend additional items with similar properties.[9] These approaches are often combined (see Hybrid Recommender Systems).
  • #10 Each test run provides us with decimal value as a result: milliseconds needed to complete. So we have a historic data for every measured feature and what to know if it increases, decreases, stays the same or jumps all around.
  • #11 Our problem could be modeled as Handwriting recognition one
  • #12 Every image is just an array of numbers Which we feed into an algorithm (i.e. input) And the output is one of 10 digits Which brings us back to our problem:
  • #13 Brain Does loads of crazy things Hypothesis is that the brain has a single learning algorithm Neuron: Three things to notice Cell body Number of input wires (dendrites) Output wire (axon) Simple level Neuron gets one or more inputs through dendrites Does processing Sends output down axon
  • #14 a neuron is a logistic unit That logistic computation is just like logistic regression hypothesis calculation X vector is our input (X0 is a constant, known as bias) Ɵ vector is our parameters which may also be called the weights of a model (that’s what we want to learn)
  • #15 This is the sigmoid function, or the logistic function Crosses 0.5 at the origin, then flattens out, Asymptotes at 0 and 1 Which gives us DECISION BOUNDARY When using linear regression we did hθ(x) = (θT x) For classification hypothesis representation we do hθ(x) = g((θT x)) Where we define g(z) z is a real number g(z) = 1/(1 + e-z)
  • #16 It could be more than a line, actually
  • #17 In order to achieve that we can apply higher order polynomial or use NN
  • #18 First layer is the input layer Final layer is the output layer - produces value computed by a hypothesis Middle layer(s) are called the hidden layers ai(j) - activation of unit i in layer j Ɵ(j) - matrix of parameters controlling the function mapping from layer j to layer j + 1 Every input/activation goes to every node in following layer
  • #19 NN is a logistic regression at scale Neural networks learning its own features!!!!! ai(j) - activation of unit i in layer j Ɵ(j) - matrix of parameters controlling the function mapping from layer j to layer j + 1 Every input/activation goes to every node in following layer Next - multiclass
  • #20  Recognizing stable, unstable, regression or progression Build a neural network with four output units Output a vector of four numbers 1 is 0/1 stable 2 is 0/1 unstable 3 is 0/1 regression 4 is 0/1 progression
  • #21 Inputs = features Outputs = number of classification categories Flip back to explain forward and back propagation
  • #23 We will use AForge.NET library. We have to prepare Inputs and Outputs, choose Activation function and Network Structure (number of nodes, layers) And train the network until error is small enough
  • #24 Having single value to measure performance of the algorithm is really important So the first step is to compare labeled inputs with algorithm outputs and calculate %% of correct results
  • #26 Jtrain Error on smaller sample sizes is smaller (as less variance to accommodate) So as m grows error grows Jcv Error on cross validation set When you have a tiny training set your generalize badly But as training set grows your hypothesis generalize better So cv error will decrease as m increases High bias e.g. setting straight line to data Jtrain Training error is small at first and grows Training error becomes close to cross validation So the performance of the cross validation and training set end up being similar (but very poor) Jcv Straight line fit is similar for a few vs. a lot of data So it doesn't generalize any better with lots of data because the function just doesn't fit the data The problem with high bias is because cross validation and training error are both high Also implies that if a learning algorithm as high bias as we get more examples the cross validation error doesn't decrease So if an algorithm is already suffering from high bias, more data does not help High variance e.g. high order polynomial Jtrain When set is small, training error is small too As training set sizes increases, value is still small But slowly increases (in a near linear fashion) Error is still low Jcv Error remains high, even when you have a moderate number of examples Because the problem with high variance (overfitting) is your model doesn't generalize An indicative diagnostic that you have high variance is that there's a big gap between training error and cross validation error If a learning algorithm is suffering from high variance, more data is probably going to help
  • #27 Applying higher order polynomial (or complex NN)
  • #30 Precision How often does our algorithm cause a false alarm? Of all patients we predicted have cancer, what fraction of them actually have cancer = true positives / # predicted positive = true positives / (true positive + false positive) High precision is good (i.e. closer to 1) You want a big number, because you want false positive to be as close to 0 as possible Recall How sensitive is our algorithm? Of all patients in set that actually have cancer, what fraction did we correctly detect = true positives / # actual positives = true positive / (true positive + false negative) High recall is good (i.e. closer to 1) You want a big number, because you want false negative to be as close to 0 as possible F1Score (fscore) = 2 * (PR/ [P + R]) Fscore is like taking the average of precision and recall giving a higher weight to the lower value Many formulas for computing comparable precision/accuracy values If P = 0 or R = 0 the Fscore = 0 If P = 1 and R = 1 then Fscore = 1 The remaining values lie between 0 and 1
  • #31 Find average value (mean) and subtract and, then divide by the range (st deviation)
  • #33 Don’t be afraid to try, even small projects could be fun and useful