Downloaded 17 times
![INTRODUCTION
Over the past few years, video streaming
traffic has beengrowing at a rapid pace, and
is anticipated to dominate
nextgenerationnetworks. According to [1]
global consumption of Internet video viewed
through a TV doubled in 2012; video-on-
demand traffic is projected to nearly triple by
2017. Cableoperators, are seeking novel
solutions to fend off the
impendingbandwidth crunch introduced by
video traffic on their existingnetwork
infrastructure.
Additionally, the cable industry is on the
cusp of a migration to IP video. Various
factors are contributing to the desire to
migrate. One of the biggest drivers is the
desire to deliver any content to subscribers,
anywhere and anytime they want it. This
includes the ability to deliver content to
consumer owned devices such as tablets,
smartphones, PCs, laptops, game consoles
and Internet enabled TVs. Delivering video
to such consumer owned devices not only
helps cable operators to meet subscribers’
needs and expectations but has the added
benefit that operators do not have to incur
capital expenditure to deploy and maintain
these devices. STBs deployed in subscribers’
homes are a significant portion of the capex
budget in offering video services. Reducing
that expenditure by either leveraging
consumer owned devices or lower cost IP
STBs could helpoperators to improve
theirbottom-line significantly. Additionally,
operators may be able to charge fees for
making services available on new outlets
such as tablets. So overall IP video provides
an opportunity to both improve top-line and
bottom-line for operators.
Additionally with IP video, operators may be
able to leverage the rapid innovation in the
Internet space to offer newer services, and a
better user experience. It also enables
operators to consolidate the video services
infrastructure.
One of the major challenges faced by
operators as they make this migration to IP
video is the bandwidth required to deliver
this service and the capex requirements
associated with it. As shown in [2] the
bandwidth needs for IP video are highly
dependent on the type of service offered and
can range typically from 20-40 downstream
channels to serve a typical Service Group of
250-300 subscribers. The increasing focus on
Cloud DVR like technology will in fact lead
to higher capacity requirements due to the
unicast nature of the delivery method. Hence
there is likely to be significant increasing
amounts of Adaptive Bit Rate video on the
cable network in the future and operators will
need better ways to manage it.
SOFTWARE DEFINED NETWORKING
Software Defined Networking (SDN) is a
term that began being used widely in the
industry around 2009. SDN is defined as the
separation of Control and Data planes using
an open standard protocol to communicate
between them. This differs from a traditional
network device (such as a Router, Switch, or
CMTS) in which the data and control planes
are vertically integrated. SDN promises
flexibility and rapid innovation by virtue of
the fact that the control software would be
removed from the relatively constrained
network device to a generic server that can
be easily scaled to have more processing and
memory capabilities.
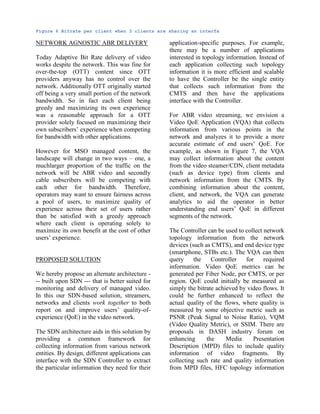
SDN is typically implemented with a
Controller based architecture as shown in
Figure 1, where the Controller interfaces
with network devices via standard interfaces
(for exampleOpenflow [7], PCMM).
Therefore, the controller presents a level of
abstraction of the underlying network.](https://image.slidesharecdn.com/nctaabrqoepaper04-01-2014-140501160618-phpapp01/85/An-SDN-Based-Approach-To-Measuring-And-Optimizing-ABR-Video-Quality-Of-Experience-2-320.jpg)
![Applications communicate with the
controller using “controller APIs” and the
controller in turn interacts with the
network.In other words the controller acts as
middleware that provides a higher lever of
abstraction to network application
developers.
Figure 1 SDN Architecture
Another key attribute of SDN is the two-way
communication with the network devices.
The network can be thought of as a large
distributed database of flows and states. In an
SDN architecture, applications can learn
from the Controller the state of various
devices and can also program the devices via
the Controller. An SDN-based architecture
enables Applications to be developed in a
relatively device-agnostic way.
ADAPTIVE BITRATE STREAMING
Recent years have seen a major technology
shift as Internet video delivery solutions are
converging towards the adaptive bit rate
(ABR) streaming paradigm. Since its
inception in 2007 by Move Networks [3],
ABR has been quickly adopted by major
vendors and service providers, including
YouTube, Netflix, Hulu, Akamai, Microsoft
Smooth Streaming [4], Apple HTTP Live
Streaming (HLS) [5], and Adobe HTTP
Dynamic Streaming (HDS).
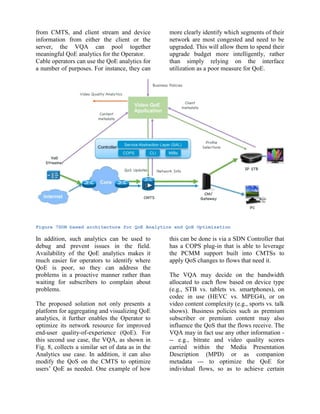
Figure 1 shows the architecture overview of
an adaptive bitrate streaming (ABR) system.
The media contents are either pre-stored or
captured live at the source. Multiple quality
versions of the same video content are
generated via transcoding. Moreover, each
media file is broken down into many small
fragments. The origin HTTP server keeps
track of these fragments either as a large
collection of separate physical files (e.g., in
Apple HLS), or as logical separations via
indexing (e.g., in Microsoft Smooth
Streaming). Additional content delivery](https://image.slidesharecdn.com/nctaabrqoepaper04-01-2014-140501160618-phpapp01/85/An-SDN-Based-Approach-To-Measuring-And-Optimizing-ABR-Video-Quality-Of-Experience-3-320.jpg)
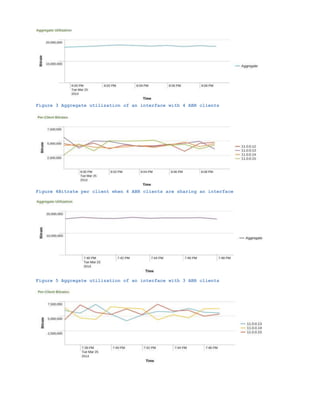
![Figure 2Architecture overview of an adaptive bitrate streaming (ABR) system. Multiple quality versions of the same
video content are generated via transcoding or parallel live encoding. Each media file is broken down into many physical or
logical fragments. The client can adaptively request different quality versions of the media fragments based on its own
estimate of available network bandwidth
networks (CDNs) may also be leveraged at
the edge of the network, so as to assist in
disseminating video contents to awide range
of end users.
In ABR, the client can dynamically change
its video rate and quality on a fragment by
fragment basis. In face of temporary network
congestion, the client can switch to a lower
rate (and hence quality) version of the video
to avoid buffer underflow; when connection
speed recovers, the client can switch back to
higher quality. Such flexibility in rate
adaptation can be advantageous in the
presence of dynamic network conditions,
especially in mobile environments. In 2012,
the Motion Picture Experts Group (MPEG)
has joined forces with 3GPP (3rd Generation
Partnership Project) in defining the recently
standardized Dynamic Adaptive Streaming
over HTTP (DASH) specifications [6].The
MPEG-DASH standard has intentionally left
out of its scope the definition of client
behavior for content fetching, rate adaptation
heuristics, and video playout, thereby
allowing plenty of space for innovation-
based competition in industry.
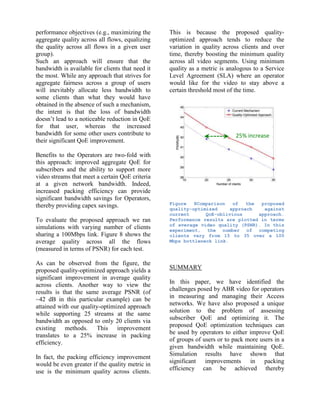
QoE MEASUREMENTS
Today most operators measure the quality-of-
experience (QoE) of their subscribers in
terms of network utilization levels. Network
utilization is typically averaged across over
few minutes (typically 5~15 mins). Such
average utilization is measured throughout
the day. Most operators consider their
networks to be congested if utilization
exceeds a certain threshold such as 70-80%
during peak hours.
If many such measured samples of utilization
level exceed their pre-determined threshold,
operators typically declare those interfaces to
be congested and plan upgrades of their
network to address the congestion. The
advantage of such a QoE measurement is it is](https://image.slidesharecdn.com/nctaabrqoepaper04-01-2014-140501160618-phpapp01/85/An-SDN-Based-Approach-To-Measuring-And-Optimizing-ABR-Video-Quality-Of-Experience-4-320.jpg)

The document discusses an SDN-based approach aimed at improving the measurement and optimization of adaptive bitrate (ABR) video quality for cable operators as they migrate to IP video services. It highlights the challenges posed by increasing video traffic and varying user quality of experience (QoE) across network segments, emphasizing the need for better tools to analyze and enhance QoE. The proposed architecture utilizes software-defined networking to provide more insights into user experiences and facilitate optimal network resource allocation to improve overall video delivery quality.


![[Streamroot] Whitepaper peer assisted adaptive streaming](https://cdn.slidesharecdn.com/ss_thumbnails/streamroot-whitepaper-peer-assisted-adaptive-streaming-160327215724-thumbnail.jpg?width=640&height=640&fit=bounds)


![[Whitepaper] Cisco Vision: 5G - THRIVING INDOORS](https://cdn.slidesharecdn.com/ss_thumbnails/5granindoorv6final2-170215173927-thumbnail.jpg?width=640&height=640&fit=bounds)

![[Infographic] Cisco Visual Networking Index (VNI): Mobile-Connected Devices p...](https://cdn.slidesharecdn.com/ss_thumbnails/mobile-connecteddevicespercapita-160202160317-thumbnail.jpg?width=640&height=640&fit=bounds)
![[Infographic] Cisco Visual Networking Index (VNI): Mobile Users Growth](https://cdn.slidesharecdn.com/ss_thumbnails/mobileusersgrowth-160202160305-thumbnail.jpg?width=640&height=640&fit=bounds)


