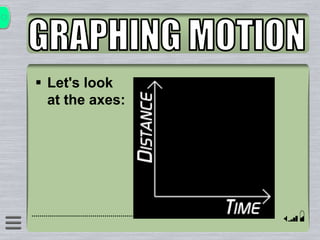
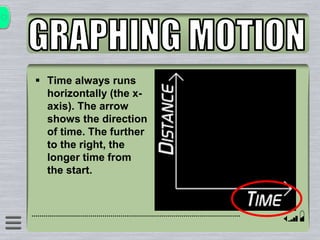
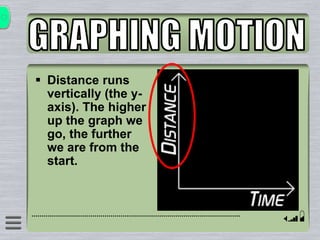
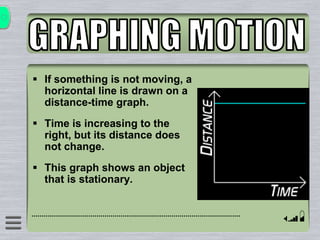
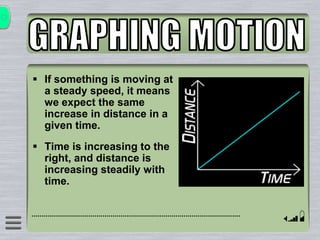
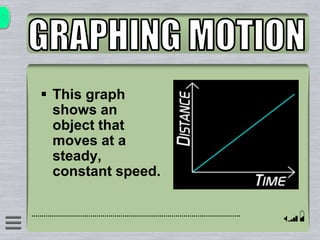
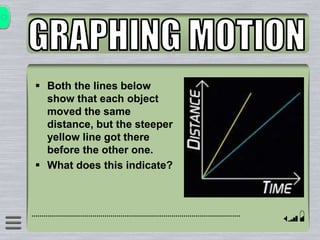
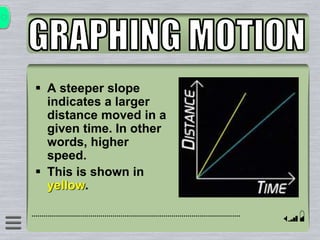
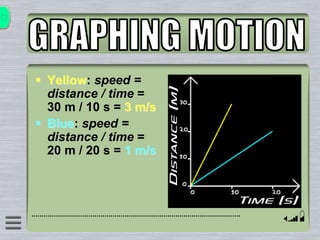
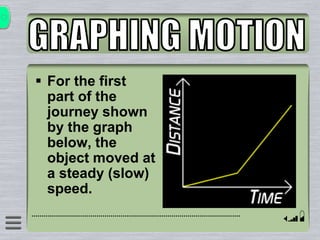
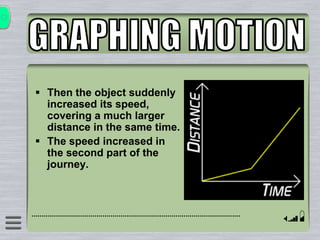
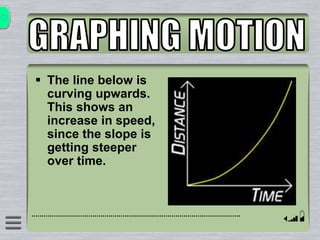
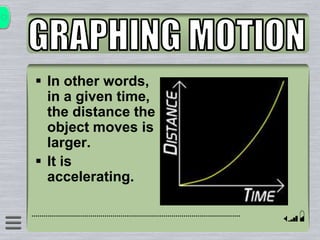
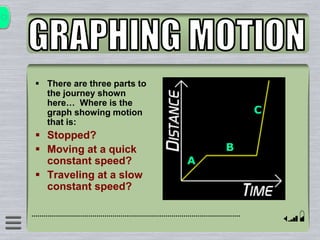
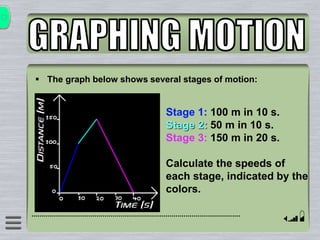
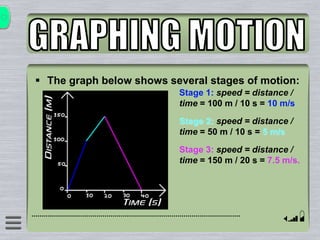
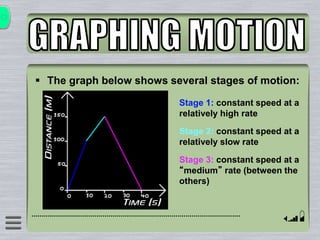
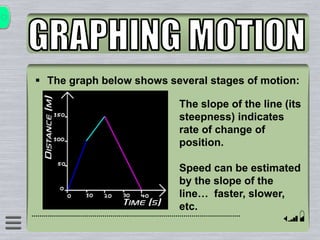
Distance vs. Time
 Describing a journey made by
an object is very boring if you
just use words. As with much
of science, graphs are more
revealing.
 Plotting distance against time
can tell you a lot about a
journey.
 Let's look
at the axes:
 Time always runs
horizontally (the x-
axis). The arrow
shows the direction
of time. The further
to the right, the
longer time from
the start.
 Distance runs
vertically (the y-
axis). The higher
up the graph we
go, the further
we are from the
start.
 If something is not moving, a
horizontal line is drawn on a
distance-time graph.
 Time is increasing to the
right, but its distance does
not change.
 This graph shows an object
that is stationary.
 If something is moving at
a steady speed, it means
we expect the same
increase in distance in a
given time.
 Time is increasing to the
right, and distance is
increasing steadily with
time.
 This graph
shows an
object that
moves at a
steady,
constant speed.
 Both the lines below
show that each object
moved the same
distance, but the steeper
yellow line got there
before the other one.
 What does this indicate?
 A steeper slope
indicates a larger
distance moved in a
given time. In other
words, higher
speed.
 This is shown in
yellow.
 Yellow: speed =
distance / time =
30 m / 10 s = 3 m/s
 Blue: speed =
distance / time =
20 m / 20 s = 1 m/s
 For the first
part of the
journey shown
by the graph
below, the
object moved at
a steady (slow)
speed.
 Then the object suddenly
increased its speed,
covering a much larger
distance in the same time.
 The speed increased in
the second part of the
journey.
 The line below is
curving upwards.
This shows an
increase in speed,
since the slope is
getting steeper
over time.
 In other words,
in a given time,
the distance the
object moves is
larger.
 It is
accelerating.
 There are three parts to
the journey shown
here… Where is the
graph showing motion
that is:
 Stopped?
 Moving at a quick
constant speed?
 Traveling at a slow
constant speed?
A
B
C
 The graph below shows several stages of motion:
Stage 1: 100 m in 10 s.
Stage 2: 50 m in 10 s.
Stage 3: 150 m in 20 s.
Calculate the speeds of
each stage, indicated by the
colors.
 The graph below shows several stages of motion:
Stage 1: speed = distance /
time = 100 m / 10 s = 10 m/s
Stage 2: speed = distance /
time = 50 m / 10 s = 5 m/s
Stage 3: speed = distance /
time = 150 m / 20 s = 7.5 m/s.
 The graph below shows several stages of motion:
Stage 1: constant speed at a
relatively high rate
Stage 2: constant speed at a
relatively slow rate
Stage 3: constant speed at a
“medium” rate (between the
others)
 The graph below shows several stages of motion:
The slope of the line (its
steepness) indicates
rate of change of
position.
Speed can be estimated
by the slope of the
line… faster, slower,
etc.
 Distance vs. time graphs also indicate the
position of the object.
Stage 1 & Stage 2: object is
moving away from the starting
point
Stage 3: object is moving back
toward the starting point (it
comes back to zero)
 The steeper the line on a distance vs.
time graph, the faster the object’s
speed.
 A curved line indicates a change in
speed (accelerating or decelerating).
 Lines pointing up indicate moving
away from the starting location.
 Lines pointing down indicate moving
back towards the starting location.
 Let’s see how much this makes
sense to you…
 This is not for a grade, just to let me
know how much of this and what
parts of it you “get.”
 To learn about speed vs. time
graphs, visit this link:
http://www.gcse.com/fm/stg.htm

graphing motion.ppt

  • 1.
  • 2.
     Describing ajourney made by an object is very boring if you just use words. As with much of science, graphs are more revealing.  Plotting distance against time can tell you a lot about a journey.
  • 3.
  • 4.
     Time alwaysruns horizontally (the x- axis). The arrow shows the direction of time. The further to the right, the longer time from the start.
  • 5.
     Distance runs vertically(the y- axis). The higher up the graph we go, the further we are from the start.
  • 6.
     If somethingis not moving, a horizontal line is drawn on a distance-time graph.  Time is increasing to the right, but its distance does not change.  This graph shows an object that is stationary.
  • 7.
     If somethingis moving at a steady speed, it means we expect the same increase in distance in a given time.  Time is increasing to the right, and distance is increasing steadily with time.
  • 8.
     This graph showsan object that moves at a steady, constant speed.
  • 9.
     Both thelines below show that each object moved the same distance, but the steeper yellow line got there before the other one.  What does this indicate?
  • 10.
     A steeperslope indicates a larger distance moved in a given time. In other words, higher speed.  This is shown in yellow.
  • 11.
     Yellow: speed= distance / time = 30 m / 10 s = 3 m/s  Blue: speed = distance / time = 20 m / 20 s = 1 m/s
  • 12.
     For thefirst part of the journey shown by the graph below, the object moved at a steady (slow) speed.
  • 13.
     Then theobject suddenly increased its speed, covering a much larger distance in the same time.  The speed increased in the second part of the journey.
  • 14.
     The linebelow is curving upwards. This shows an increase in speed, since the slope is getting steeper over time.
  • 15.
     In otherwords, in a given time, the distance the object moves is larger.  It is accelerating.
  • 16.
     There arethree parts to the journey shown here… Where is the graph showing motion that is:  Stopped?  Moving at a quick constant speed?  Traveling at a slow constant speed? A B C
  • 17.
     The graphbelow shows several stages of motion: Stage 1: 100 m in 10 s. Stage 2: 50 m in 10 s. Stage 3: 150 m in 20 s. Calculate the speeds of each stage, indicated by the colors.
  • 18.
     The graphbelow shows several stages of motion: Stage 1: speed = distance / time = 100 m / 10 s = 10 m/s Stage 2: speed = distance / time = 50 m / 10 s = 5 m/s Stage 3: speed = distance / time = 150 m / 20 s = 7.5 m/s.
  • 19.
     The graphbelow shows several stages of motion: Stage 1: constant speed at a relatively high rate Stage 2: constant speed at a relatively slow rate Stage 3: constant speed at a “medium” rate (between the others)
  • 20.
     The graphbelow shows several stages of motion: The slope of the line (its steepness) indicates rate of change of position. Speed can be estimated by the slope of the line… faster, slower, etc.
  • 21.
     Distance vs.time graphs also indicate the position of the object. Stage 1 & Stage 2: object is moving away from the starting point Stage 3: object is moving back toward the starting point (it comes back to zero)
  • 22.
     The steeperthe line on a distance vs. time graph, the faster the object’s speed.  A curved line indicates a change in speed (accelerating or decelerating).
  • 23.
     Lines pointingup indicate moving away from the starting location.  Lines pointing down indicate moving back towards the starting location.
  • 24.
     Let’s seehow much this makes sense to you…  This is not for a grade, just to let me know how much of this and what parts of it you “get.”
  • 25.
     To learnabout speed vs. time graphs, visit this link: http://www.gcse.com/fm/stg.htm