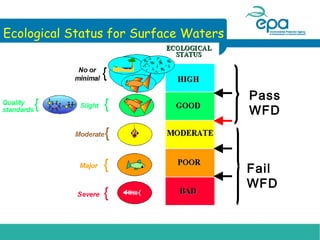
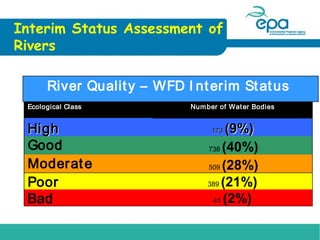
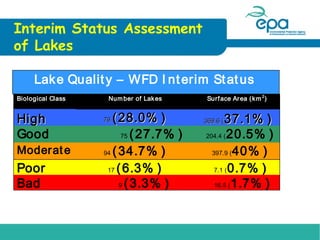
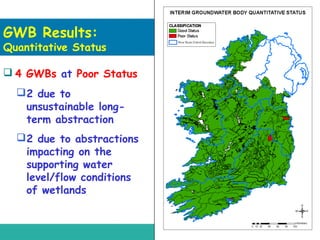
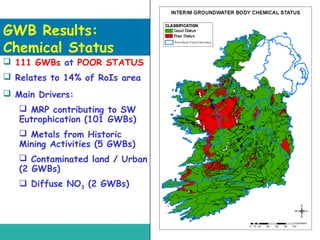
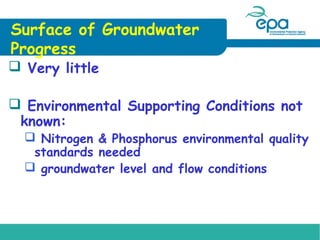
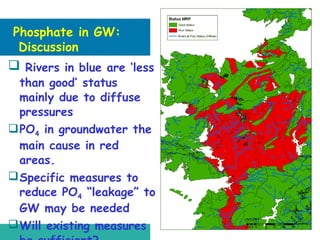
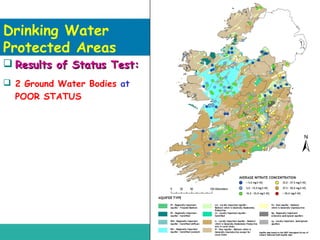
1) The document discusses the status of surface water and groundwater in Ireland according to the Water Framework Directive. It provides interim status assessments showing the percentage of water bodies with high, good, moderate, poor, or bad ecological status.
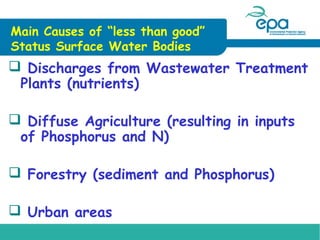
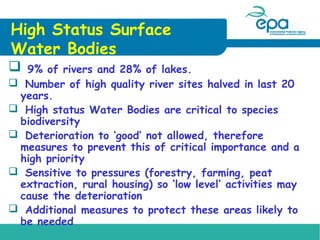
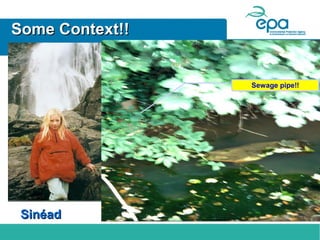
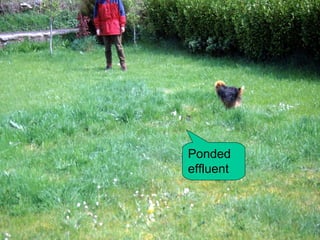
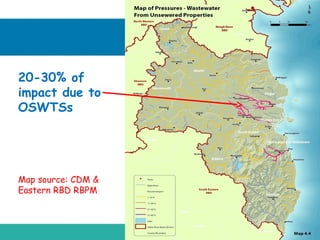
2) Wastewater treatment plants, agriculture, forestry, and urban areas are cited as the main causes of surface water bodies having "less than good" status. For groundwater, agriculture is contributing to poor chemical status in many areas.
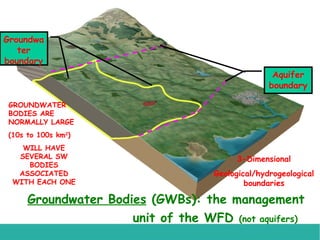
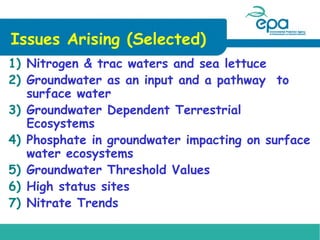
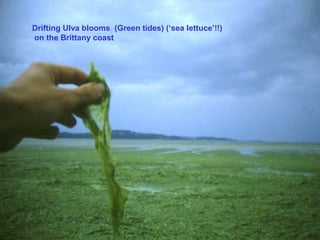
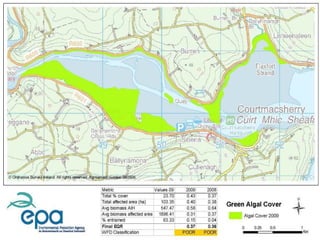
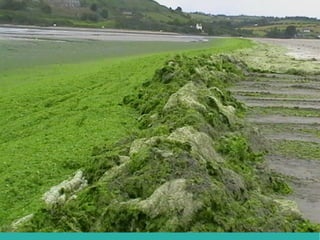
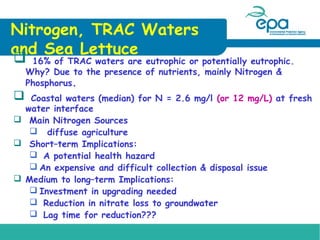
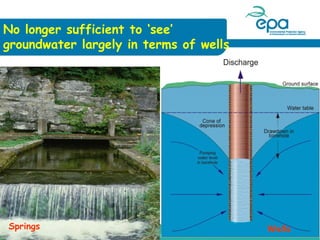
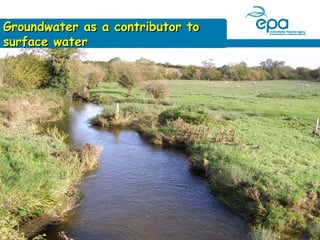
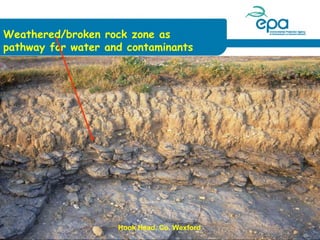
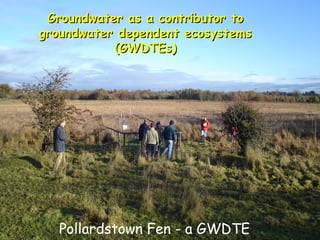
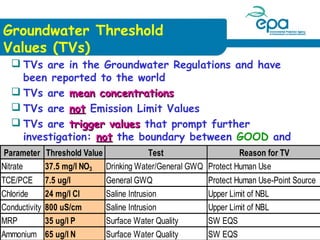
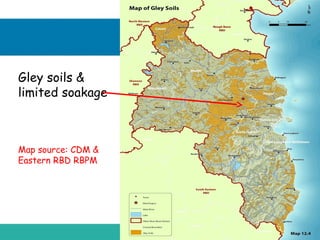
3) Key issues discussed include nitrogen and phosphates in water impacting seaweed blooms, groundwater as both an input to and pathway for surface waters, and groundwater-dependent ecosystems.


![Final poster[1]](https://cdn.slidesharecdn.com/ss_thumbnails/finalposter1-110329065240-phpapp01-thumbnail.jpg?width=640&height=640&fit=bounds)


