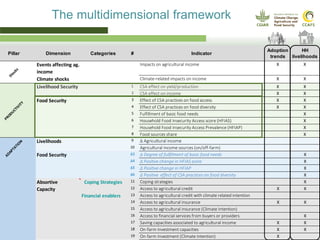
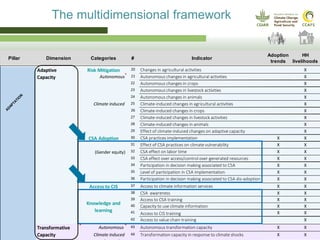
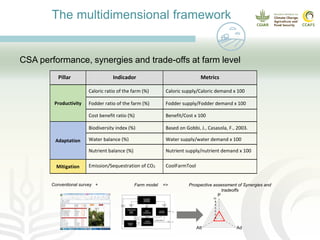
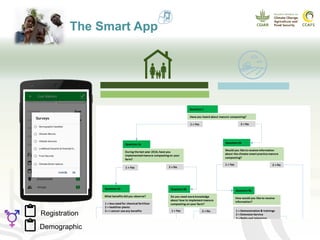
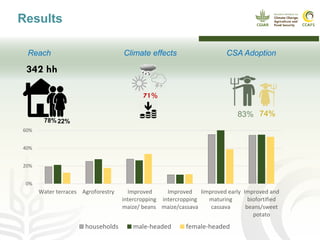
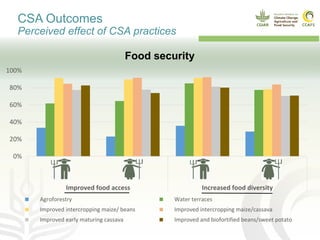
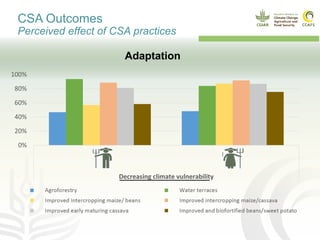
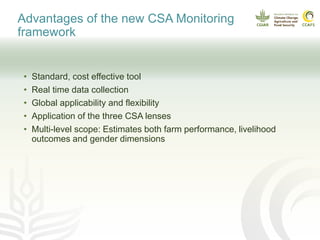
Osana Bonilla-Findji, Anton Eitzinger, Nadine Andrieu, Ivonne Acosta, Ngoni Chirinda,
Maria Alejandra Garcia, Jennifer Twyman, Andy Jarvis.
CGIAR Research Program on Climate Change, Agriculture and Food Security
Monitoring CSA outcomes
Understanding adoption, synergies and tradeoffs
at farm and household level
FAO CSA metrics workshop, March 14th 2019
AR4D Climate-smart village network
Integrated framework to
monitor CSA in the field
Associated set of standard indicators + rapid and
reliable ICT-based data collection instrument to
systematically assess and monitor:
CSA Adoption
(community level) CSA effects on Food
security and livelihoods
(household level)
CSA effects on
Farm performance
1 2
3
The multidimensional framework
Pillar Dimension Categories # Indicator
Adoption
trends
HH
livelihoods
Events affecting ag.
income
Impacts on agricultural income X X
Climate shocks Climate-related impacts on income X X
Shocks
Livelihood Security 1 CSA effect on yield/production X X
2 CSA effect on income X X
Food Security 3 Effect of CSA practices on food access X X
4 Effect of CSA practices on food diversity X X
5 Fulfillment of basic food needs X
6 Household Food Insecurity Access score (HFIAS) X
7 Household Food Insecurity Access Prevalence (HFIAP) X
8 Food sources share X
PRODUCTIVITY
Livelihoods 9 Δ Agricultural income
10 Agricultural income sources (on/off-farm)
Food Security Δ3 Δ Degree of fullfilment of basic food needs X
Δ4 Δ Positive change in HFIAS score X
Δ5 Δ Positive change in HFIAP X
Δ6 Δ Positive effect of CSA practices on food diversity X
11 Coping strategies X
12 Access to agricultural credit X X
Financial enablers 13 Access to agricultural credit with climate related intention
14 Access to agricultural insurance X X
15 Access to agricultural insurance (Climate Intention)
16 Access to financial services from buyers or providers X
17 Saving capacities associated to agricultural income X X
18 On-farm Investment capacities X X
19 On-farm Investment (Climate intention) X
Absortive
Capacity
Coping Strategies
ADAPTATION
Pillar Dimension Categories # Indicator
Adoption
trends
HH
livelihoods
Events affecting ag.
income
Impacts on agricultural income X X
Climate shocks Climate-related impacts on income X X
Shocks
Livelihood Security 1 CSA effect on yield/production X X
2 CSA effect on income X X
Food Security 3 Effect of CSA practices on food access X X
4 Effect of CSA practices on food diversity X X
5 Fulfillment of basic food needs X
6 Household Food Insecurity Access score (HFIAS) X
7 Household Food Insecurity Access Prevalence (HFIAP) X
8 Food sources share X
PRODUCTIVITY
The multidimensional framework
Δ6 Δ Positive effect of CSA practices on food diversity X
11 Coping strategies X
12 Access to agricultural credit X X
Financial enablers 13 Access to agricultural credit with climate related intention
14 Access to agricultural insurance X X
15 Access to agricultural insurance (Climate Intention)
16 Access to financial services from buyers or providers X
17 Saving capacities associated to agricultural income X X
18 On-farm Investment capacities X X
19 On-farm Investment (Climate intention) X
20 Changes in agricultural activities X
Autonomous
changes
21 Autonomous changes in agricultural activities X
22 Autonomous changes in crops X
23 Autonomous changes in livestock activities X
24 Autonomous changes in animals X
Climate induced
changes
25 Climate-induced changes in agricultural activities X
26 Climate-induced changes in crops X
27 Climate-induced changes in livestock activities X
28 Climate-induced changes in animals X
29 Effect of climate-induced changes on adaptive capacity X
CSA Adoption 30 CSA practices implementation X X
31 Effect of CSA practices on climate vulnerability X X
(Gender equity) 32 CSA effect on labor time X X
33 CSA effect over access/control over generated resources X X
34 Participation in decision making associated to CSA
implementation
X X
35 Level of participation in CSA implementation X X
36 Participation in decision making associated to CSA dis-adoption X X
Access to CIS 37 Access to climate information services X X
38 CSA awareness X X
39 Access to CSA training X X
40 Capacity to use climate information X X
41 Access to CIS training X X
42 Access to value chain training X
Autonomous 43 Autonomous transformation capacity X X
Drivers to autonomous transformational changes XClimate induced 44 Transformation capacity in response to climate shocks X X
Absortive
Capacity
Adaptive
Capacity
Risk Mitigation
Coping Strategies
Transformative
Capacity
ADAPTATION
Knowledge and
learning
Pillar Indicador Metrics
Productivity
Caloric ratio of the farm (%) Caloric supply/Caloric demand x 100
Fodder ratio of the farm (%) Fodder supply/Fodder demand x 100
Cost benefit ratio (%) Benefit/Cost x 100
Adaptation
Biodiversity index (%) Based on Gobbi, J., Casasola, F., 2003.
Water balance (%) Water supply/water demand x 100
Nutrient balance (%) Nutrient supply/nutrient demand x 100
Mitigation Emission/Sequestration of CO2 CoolFarmTool
The multidimensional framework
CSA performance, synergies and trade-offs at farm level
Prospective assessment of Synergies and
tradeoffs
-5
-3
0
3
5
8
10
P
AdAtt
Conventional survey + Farm model =>
The Smart App
 Cost-effectiveness
 Global applicability
CSA options
Climate Shocks
Climate Services
Livelihood security and
Financial services
Food security
Farm Calculator
Animal Calculator
Crop Calculator
Registration
Demographic
Results
78% 22%
342 hh
71%
83% 74%
0%
20%
40%
60%
Water terraces Agroforestry Improved
intercropping
maize/ beans
Improved
intercropping
maize/cassava
Iimproved early
maturing
cassava
Improved and
biofortified
beans/sweet
potato
households male-headed female-headed
Reach Climate effects CSA Adoption
CSA Outcomes
Perceived effect of CSA practices
0%
20%
40%
60%
80%
100%
Male Female Male Female
Increased production Income generation
Agroforestry Water terraces
Improved intercropping maize/ beans Improved intercropping maize/cassava
Improved early maturing cassava Improved and biofortified beans/sweet potato
Productivity
0%
20%
40%
60%
80%
100%
Male Female Male Female
Improved food access Increased food diversity
Agroforestry Water terraces
Improved intercropping maize/ beans Improved intercropping maize/cassava
Improved early maturing cassava Improved and biofortified beans/sweet potato
CSA Outcomes
Perceived effect of CSA practices
Food security
0%
20%
40%
60%
80%
100%
Male Female
Decreasing climate vulnerability
CSA Outcomes
Perceived effect of CSA practices
Adaptation
CSA Outcomes
Perceived effect on gender
0%
20%
40%
60%
80%
M F M F M F
Increased labour time No effect Decreased labour time
Labour
CSA effects on farm performance
0
5
10
15
20
25
30
35
40
Productivity Adaptation Mitigation
Farm 1 Farm 2
• crop rotation
• improved varieties
• integrated nutrient management
• organic fertilizers
• ties ridges.
Advantages of the new CSA Monitoring
framework
• Standard, cost effective tool
• Real time data collection
• Global applicability and flexibility
• Application of the three CSA lenses
• Multi-level scope: Estimates both farm performance, livelihood
outcomes and gender dimensions
Thank you!
More information: o.bonilla@cigar.org
Questions
Answers
&

Monitoring CSA outcomes

  • 1.
    Osana Bonilla-Findji, AntonEitzinger, Nadine Andrieu, Ivonne Acosta, Ngoni Chirinda, Maria Alejandra Garcia, Jennifer Twyman, Andy Jarvis. CGIAR Research Program on Climate Change, Agriculture and Food Security Monitoring CSA outcomes Understanding adoption, synergies and tradeoffs at farm and household level FAO CSA metrics workshop, March 14th 2019
  • 2.
  • 3.
    Integrated framework to monitorCSA in the field Associated set of standard indicators + rapid and reliable ICT-based data collection instrument to systematically assess and monitor: CSA Adoption (community level) CSA effects on Food security and livelihoods (household level) CSA effects on Farm performance 1 2 3
  • 4.
    The multidimensional framework PillarDimension Categories # Indicator Adoption trends HH livelihoods Events affecting ag. income Impacts on agricultural income X X Climate shocks Climate-related impacts on income X X Shocks Livelihood Security 1 CSA effect on yield/production X X 2 CSA effect on income X X Food Security 3 Effect of CSA practices on food access X X 4 Effect of CSA practices on food diversity X X 5 Fulfillment of basic food needs X 6 Household Food Insecurity Access score (HFIAS) X 7 Household Food Insecurity Access Prevalence (HFIAP) X 8 Food sources share X PRODUCTIVITY Livelihoods 9 Δ Agricultural income 10 Agricultural income sources (on/off-farm) Food Security Δ3 Δ Degree of fullfilment of basic food needs X Δ4 Δ Positive change in HFIAS score X Δ5 Δ Positive change in HFIAP X Δ6 Δ Positive effect of CSA practices on food diversity X 11 Coping strategies X 12 Access to agricultural credit X X Financial enablers 13 Access to agricultural credit with climate related intention 14 Access to agricultural insurance X X 15 Access to agricultural insurance (Climate Intention) 16 Access to financial services from buyers or providers X 17 Saving capacities associated to agricultural income X X 18 On-farm Investment capacities X X 19 On-farm Investment (Climate intention) X Absortive Capacity Coping Strategies ADAPTATION
  • 5.
    Pillar Dimension Categories# Indicator Adoption trends HH livelihoods Events affecting ag. income Impacts on agricultural income X X Climate shocks Climate-related impacts on income X X Shocks Livelihood Security 1 CSA effect on yield/production X X 2 CSA effect on income X X Food Security 3 Effect of CSA practices on food access X X 4 Effect of CSA practices on food diversity X X 5 Fulfillment of basic food needs X 6 Household Food Insecurity Access score (HFIAS) X 7 Household Food Insecurity Access Prevalence (HFIAP) X 8 Food sources share X PRODUCTIVITY The multidimensional framework Δ6 Δ Positive effect of CSA practices on food diversity X 11 Coping strategies X 12 Access to agricultural credit X X Financial enablers 13 Access to agricultural credit with climate related intention 14 Access to agricultural insurance X X 15 Access to agricultural insurance (Climate Intention) 16 Access to financial services from buyers or providers X 17 Saving capacities associated to agricultural income X X 18 On-farm Investment capacities X X 19 On-farm Investment (Climate intention) X 20 Changes in agricultural activities X Autonomous changes 21 Autonomous changes in agricultural activities X 22 Autonomous changes in crops X 23 Autonomous changes in livestock activities X 24 Autonomous changes in animals X Climate induced changes 25 Climate-induced changes in agricultural activities X 26 Climate-induced changes in crops X 27 Climate-induced changes in livestock activities X 28 Climate-induced changes in animals X 29 Effect of climate-induced changes on adaptive capacity X CSA Adoption 30 CSA practices implementation X X 31 Effect of CSA practices on climate vulnerability X X (Gender equity) 32 CSA effect on labor time X X 33 CSA effect over access/control over generated resources X X 34 Participation in decision making associated to CSA implementation X X 35 Level of participation in CSA implementation X X 36 Participation in decision making associated to CSA dis-adoption X X Access to CIS 37 Access to climate information services X X 38 CSA awareness X X 39 Access to CSA training X X 40 Capacity to use climate information X X 41 Access to CIS training X X 42 Access to value chain training X Autonomous 43 Autonomous transformation capacity X X Drivers to autonomous transformational changes XClimate induced 44 Transformation capacity in response to climate shocks X X Absortive Capacity Adaptive Capacity Risk Mitigation Coping Strategies Transformative Capacity ADAPTATION Knowledge and learning
  • 6.
    Pillar Indicador Metrics Productivity Caloricratio of the farm (%) Caloric supply/Caloric demand x 100 Fodder ratio of the farm (%) Fodder supply/Fodder demand x 100 Cost benefit ratio (%) Benefit/Cost x 100 Adaptation Biodiversity index (%) Based on Gobbi, J., Casasola, F., 2003. Water balance (%) Water supply/water demand x 100 Nutrient balance (%) Nutrient supply/nutrient demand x 100 Mitigation Emission/Sequestration of CO2 CoolFarmTool The multidimensional framework CSA performance, synergies and trade-offs at farm level Prospective assessment of Synergies and tradeoffs -5 -3 0 3 5 8 10 P AdAtt Conventional survey + Farm model =>
  • 7.
    The Smart App Cost-effectiveness  Global applicability CSA options Climate Shocks Climate Services Livelihood security and Financial services Food security Farm Calculator Animal Calculator Crop Calculator Registration Demographic
  • 8.
    Results 78% 22% 342 hh 71% 83%74% 0% 20% 40% 60% Water terraces Agroforestry Improved intercropping maize/ beans Improved intercropping maize/cassava Iimproved early maturing cassava Improved and biofortified beans/sweet potato households male-headed female-headed Reach Climate effects CSA Adoption
  • 9.
    CSA Outcomes Perceived effectof CSA practices 0% 20% 40% 60% 80% 100% Male Female Male Female Increased production Income generation Agroforestry Water terraces Improved intercropping maize/ beans Improved intercropping maize/cassava Improved early maturing cassava Improved and biofortified beans/sweet potato Productivity
  • 10.
    0% 20% 40% 60% 80% 100% Male Female MaleFemale Improved food access Increased food diversity Agroforestry Water terraces Improved intercropping maize/ beans Improved intercropping maize/cassava Improved early maturing cassava Improved and biofortified beans/sweet potato CSA Outcomes Perceived effect of CSA practices Food security
  • 11.
    0% 20% 40% 60% 80% 100% Male Female Decreasing climatevulnerability CSA Outcomes Perceived effect of CSA practices Adaptation
  • 12.
    CSA Outcomes Perceived effecton gender 0% 20% 40% 60% 80% M F M F M F Increased labour time No effect Decreased labour time Labour
  • 13.
    CSA effects onfarm performance 0 5 10 15 20 25 30 35 40 Productivity Adaptation Mitigation Farm 1 Farm 2 • crop rotation • improved varieties • integrated nutrient management • organic fertilizers • ties ridges.
  • 14.
    Advantages of thenew CSA Monitoring framework • Standard, cost effective tool • Real time data collection • Global applicability and flexibility • Application of the three CSA lenses • Multi-level scope: Estimates both farm performance, livelihood outcomes and gender dimensions
  • 15.
    Thank you! More information:o.bonilla@cigar.org
  • 16.