
More Related Content
What's hot
What's hot (20)
Similar to Module 1 Hydrology-Precipitation
Similar to Module 1 Hydrology-Precipitation (20)
Recently uploaded
Recently uploaded (20)
Module 1 Hydrology-Precipitation
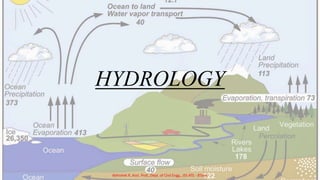
- 1. HYDROLOGY Abhishek R, Asst. Prof., Dept. of Civil Engg., JSS ATE - B'lore.
- 2. Hydrology • Hydrology is the branch of earth science which means the science of water. It is the science which deals with the occurrence, circulation and distribution of water of the earth and earth’s atmosphere. Hydrology deals with, • Estimation of water resources. i.e. to know the water yield from basin/catchment which is essential for the design of dams. • The study of processes such as runoff, precipitation and their interaction. • The study of problems such as floods, droughts and strategies to overcome them. Like safe design of bridges, dams and flood control structures. • To know the maximum rainfall intensity and its frequency over a given basin. Abhishek R, Asst. Prof., Dept. of Civil Engg., JSS ATE - B'lore.
- 3. Practical Applications • Design of Hydraulic Structure: The design of hydraulic structure such as spill ways, dams, culvert, bridges etc. • Municipal and industrial water supply: The check with the availability of water to meet the sufficient needs of the municipal city or the industry. • Hydropower: Absolute min. flow decides the prime capacity of the plant while the additional flow data is useful in estimating the amount of power that will have to be obtained. • Flood Control: Reservoir, levees, channel improvements. • Navigation: To maintain min amount of water without affecting the navigation structure. • Erosion & Sediment Control: The reservoir may loose their capacity. Measures like cropping, afforestation, formation of counter bunds etc. • Irrigation Abhishek R, Asst. Prof., Dept. of Civil Engg., JSS ATE - B'lore.
- 4. Precipitation It is the return of atmospheric moisture to the ground in solid or liquid form. Solid form- snow, sleet, snow pellets, hailstones. Liquid form- drizzle, rainfall. The following are the main characteristics of rainfall, Amount or quantity- The amount of rainfall is usually given as a depth over a specified area, assuming that all the rainfall accumulates over the surface and the unit for measuring amount of rainfall is cm. The volume of rainfall = Area x Depth of Rainfall (m3). The amount of rainfall occurring is measured with the help of rain gauges. Intensity- This is usually average of rainfall rate of rainfall during the special periods of a storm and is usually expressed as cm/hour. Abhishek R, Asst. Prof., Dept. of Civil Engg., JSS ATE - B'lore.
- 5. Duration of Storm- In the case of a complex storm, we can divide it into a series of storms of different durations, during which the intensity is more or less uniform. Aerial distribution- During a storm, the rainfall intensity or depth etc. will not be uniform over the entire area. Hence we must consider the variation over the area i.e. the aerial Abhishek R, Asst. Prof., Dept. of Civil Engg., JSS ATE - B'lore.
- 6. Other Terminologies Infiltration is the process by which water on the ground surface enters the soil. Infiltration rate in soil science is a measure of the rate at which soil is able to absorb rainfall or irrigation. It is most often measured in millimeters per hour or inches per hour. The rate decreases as the soil becomes saturated. Surface runoff is water, from rain, snowmelt, or other sources, that flows over the land surface and is a major component of the water cycle. Runoff that occurs on surfaces before reaching a well-defined stream is also called overland flow. Interflow is the lateral movement of water in the unsaturated zone, that first returns to the surface or enters a stream prior to becoming groundwater. This is known as interflow. Abhishek R, Asst. Prof., Dept. of Civil Engg., JSS ATE - B'lore.
- 7. Ground water flow is the flow of water in the soil occurring below the ground water table. It is defined as the part of stream flow that has infiltrated the ground, has entered the saturated zone. Hence we say that runoff is the portion of precipitation which enters a well-defined stream and has three components; namely- surface runoff, interflow runoff and ground water runoff or base flow. Abhishek R, Asst. Prof., Dept. of Civil Engg., JSS ATE - B'lore.
- 8. Catchment is an area where water is collected by the natural/man made landscape. Such as river, dam, lake, ocean. Watershed is an area of land that feeds all the water running under it and draining off of it into a body of water. It combines with other watersheds to form a network of rivers and streams that progressively drain into larger water areas. Abhishek R, Asst. Prof., Dept. of Civil Engg., JSS ATE - B'lore.
- 9. Evaporation- This is the process by which state of substance (water) is changed from liquid state to vapor form. Evaporation occurs constantly from water bodies, soil surface and even from vegetation. Transpiration – This is the process by which the water extracted by the roots of the plants is lost to the atmosphere through the surface of leaves and branches by evaporation. Abhishek R, Asst. Prof., Dept. of Civil Engg., JSS ATE - B'lore.
- 10. Abhishek R, Asst. Prof., Dept. of Civil Engg., JSS ATE - B'lore.
- 11. Abhishek R, Asst. Prof., Dept. of Civil Engg., JSS ATE - B'lore.
- 12. Engineering Hydrologic CycleAbhishek R, Asst. Prof., Dept. of Civil Engg., JSS ATE - B'lore.
- 13. Cyclonic Precipitation- This is the precipitation associated with cyclones or moving masses of air and involves the presence of low pressures. Frontal cyclonic precipitation- FRONT is a barrier region between two air masses having different temperature, densities, moisture, content etc. Warm fronts occur where the warm air pushes out a previously lodged cold air mass. The warm air overrides the cooler air and moves upward. Warm fronts are followed by extended periods of light rain and drizzle. Cold fronts occur when a mass of cooler air dislodges a mass of warm air. This type of transition is sharper, since cold air is more dense than warm air. The rain duration is shorter, and generally more intense, than that which occurs ahead of warm fronts. Abhishek R, Asst. Prof., Dept. of Civil Engg., JSS ATE - B'lore.
- 14. Convective precipitation- This is due to the lifting of warm air which is lighter than the surroundings. Generally this type of precipitation occurs in the tropics where on a hot day, the ground surface gets heated unequally causing the warmer air to lift up and precipitation occurs in the form of high intensity and short duration. Orographic Precipitation- It is the most important precipitation and is responsible for most of heavy rains in India. Orographic precipitation is caused by air masses which strike some natural topographic barriers like mountains and cannot move forward and hence the rising amount of precipitation. The greatest amount of precipitation falls on the windward side and leeward side has very little precipitation. Abhishek R, Asst. Prof., Dept. of Civil Engg., JSS ATE - B'lore.
- 15. Abhishek R, Asst. Prof., Dept. of Civil Engg., JSS ATE - B'lore.
- 16. Precipitation • Term precipitation denotes all forms of water that reaches the earth from the atmosphere. Forms of Precipitation • Rain • Principal form of precipitation • Water drops of size larger than 0.5 mm up to 6 mm Type of Rain Intensity Light up to 2.5 mm/h Moderate 2.5 to 7.5 mm/h Heavy >7.5 mm/h Abhishek R, Asst. Prof., Dept. of Civil Engg., JSS ATE - B'lore.
- 17. • Snow • Snow Consists on ice crystals which usually combine to form flakes. • Density varies from 0.06 to 0.15 g/cm3. • Drizzle • Fine sprinkle of numerous water droplets. • Size less than 0.5 mm and intensity less than 1 mm/h. • Glaze • When rain or drizzle come in contact with cold ground at around 00C, the water drops freeze to form an ice coating called glaze or freezing rain. Abhishek R, Asst. Prof., Dept. of Civil Engg., JSS ATE - B'lore.
- 18. • Sleet • It is frozen raindrops which forms rainfall through air at subfreezing temperature. • Hail • Showery precipitation in form of irregular pellets or lumps of ice size more than 8 mm. Abhishek R, Asst. Prof., Dept. of Civil Engg., JSS ATE - B'lore.
- 19. Measurement of Precipitation • Expressed in terms of depth to which rainfall water would stand on an area. • 1 cm of rain fall over a catchment area of 1 km2 collects a volume of water equal to 104 m3 • Precipitation is collected and measured in a rain gauge. • Rain gauge consist of a cylindrical vessel assembly kept in open to collect rain. For siting a rain gauge the following considerations are important. • Ground must be level and in the open and the instrument must present a horizontal catch surface. • Instrument must placed such that not affected by wind, flood, splashing etc. • Instrument be surrounded by an open fenced area at least 5.5m x 5.5m • No object should be near to instrument than 30m or twice the height of the obstruction. Abhishek R, Asst. Prof., Dept. of Civil Engg., JSS ATE - B'lore.
- 20. Non Recording Gauge – Symon’s Gauge • Consists circular collecting area of 12.7 cm dia. • Connected to funnel and funnel discharges rainfall water into receiving vessel. • Entire arrangement is housed in a metallic container. • Water collect is measured using a graduated measuring glass, with an accuracy 0.1 mm. • The total rainfall collected in past 24hrs is summed up everyday at 8.30 AM and entered as days rainfall. Abhishek R, Asst. Prof., Dept. of Civil Engg., JSS ATE - B'lore.
- 21. • When snow is expected the funnel & receiving bottle are removed and is collected in the outer metal container. • The snow is then melted & the depth of resulting water is measured. Sometimes antifreeze agents are used. Abhishek R, Asst. Prof., Dept. of Civil Engg., JSS ATE - B'lore.
- 22. Recording type rain gauge – Syphon Rain gauge • A funnel receives the water which is collected in a rectangular container. A float is provided at the bottom of container, and this float raises as the water level rises in the container. Its movement being recorded by a pen moving on a recording drum actuated by a clock work. • When water rises, this float reaches to the top floating in water, then syphon comes into operation and releases the water outwards through the connecting pipe, thus all water in box is drained out. Abhishek R, Asst. Prof., Dept. of Civil Engg., JSS ATE - B'lore.
- 23. Abhishek R, Asst. Prof., Dept. of Civil Engg., JSS ATE - B'lore.
- 24. Optimum number of rain gauge • Catchment area per rain gauge is very small compared to the areal extent of a storm. • Factors to be considered are economy, topography, accessibility etc. • Number of rain gauge stations according to World Meteorological Organization (WMO) • Ten percent of rain gauges should be of recording gauges. Regions Ideal Acceptable As per IS (4987- 1968) Flat 1 for 600 to 900 km2 1 for 900 to 3000 km2 1 per 520 km2 Mountainous 1 for 100 – 250 km2 25 – 1000 km2 1 per 260-390 km2 Polar 1 for 1500 to 1000 km2 1 per 130 km2 Abhishek R, Asst. Prof., Dept. of Civil Engg., JSS ATE - B'lore.
- 25. Preparation of the Data • First to check with the data for continuity and consistency. • If any missing data due to damage or fault in a rain gauge, then normal rainfall is used as a standard comparison to estimate the missing data. • The normal rainfall is the average value of rainfall at a particular date, month or year over specified 30 year period • The 30 year normal are computed every decade. Abhishek R, Asst. Prof., Dept. of Civil Engg., JSS ATE - B'lore.
- 26. Estimation of Missing Data • Px be the missing annual precipitation value of station X • P1, P2,P3…Pm be the annual precipitation values of neighbouring M stations. • N1,N2,N3..Nm be the normal annual precipitation value of (M+1) station including station X. Then, • If values of N of the neighbouring station are within 10% of Nx . Then Px can be calculated using. Px = (P1+P2+P3+…Pm) / M • If the values vary considerably Px = (Nx / M) [ (P1 / N1) + (P2 / N2) +…+ (Pm / Nm) ] Abhishek R, Asst. Prof., Dept. of Civil Engg., JSS ATE - B'lore.
- 27. Test for Consistency of data: • Common cause for inconsistency of record are. • Shifting of rain gauge station to new location. • Forest fire, land slides. • Occurrence of observational error. Double mass curve method • Group of 5-10 base stations in neighbourhood of problem station is selected. • Annual/monthly/seasonal rainfall of station X [Px] and also average rainfall of group of station [Pav] is arranged in reverse chronological order. • The cumulative value of Px and Pav i.e, ∑Px and ∑Pav respectively is determined. • Value of ∑Px along Y-axis is plotted against ∑Pav along X-axis Abhishek R, Asst. Prof., Dept. of Civil Engg., JSS ATE - B'lore.
- 28. • A decided break in slope of the resulting plot indicates a change in precipitation regime of station X. • More homogeneous the base station records are more accurate will be the corrected value at station X. • Change in slope is normally taken only where it persists for more than five years. • The corrected value is obtained by, Pcx = Px (Mc / Ma) Pcx = Corrected precipitation at any time period t1 at station X. Px = Original recorded precipitation at time period t1 at station X. Mc = Corrected slope of the double mass curve Ma = original slope of the double mass curve. Abhishek R, Asst. Prof., Dept. of Civil Engg., JSS ATE - B'lore.
- 29. Presentation of Rainfall Data 1. Mass Curve of Rainfall: • The mass curve of rainfall is a plot of the accumulated precipitation against time, plotted in chronological order. • Records of float type and weighing-bucket type gauges are of this form. • Mass curves of rainfall are very useful in extracting the information on the duration and magnitude of a storm. • Also, intensities at various time intervals in a storm can be obtained by the slope of the curve. • For non-recording rain gauges , mass curves are prepared from a knowledge of the approximate beginning and end of a storm and by using the mass curves of adjacent recording gauge stations as a guide. Abhishek R, Asst. Prof., Dept. of Civil Engg., JSS ATE - B'lore.
- 30. Abhishek R, Asst. Prof., Dept. of Civil Engg., JSS ATE - B'lore.
- 31. 2. Hyetograph • A hyetograph is a plot of the intensity of rainfall against the time. • The hyetograph is derived from the mass curve and is usually represented as a bar chart. • It is a very convenient way to represent characteristics of a storm and is particularly important in the development of a design storms to predict extreme floods. • The area under a hyetograph represents the total precipitation received in that period. • The time interval used depends on the purpose; in urban-drainage problems small durations are used while in flood-flow computations in larger catchments areas the intervals of about 6 h. Abhishek R, Asst. Prof., Dept. of Civil Engg., JSS ATE - B'lore.
- 32. Abhishek R, Asst. Prof., Dept. of Civil Engg., JSS ATE - B'lore.
- 33. 3. Moving average • Moving average is a technique for smoothening out the high frequency fluctuations of a time series and to enable the trend, if any, to be noticed. The basic principle is that a window of time range m years is selected. Starting from the first set of m • years of data, the average of the data for m years is calculated and placed in the middle year of the range m .The window is next moved sequentially one time unit (year) at a time and the mean of the m terms in the window is determined at each window location .The value of m can be 3 or more years; usually an odd value. Generally the larger size of the range m, the greater is the smoothening .There are many ways of averaging and the method described above is called CENTRAL SIMPLE MOVING AVERAGE. Abhishek R, Asst. Prof., Dept. of Civil Engg., JSS ATE - B'lore.
- 34. Mean Precipitation over an Area: • Rain gauges represent only point sampling of the areal distribution of a storm. • In practice, hydrological analysis requires a knowledge of the rainfall over an area, such as over a catchment. To convert the point rainfall values at various stations into an average value over a catchment, the following 3 methods are in use: • Arithmetical-mean method • Thiessen-mean method • Isohyetal method Abhishek R, Asst. Prof., Dept. of Civil Engg., JSS ATE - B'lore.
- 35. Presentation of Rainfall Data Arithmetic-mean Method:- • When the rainfall measured at various stations in a catchment show little variation over catchment area I taken as the arithmetic mean of the station values. Thus, if P1,P2……Pi…Pn are the rainfall values in a given period in N stations within catchment then value of mean precipitation N i Pi N P N PPPP P ni 1 1 ......21 Abhishek R, Asst. Prof., Dept. of Civil Engg., JSS ATE - B'lore.
- 36. Presentation of Rainfall Data Thiessen-mean Method: • In this method, the rainfall recorded at each station is given a weightage on the basis of an area closest to the station. • Consider the catchment area as in Fig. below containing six rain gauge stations. • Stations 1 to 6 are joined to for a network of triangles. Perpendicular bisectors for each of the sides of the triangle are drawn. • These bisectors form a polygon around each station. These bounding polygons are called Thiessen polygons. Abhishek R, Asst. Prof., Dept. of Civil Engg., JSS ATE - B'lore.
- 37. M i M i A A P A AP P AAA APAPAP P i i ii 1 1 621 662211 ... ... Abhishek R, Asst. Prof., Dept. of Civil Engg., JSS ATE - B'lore.
- 38. Presentation of Rainfall Data Isohyetal Method: •An isohyet is a line joining points of equal rainfall magnitude. •In the isohyetal method, the catchment area is drawn to scale and the rain-gauge stations are marked. •The recorded values for which areal average is to be determined are then marked on the plot at appropriate stations. •The isohyets are then drawn by considering point rainfalls as guided and interpolating between them. •The area between two adjacent isohyets are then determined with a planimeter. If the isohyets go out of catchment, the catchment boundary is used as the bounding line. Abhishek R, Asst. Prof., Dept. of Civil Engg., JSS ATE - B'lore.
- 39. A PP a PP A PP A P nn n ) 2 (...) 2 () 2 ( )1( )1( 3 2 21 1 2 Abhishek R, Asst. Prof., Dept. of Civil Engg., JSS ATE - B'lore.
- 40. Adequacy of rain gauge stations • If there are already some raingauge stations in catchment, the optimal number of stations that should exist to have an assigned % of error in the estimation of mean rainfall is obtained by N = 𝐶𝑣 є 2 𝐶𝑣 = 100 𝑋𝜎 𝑚−1 𝑃 𝜎 𝑚 −1 = 1 𝑚 𝑃𝑖− 𝑃 𝑚−1 • Where N = optimal number of stations, є = allowable degree of error in the estimate of the mean rainfall (є = 10%) , Cv = Co-efficient of variation of the rainfall values at the existing stations (in %), Pi = Precipitation magnitude i th station, 𝑃 = mean precipitations. • According to WMO, at least 10% of the total raingauges should be self recording type. Abhishek R, Asst. Prof., Dept. of Civil Engg., JSS ATE - B'lore.
Editor's Notes
- If low pressure occurs in an area (called cyclone), air will flow horizontally from the surrounding area (high pressure), causing the air in the low-pressure area to lift. When the lifted warm-air cools down at higher attitude, non-frontal cyclonic precipitation will occur.