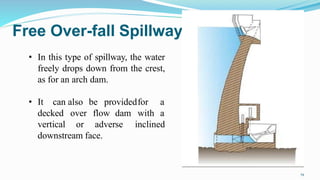
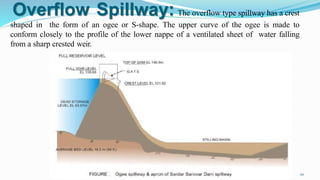
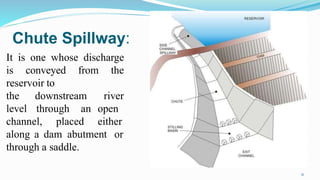
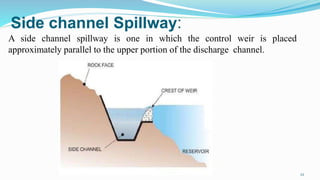
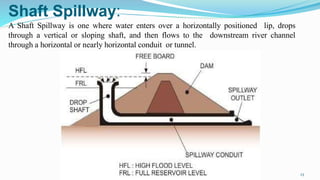
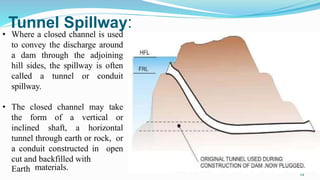
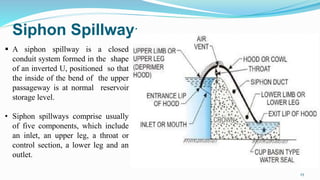
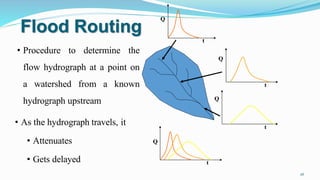
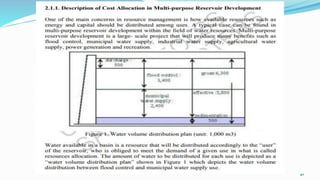
Unit 5 (Part II)
Reservoir Planning
Hydrology & water resources engineering
1
2
5.1 Reservoir Planning
 Silting of reservoirs means the deposition of silt and clay. This mainly occurs
when runoff occurs. Runoff contain smaller soil particles such as silt, clay, fine
sand which may deposited at the bed of reservoir, which reduces the storage
capacity of reservoir.
 When these particles reaches into reservoir tries to settle down due to action of
gravity, coarser one settle down while fine remain suspension therefore it is
very essential to check silting of dam and water stored in reservoir.
 Sediment transported by the river can be divided into two heads:
 The Suspended Load is kept in suspension because of the vertical component
of the eddies formed due friction of flowing water against bed.
 The Bed Load is dragged along the bed of the stream and is about 10 to 15%
of suspended load.
3
INTRODUCTION
Methods of Preserving Storage Capacity of
Reservoir
4
Catchment vegetation
Mechanicaldesilting fromReservoir
5
Sedimentsluicing
Measurement of Sediments from Reservoir
6
Measurement of Sediment by sampling method:
i. Collect water sample from various depths of reservoir in bottles.
ii. Then filtered sample and measure dried silt in the units of ‘ppm’
Sediment load in ppm = (Weight of dry sediment / weight of sediment
and water sample ) × 10^6
The reservoir sedimentation is measured in terms of its “Trap
Efficiency” (η).
Reservoir Trap Efficiency Curve
7
The trap
efficiency of
a reservoir is the
percentage of
incoming
sediment which
is trapped by
the reservoir.
Density Current
8
 It is defined as a gravity flow of one fluid under another fluid
having a slightly different density.
 The density current will separate from the sloping bed and
form an intrusion or interflow.
Rate of sedimentation
 The normal recommended rate of sediment or silt is about
200 to 500 m3/sec per year per square km area.
Sedimentation of Reservoirs
 The following points need careful consideration as regards
design of reservoir and dam.
 Assessment of deposition of the silt in the reservoir.
 Determination of the life of reservoir.
 The sediment concentration varies over 200 gram per litre to
1600 gram per litre.
 The yearly loss of storage due to sedimentation in reservoir.
9
10
Selection of site for Dam
 Topography of Catchment
 Geology and foundation conditions
 Size of Reservoir and CatchmentArea
 Availability of Construction materials
 Spillway size and location
 Length and Height of Dam
 Life of Dam 11
12
13
Selection of site for Dam
If sand, gravel and crushed stone is available, a concrete gravity
dam is preferred.
If coarse and fine grained soils are available, an earth dam
is suitable.
If foundation consists of sound rock with no fault and fissures, any
type of can be constructed.
Rocks like Granite, Gneiss and Schist are suitable for Gravity
Dams.
Poor rock or gravel foundations are suitable for Earth dams and
Rock fill dams.
Earth dam with a separate spillways are suitable for low rolling
plains. 14
Selection of site for Dam
An Arch dam is suitable for a low narrow V-shaped valley.
If large discharge is required, concrete gravity dam is preferable.
If no other site is available for spillway, earth dam with central
overflow section of concrete.
Concrete or masonry gravity dams have very long life.
Earth and Rockfill dams have intermediate life.
If the length of dam is small but height is more, gravity dam is
preferred.
If a roadway is to be passed over top of the dam, an earth or
gravity dam is preferred.
15
Economic Height of A dam
 The economic height of the dam is that one for which the cost of
the dam per unit volume of water stored is minimum.
 The procedure adopted for determining the economic height is the
elevation storage curve.
16
Reservoir Losses
Following seven major causes of losses of water from reservoir:
i) Infiltration
ii) Seepage
iii) Evaporation from water surface
iv) Watershed leakage
v) Interception
vi) Transpiration
vii) Soil evaporation
17
Spillways
Passages constructed either within a dam or in the periphery
of the reservoir to safely pass the excess of the river during
flood flows are called Spillways.
The capacity of a spillway is seen to depend upon the following
major factors:
 The inflow flood
 The volume of storage provided by the reservoir
 Crest height of the spillway
 Gated or ungated
18
Free Over-fall Spillway
• In this type of spillway, the water
freely drops down from the crest,
as for an arch dam.
• It can
decked
vertical
also be providedfor a
over flow dam with a
or adverse inclined
downstream face.
19
Overflow Spillway: The overflow type spillway has a crest
shaped in the form of an ogee or S-shape. The upper curve of the ogee is made to
conform closely to the profile of the lower nappe of a ventilated sheet of water falling
from a sharp crested weir.
20
Chute Spillway:
It is one whose discharge
is conveyed from the
reservoir to
the downstream
level through an
channel, placed
river
open
either
along a dam abutment or
through a saddle.
21
Side channel Spillway:
A side channel spillway is one in which the control weir is placed
approximately parallel to the upper portion of the discharge channel.
22
Shaft Spillway:
A Shaft Spillway is one where water enters over a horizontally positioned lip, drops
through a vertical or sloping shaft, and then flows to the downstream river channel
through a horizontal or nearly horizontal conduit or tunnel.
23
Tunnel Spillway:
• Where a closed channel is used
to convey the discharge around
a dam through the adjoining
hill sides, the spillway is often
called a tunnel or conduit
spillway.
• The closed channel may take
the form of a vertical or
inclined shaft, a horizontal
tunnel through earth or rock, or
a conduit constructed in open
cut and backfilled with
Earth materials.
24
Siphon Spillway:
 A siphon spillway is a closed
conduit system formed in the shape
of an inverted U, positioned so that
the inside of the bend of the upper
passageway is at normal reservoir
storage level.
• Siphon spillways comprise usually
of five components, which include
an inlet, an upper leg, a throat or
control section, a lower leg and an
outlet.
25
Flood Routing
• Procedure to determine the
flow hydrograph at a point on
a watershed from a known
hydrograph upstream
• As the hydrograph travels, it
• Attenuates
• Gets delayed
Q
t
Q
t
Q
t
Q
t
26
Why to route flows?
t
 Account for changes in flow hydrograph as a flood wave passes
downstream.
 This helps to:
 Calculate storages
 Studying the attenuation of flood peaks
Q
27
Method of flood routing
It is the process of calculating water levels in reservoir, the storage
quantities and outflow rates corresponding to a particular inflow
hydrograph at various instants.
Flood routing is carried out in a reservoir to determine what will be
maximum rise in its water surface and what will be the discharge in the
downstream channel when particular flood passes through it.
Some of the important methods which have a more practical bearing are:
1. Calculus method or mathematical method
2. Step by Step Method or Trial and Error Method
3. ISD (inflow storage discharge)
4. HM Cheng’s Method
5. Woodward Method 28
29
Inflow Storage Discharge method
• The inflow storage discharge method was first developed by L.G
puls of U.S army corps of engineers. According to this method
• In the above equation all the quantities on left hand side
are known and hence the quantity is determined.
30
31
• From this quantity the value of Q2 can be found out from
the storage-discharge relationship as explained below.
•From the available storage discharge curve, the curves of
(S-Q/2 ∆T) verses Q and (S+Q/2 ∆T) verses Q are
developed.
•Such curves are called routing curves.
•From the known value of Q1, the value of (S1-
Q1/2∆T) is read from Q verses (S-Q/2 ∆T) curve.
32
• This value is added to (I1+I2/2)∆t to give
(S2+Q2/2∆T).
• Entering the graph with this value of (S2+Q2/2 ∆T)
, the value of Q2 is read out from Q verses
(S+Q/2∆t) curve.
•The value of Q2 thus determined becomes Q1 for
the next time interval.
33
34
• If the inflow and outflow hydrographs are now plotted on the
same time scale, it will be observed that the peak flow of
outflow hydrograph is less than the peak flow of the inflow
hydrograph.
• Similarly, the time to peak in the outflow hydrograph is more
than the time to peak in the inflow hydrograph.
• These are the effects of reservoir storage on the movement of
flood wave through the reservoir.
• The reduction of peak is known as the attenuation and the
difference in times to peak is known as the reservoir lag.
35
36
37
38
Benefit-Cost Ratio Analysis
39
System Approach
40
41
Alternative Cost Allocation Methods
42
43
44
Every drop of water matters!!!

5.1 reservoir planning

  • 1.
    Unit 5 (PartII) Reservoir Planning Hydrology & water resources engineering 1
  • 2.
  • 3.
     Silting ofreservoirs means the deposition of silt and clay. This mainly occurs when runoff occurs. Runoff contain smaller soil particles such as silt, clay, fine sand which may deposited at the bed of reservoir, which reduces the storage capacity of reservoir.  When these particles reaches into reservoir tries to settle down due to action of gravity, coarser one settle down while fine remain suspension therefore it is very essential to check silting of dam and water stored in reservoir.  Sediment transported by the river can be divided into two heads:  The Suspended Load is kept in suspension because of the vertical component of the eddies formed due friction of flowing water against bed.  The Bed Load is dragged along the bed of the stream and is about 10 to 15% of suspended load. 3 INTRODUCTION
  • 4.
    Methods of PreservingStorage Capacity of Reservoir 4 Catchment vegetation
  • 5.
  • 6.
    Measurement of Sedimentsfrom Reservoir 6 Measurement of Sediment by sampling method: i. Collect water sample from various depths of reservoir in bottles. ii. Then filtered sample and measure dried silt in the units of ‘ppm’ Sediment load in ppm = (Weight of dry sediment / weight of sediment and water sample ) × 10^6 The reservoir sedimentation is measured in terms of its “Trap Efficiency” (η).
  • 7.
    Reservoir Trap EfficiencyCurve 7 The trap efficiency of a reservoir is the percentage of incoming sediment which is trapped by the reservoir.
  • 8.
    Density Current 8  Itis defined as a gravity flow of one fluid under another fluid having a slightly different density.  The density current will separate from the sloping bed and form an intrusion or interflow. Rate of sedimentation  The normal recommended rate of sediment or silt is about 200 to 500 m3/sec per year per square km area.
  • 9.
    Sedimentation of Reservoirs The following points need careful consideration as regards design of reservoir and dam.  Assessment of deposition of the silt in the reservoir.  Determination of the life of reservoir.  The sediment concentration varies over 200 gram per litre to 1600 gram per litre.  The yearly loss of storage due to sedimentation in reservoir. 9
  • 10.
  • 11.
    Selection of sitefor Dam  Topography of Catchment  Geology and foundation conditions  Size of Reservoir and CatchmentArea  Availability of Construction materials  Spillway size and location  Length and Height of Dam  Life of Dam 11
  • 12.
  • 13.
  • 14.
    Selection of sitefor Dam If sand, gravel and crushed stone is available, a concrete gravity dam is preferred. If coarse and fine grained soils are available, an earth dam is suitable. If foundation consists of sound rock with no fault and fissures, any type of can be constructed. Rocks like Granite, Gneiss and Schist are suitable for Gravity Dams. Poor rock or gravel foundations are suitable for Earth dams and Rock fill dams. Earth dam with a separate spillways are suitable for low rolling plains. 14
  • 15.
    Selection of sitefor Dam An Arch dam is suitable for a low narrow V-shaped valley. If large discharge is required, concrete gravity dam is preferable. If no other site is available for spillway, earth dam with central overflow section of concrete. Concrete or masonry gravity dams have very long life. Earth and Rockfill dams have intermediate life. If the length of dam is small but height is more, gravity dam is preferred. If a roadway is to be passed over top of the dam, an earth or gravity dam is preferred. 15
  • 16.
    Economic Height ofA dam  The economic height of the dam is that one for which the cost of the dam per unit volume of water stored is minimum.  The procedure adopted for determining the economic height is the elevation storage curve. 16
  • 17.
    Reservoir Losses Following sevenmajor causes of losses of water from reservoir: i) Infiltration ii) Seepage iii) Evaporation from water surface iv) Watershed leakage v) Interception vi) Transpiration vii) Soil evaporation 17
  • 18.
    Spillways Passages constructed eitherwithin a dam or in the periphery of the reservoir to safely pass the excess of the river during flood flows are called Spillways. The capacity of a spillway is seen to depend upon the following major factors:  The inflow flood  The volume of storage provided by the reservoir  Crest height of the spillway  Gated or ungated 18
  • 19.
    Free Over-fall Spillway •In this type of spillway, the water freely drops down from the crest, as for an arch dam. • It can decked vertical also be providedfor a over flow dam with a or adverse inclined downstream face. 19
  • 20.
    Overflow Spillway: Theoverflow type spillway has a crest shaped in the form of an ogee or S-shape. The upper curve of the ogee is made to conform closely to the profile of the lower nappe of a ventilated sheet of water falling from a sharp crested weir. 20
  • 21.
    Chute Spillway: It isone whose discharge is conveyed from the reservoir to the downstream level through an channel, placed river open either along a dam abutment or through a saddle. 21
  • 22.
    Side channel Spillway: Aside channel spillway is one in which the control weir is placed approximately parallel to the upper portion of the discharge channel. 22
  • 23.
    Shaft Spillway: A ShaftSpillway is one where water enters over a horizontally positioned lip, drops through a vertical or sloping shaft, and then flows to the downstream river channel through a horizontal or nearly horizontal conduit or tunnel. 23
  • 24.
    Tunnel Spillway: • Wherea closed channel is used to convey the discharge around a dam through the adjoining hill sides, the spillway is often called a tunnel or conduit spillway. • The closed channel may take the form of a vertical or inclined shaft, a horizontal tunnel through earth or rock, or a conduit constructed in open cut and backfilled with Earth materials. 24
  • 25.
    Siphon Spillway:  Asiphon spillway is a closed conduit system formed in the shape of an inverted U, positioned so that the inside of the bend of the upper passageway is at normal reservoir storage level. • Siphon spillways comprise usually of five components, which include an inlet, an upper leg, a throat or control section, a lower leg and an outlet. 25
  • 26.
    Flood Routing • Procedureto determine the flow hydrograph at a point on a watershed from a known hydrograph upstream • As the hydrograph travels, it • Attenuates • Gets delayed Q t Q t Q t Q t 26
  • 27.
    Why to routeflows? t  Account for changes in flow hydrograph as a flood wave passes downstream.  This helps to:  Calculate storages  Studying the attenuation of flood peaks Q 27
  • 28.
    Method of floodrouting It is the process of calculating water levels in reservoir, the storage quantities and outflow rates corresponding to a particular inflow hydrograph at various instants. Flood routing is carried out in a reservoir to determine what will be maximum rise in its water surface and what will be the discharge in the downstream channel when particular flood passes through it. Some of the important methods which have a more practical bearing are: 1. Calculus method or mathematical method 2. Step by Step Method or Trial and Error Method 3. ISD (inflow storage discharge) 4. HM Cheng’s Method 5. Woodward Method 28
  • 29.
  • 30.
    Inflow Storage Dischargemethod • The inflow storage discharge method was first developed by L.G puls of U.S army corps of engineers. According to this method • In the above equation all the quantities on left hand side are known and hence the quantity is determined. 30
  • 31.
  • 32.
    • From thisquantity the value of Q2 can be found out from the storage-discharge relationship as explained below. •From the available storage discharge curve, the curves of (S-Q/2 ∆T) verses Q and (S+Q/2 ∆T) verses Q are developed. •Such curves are called routing curves. •From the known value of Q1, the value of (S1- Q1/2∆T) is read from Q verses (S-Q/2 ∆T) curve. 32
  • 33.
    • This valueis added to (I1+I2/2)∆t to give (S2+Q2/2∆T). • Entering the graph with this value of (S2+Q2/2 ∆T) , the value of Q2 is read out from Q verses (S+Q/2∆t) curve. •The value of Q2 thus determined becomes Q1 for the next time interval. 33
  • 34.
  • 35.
    • If theinflow and outflow hydrographs are now plotted on the same time scale, it will be observed that the peak flow of outflow hydrograph is less than the peak flow of the inflow hydrograph. • Similarly, the time to peak in the outflow hydrograph is more than the time to peak in the inflow hydrograph. • These are the effects of reservoir storage on the movement of flood wave through the reservoir. • The reduction of peak is known as the attenuation and the difference in times to peak is known as the reservoir lag. 35
  • 36.
  • 37.
  • 38.
  • 39.
  • 40.
  • 41.
  • 42.
  • 43.
  • 44.
    44 Every drop ofwater matters!!!