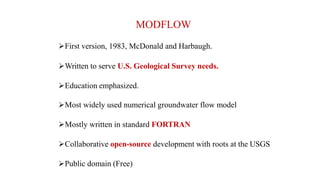
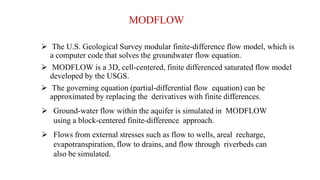
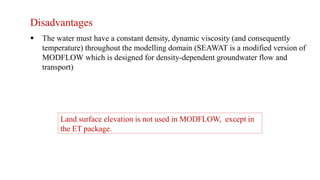
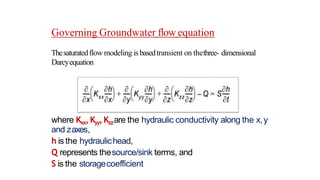
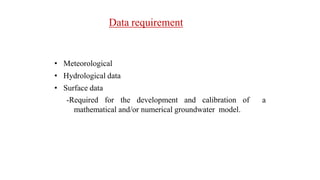
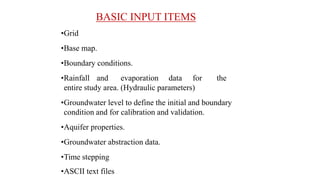
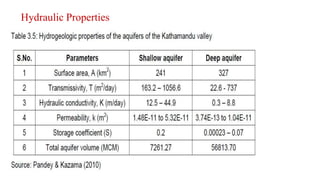
3. MODFLOW
First version, 1983, McDonald and Harbaugh.
Written to serve U.S. Geological Survey needs.
Education emphasized.
Most widely used numerical groundwater flow model
Mostly written in standard FORTRAN
Collaborative open-source development with roots at the USGS
Public domain (Free)
4. MODFLOW
The U.S. Geological Survey modular finite-difference flow model, which is
a computer code that solves the groundwater flow equation.
MODFLOW is a 3D, cell-centered, finite differenced saturated flow model
developed by the USGS.
The governing equation (partial-differential flow equation) can be
approximated by replacing the derivatives with finite differences.
Ground-water flow within the aquifer is simulated in MODFLOW
using a block-centered finite-difference approach.
Flows from external stresses such as flow to wells, areal recharge,
evapotranspiration, flow to drains, and flow through riverbeds can
also be simulated.
8. Pores Full of Combination of Air and Water
Unsaturated Zone / Zone of Aeration / Vadose
(Soil Water)
Zone of Saturation (Ground water)
Pores Full Completely with Water
9.
10. 1) Increase flexibility in grid design
- Add resolution where needed
- Handle pinched layers and fault offsets
2) Better solution of tightly coupled hydrologic processes
3) Retain MODFLOW concepts and general finite-
difference approach
4) Runs on any platform (Windows, Sun, Unix, Linux,…).
Why MODFLOW ?
12. Advantages
• Include numerous facilities for data preparation
• Easy exchange of data in standard form
• Extended worldwide experience
• Continuous development
• Availability of source code
13. Disadvantages
Surface runoff and unsaturated flow are not included
Hence in case of transient problems, MODFLOW can not be
applied if the flux at the groundwater table depends on the
calculated head and the function is not known in advance.
The flexibility of analytical modeling is limited due to
simplifying assumptions: Homogeneity, Isotropy, simple
geometry, simple initial conditions…
Geology is inherently complex: Heterogeneous,
anisotropic, complex geometry, complex conditions…
14. Disadvantages
The water must have a constant density, dynamic viscosity (and consequently
temperature) throughout the modelling domain (SEAWAT is a modified version of
MODFLOW which is designed for density-dependent groundwater flow and
transport)
Land surface elevation is not used in MODFLOW, except in
the ET package.
15. Governing Groundwater flow equation
Thesaturatedflowmodeling isbasedtransient on thethree- dimensional
Darcyequation
where Kxx,Kyy,Kzzare the hydraulic conductivity along the x,y
and zaxes,
h is the hydraulichead,
Q represents thesource/sink terms, and
S is the storagecoefficient
16. Data requirement
• Meteorological
• Hydrological data
• Surface data
-Required for the development and calibration of a
mathematical and/or numerical groundwater model.
17. BASIC INPUT ITEMS
•Grid
•Base map.
•Boundary conditions.
•Rainfall and evaporation data for the
entire study area. (Hydraulic parameters)
•Groundwater level to define the initial and boundary
condition and for calibration and validation.
•Aquifer properties.
•Groundwater abstraction data.
•Time stepping
•ASCII text files
18. OUTPUTS
Hydraulic Heads
Drawdown
Flow rates
Mass Balance
Iteration information.
The velocity vectors, path lines, water table contours,
concentration contours can be seen in 2D or 3D
according to the selection.
20. MODELING APPROACH
• Units
• Creating the Grid
• Creating the MODFLOW simulation
• Assigning IBOUND values directly to cells
• LPF package
• Recharge Package
• Drain Package
• Well Package
• Checking and saving the simulation
• Running MODFLOW
• Viewing the solution
• Zone Budget
• Conclusion
21. International Use of MOD-FLOW
• K. Mosoh Bambi et al conducted ground water chemistry analysis and numerical
ground water flow modeling to access the quantity and quality of water for
potential users (agriculture and public water supply) in the Bleone Catchment
which is fractured aquifer in Southern France. They concluded that water-rock
interaction caused dissolution of Calcite and Dolomite which resulted in increase
of permeability of area, which rendered the system susceptible to pollution (2016)
• Ali Movahedian et al conducted evaluation of Artificial recharge on groundwater
using MOD-FLOW model in Gotvand Plain, Iran. They concluded that western
parts of Abbid Sarbishe flood water spreading had more effect on aquifer due to
less thickness of unsaturated part of aquifer (2015)
22. International Use of MOD-FLOW
• Dr. M. Inayathulla et al ‘Groundwater Flow Analysis Using Visual
Modflow’ , India. The study area, a part of Jakkur River Basin,
Karnataka State was chosen for ground water modeling in Visual
MODFLOW Pro with the objective to understand the ground water
system and to quantify the input and output stresses.
25. Before 1980, the water supply need of city residents were met using springs, river,
shallow dug wells because of low population
Due to increase in population and haphazard settlement surface water as well as
shallow well surfaces were getting polluted which in turn result in abstraction of
water from pumping wells
Water Scarcity Problems in Kathmandu Valley
26.
27. Pumping wells as well as Ground Water abstraction to meet the demand of
increasing population
35. Estimation of Ground Recharge
1. Precipitation
Maximum rainfall occurs at the time of JUNE-SEPTEMBER, months of
OCTOBER-MAY are dry.
Highest Precipitation:-2300-2400 mm average annual precipitation
Lowest Precipitation:-1200-1300mm
36. 2. Evapotranspiration
Monthly mean evaporation data collected from department of Hydrology and
Meteorology recorded at two stations at Tribhuvan International Airport and
Khumaltar
3. Discharge
Monthly discharge at gauging station at outlet of study area
37. 4. Recharge Area
Southern Part:- Out of 55km^2 total area, recharge takes place only in 21km^2
Central Part:-Out of 114km^2 total area, only 6km^2 of Chapagaun area, covered
with sand gravel is recharge area
Northern Part:- Out of 159km^2 total area, recharge area is only 57km^2
Total recharge area= 86km^2 (JICA 1990)
38. Water Balance for Basin
S(m)= P(m) – Eto(m)
Where,
S(m)= water surplus for a month m
P(m)= precipitation for a month m
ETo= reference evapotranspiration for a month m
From calculation, it was found annual recharge to the groundwater
of the Kathmandu Valley is 43mm/year
39. Ground Water Abstractions (Pumping Wells and Screens)
In this modeling, 188 pumping wells are used which are collected by Groundwater
Database , GWDB (2009)
41. Development of Conceptual model includes:-
1. Definition of area to be modeled and identification of boundaries.
2. Definition of hydrogeological unit
Conceptualization of how and where water originates in ground water flow
system and how and where it leaves the system.
3. Model Layer Elevation data
Determined from bore hole logs
42. Assumptions
Conductivity of each layer is constant throughout the layer
There is no flow between aquifer layer and adjoining basement rock
Recharge is constant in different layers and also equally distributed in different
months of year
43. Model Design
The grid is taken as size of 200 columns and 200 rows with each cell 0.018km^2
45. Model Calibration
Hydraulic heads obtained from ground water level measurement data were used as
calibration values. And calibration target was to match hydraulic heads calculated by
model with measured head points
Trial and error analysis was done to minimize different error parameter and
maximize the correlation coefficient
46. Modeling Results
Hydraulic head values for each cell in model domain. A water table surface can be
interpolated from these hydraulic head values
The location of ground water also dictates the interaction between surface- water
and ground water which could potentially influence surface water supplies
47.
48.
49.
50. Water Budget: Determination of the water availability in
Kathmandu Valley
In: (m^3/day) Out: (m^3/day)
River leakage:- 3490505.5 Wells:- 62851.7617
Recharge:- 40467.2578 River Leakage:- 3466838
Total In:- 3530972.75 Total out:- 3529690
In-Out:- 1282.75
51. Conclusions
• Observed and calculated water levels for the observation wells can be
compared.
• The hydraulic conductivity can be obtained from the model calibration
from MODflow.
• The model aquifer is more sensitive to recharge than to hydraulic
conductivities and storativity (i.e. storage coefficient).
• The MODPATH(Particle tracking code) can show that speed of migration of
pollutants from the upstream of the aquifer towards the lagoon within years
time range.
• Effects on the aquifer due to thickness of the unsaturated or saturated part
of the aquifer can be observed
52. Future Scope
Since MODflow is based on FOTRAN programming language which is generally
• sophisticated, so attempts should be made to code the MODFLOW in user friendly
language.
• Since modelling involves the use of various models flow, transport and
optimization, A Decision Support System (DSS) should be generated to assist and
help decision makers in decision making process.
• Ground flow conditions of Pokhara valley can be studied by MODflow which is
still not done. This study can minimize upcoming problems like sinking of ground,
scarcity of water, ground water pollution etc.
• Ground water pollution remedies could be found out by modelling in MODpath.