Kombolcha poly technic college
Sector of ICT
WDDBA level III
Module Title: Model Data Object
Module code: EIS WDDBA3 M02 1123
September 2024
Prepared by Haile sitotaw
Conceptual data model
1
2
3
4
5
Learning outcomes
Normalization
2
Data model validation
3
Nominal duration:50Hours
Conceptual data model
1
This unit will also assist you to attain the learning outcomes stated in
the cover page.
Specifically, upon completion of this learning guide, you will be able
to:
 Understand and analyze business operations
 Understand scope of the system
 Identify and define entities, attributes, data types and
relationships
 Review business rules to determine impact
 Document relationships in an entity relationship diagram
1.1. Analysis of business data operations
I. Understanding Business operations
 Business operations are those ongoing cyclic activities involved in the running of a
business for the purpose of producing value.
 The outcome of business operations is the harvesting of value from assets owned by a
business.
Three fundamental management imperatives for Business operations
1. Generate recurring income
2. Increase the value of the business assets
3. Secure the income and value of the business
II. Analyzing Business operations
 Operational analysis is a business approach that is used to understand and develop
operational processes.
 It is a technique of probing into the present and past performance of an operational
investment.
 It measures the performance against particular standard costs, operations and
services. It also considers how goals can be achieved in a better way, how
cost effectively they can be achieved.
 It answers the questions related to the areas of:
 Customer Results: tries to determine whether the investment is delivering
planned goods and services or not.
 Strategic and Business Results: It analyses whether the current investment
level is sufficient to get the job done.
 Financial Performance: analyses whether the cost is compatible with the
performance.
 Innovation: It finds solutions to the questions:
o How can the customers needs be satisfied in a better way and at a lower cost?;
o How can technology be best used to provide better services at lower cost? etc.
II. Major Data Analysis methods
A) Text Analysis
 Text analysis is also referred to as data mining.
 It is one of the methods of data analysis to discover a pattern in large data sets using
databases or data mining tools.
 It used to transform raw data into business information
 It offers a way to extract and examine data and deriving patterns and finally
interpretation of the data.
B) Statistical Analysis
 It includes collection, Analysis, interpretation, presentation, and modeling of data.
 It analyses a set of data or a sample of data.
C) Diagnostic Analysis
It shows "Why did it happen?" by finding the cause from the insight found in Statistical
Analysis.
D) Predictive Analysis
 It shows "what is likely to happen" by using previous data.
 This Analysis makes predictions about future outcomes based on current or past data.
Forecasting is just an estimate.
 Its accuracy is based on how much detailed information you have and how much you
dig in it.
E) Prescriptive Analysis
 Combines all previous Analysis to determine which action to take in a current problem
or decision.
 Most data driven companies are utilizing Prescriptive Analysis because predictive
analysis are not enough to improve data performance.
 Based on current situations and problems, they analyze the data and make decisions.
2.Scope of the system
1.Define the System Scope
It defines what the system/project will and will not include, in enough
detail to clearly communicate to all participants.
The scope must be a complete definition encompassing all types of
requirements:
 functional requirement
 non-functional requirement
 pseudo requirement
The conceptual or scoping model defines the boundaries of the system (i.e., what
is in scope and what is out of scope).
It identifies:
 Events outside the system that cause the system to react,
 Actors outside the system that interact with the system,
 Information that flows between the system and the actors outside the
system,
 Major functions included in the system,
 User population.
II. Clarify System Boundaries
The boundaries identify where the system to be sized starts and ends. The sizing should
include everything for which the team is responsible.
A scope of a system is identified based on the following
 Databases
 Applications
 Servers
 Operating systems
 Gateways
 Application service provider and
 ISP (Internet service provider)
Entities, attributes, data types and
relationships of data
A. Entity
An entity is an existing or real thing.
Is a single person, place, or thing about which
data can be stored. ex. school, student, course,
department, employee, university.
Considered as container that holds all instances
of a particular thing in a system.
Entities are equivalent to database tables in a
relational database, with each row of the table
representing an instance of that entity.
Examples of entities
Entity type
 An entity type is a collection of entity instances sharing similar
properties;
 Two entity type instances are considered equal only if they are of the
same type and the values of their entity keys are the same.
 The entity type is the fundamental building block for describing the
structure of data with the Entity Data Model (EDM).
Example: The diagram below shows a conceptual model with three
entity types: Book, Publisher, and
Author:
Entity set
It is set of entities of the same type (e.g., all persons having
an account at a bank)
An entity set is a logical container for instances of an
entity type and instances of any type derived from that
entity type.
The relationship between an entity type and an entity set is
analogous to the relationship between a row and a table in a
relational database:
Like a row, an entity type describes data structure, and,
Like a table, an entity set contains instances of a given
structure.
Example
Branch: the set of all branches of a particular bank. Each branch is
described by the attributes w
Those are: Branch-name, branch-city and assets.
Customer: the set of all people having an account at the bank.
Attributes are ID, name, Gender, Gender and Phone-number.
Figure 1.5Entity examples 2
Classification of Entity
Strong Entity
 An entity set that has a primary key is termed as strong entity.
Weak Entity
 an entity set that does not have sufficient attributes to form a primary
key. The existence of a weak entity depends on the existence of stored
entity.
 The discriminator (partial key) is used to identify other attributes of a
weak entity set.
Recursive Entity
 Is one in which a relation can exist between occurrences of the same
entity set. This occurs in a unary relationship.
Composite Entities
 If a Many to Many relationship exist we must create a bridge entity to
convert into 1 to many.
 Bridge entity composed of the primary keys of each of the entities to be
connected.
 The bridge entity is known as a composite entity.
Attribute
 A factor/property/characteristic that describes an entity
Example: (Colour: attribute of your hair/skin/cloth) Employee’s name,
age, address, salary and job: attribute of Employee, etc.
 Is represented by oval shape
Types of Attributes
 Simple and Composite Attribute
Simple attribute: consist of a single atomic value that can’t be subdivided.
(For example, age, sex etc.).
Composite attribute: can be further subdivided. (E.g.,ADDRESS can be
subdivided into city, Sub-city, Woreda, region, House No., etc.)
 Single Valued and Multi Valued attribute
Single valued: can have only one or a single value. For example, a person
can have only one 'date of birth', 'age', etc. But it can be simple or composite
attribute
Name
Fname
Lname
Example: 'date of birth' is a composite attribute; 'age' is a simple
attribute. But both are single valued attributes.
Multi-valued: can have multiple values. For instance, a person may
have multiple phone numbers, multiple degrees etc. Multi-valued
attributes are shown by a double line connecting to the entity in the ER
diagram.
 Stored and Derived Attributes
Stored attribute: supplies a value to the related attribute. (e.g., 'Date of
birth')
Derived attribute: the value is derived from the stored attribute. (e.g.,
the value of 'AGE' can be derived by subtracting the 'Date of Birth'(DOB)
from the current date.
 Complex Attribute: attribute that is both composite and multi
valued. (e.g., Phone no)
Selecting Attributes for Entities: choose ones that
have the following qualities:
Significant: Include only attributes that are useful to the database
users.
Direct: not derived. Derived data complicates the maintenance of a
database.
Non-decomposable: An attribute can contain only single values,
never lists or repeating groups. Composite values must be separated into
individual attributes.
Contain data of the same type: For example, you would
want to enter only date values in a birthday attribute, not names or
telephone numbers.
Entity Key
A property or a set of properties of an entity type that are used to determine
identity.
Value of entity key must uniquely identify an entity type instance within an
entity set.
Requirements of entity key:
No two entity keys within an entity set can be identical. That is, for any two
entities within an entity set, the values for all of the properties that constitute a
key can’t be the same.
An entity key must consist of a set of non-null, immutable, primitive type
properties.
The properties that make up an entity key can’t change. You cannot allow
more than one possible entity key for a given entity type; surrogate keys aren’t
supported.
Types of keys
Super/Candidate Key: is a field or combination of fields, can act as a
primary key for a table to uniquely identify each record. Every entity in
relational database must have at least one candidate key but it is possible to
have two or more. (Example: social security number, employee number or
driver license number may identify an employee. All of them are considered
candidate keys)
Primary Key: is an attribute or set of attributes that uniquely identifies
one entity from the other. Every entity must have a primary key. It is a
candidate key chosen as the main method of uniquely identifying a row.
Alternate key - is any candidate key which is not selected to be the
primary key
Foreign Key: references a particular attribute of an entity containing the
corresponding primary key. These keys are used to create relationships
between tables. (For example, an employee entity with employee number as
its primary key and department entity with department number as its
primary key can be related to each other through employee number.
Therefore, employee number will be a foreign key for department and
primary key for employee).
Compound/Composite Key: A Combination of more than one column
identifying records of a table uniquely.
3 Key Terms
Conceptual Entity Relationship Diagram: The highest-level view
of the entity relationship diagram, which contains little detail and is solution
agnostic.
This level of modeling establishes the entities, and their relationships, and
defines consistent terminology of the business information.
Logical Entity Relationship Diagram: Contains mid-level detail.
Attributes are introduced and operational, transactional, and business rules are
defined in this model. This entity relationship diagram level defines the
structure of the data elements and the relationships between them.
Physical Entity Relationship Diagram: Provides the most detail.
Physical entity relationship diagrams describe the database-specific
implementation of the model and illustrate non-functional requirements such as
performance, concurrency, and security.
Database: A structured collection of information. Usually organized so that data
can be easily stored to allow for prompt research, retrieval, and updating.
Adjective: Attributes that describe or provide details about the entity. For example,
a student (noun) might have attributes such as name, age, and address. Note, the term
"adjective" is used loosely with the concept of ERDs as many attributes are formally
nouns.
Noun (common or proper): Entity type of person, object, concept, or event.
For example, a person entity relevant to school enrollment would be a "student".
Verb: Relationship types between entities such as enroll. For example, a student
(entity) would "enroll" in a course (entity).
Data Types
Database data types refer to the format of data storage that can hold a
distinct type or range of values.
Integer – is a whole number that can have a positive, negative or zero value. It cannot
be a fraction nor can have decimal places.
Character – refers to any number, letter, space or symbol that can be entered in a
computer. Each character occupies one byte of space.
String – is used to represent text. It is composed of a set of characters that can have
spaces and numbers.
Strings are enclosed in quotation marks to identify the data as string and not a variable
name nor a number.
Floating Point Number – is a number that contains decimals. Numbers that
contain fractions are also considered as floating-point numbers.
Array – contains a group of elements which can be of the same data type like an integer
or string. It is used to organize data for easier sorting and searching of related set of values.
Varchar – as the name implies is variable character as the memory storage has variable
length. Each character occupies one byte of space plus 2 bytes for length information.
Boolean – is used for creating true or false statements. To compare values the following
operators are being used: AND, OR, XOR, and NOT.
Relationship
 It is an association between entities, captures how entities are related to
one another. Relationships can be thought of as verbs, linking two or
more nouns.
 A relationship is how the data is shared between entities.
 Are represented by lines between entities, lines indicate that each
instance of an entity may have a relationship with instances of the
connected entity, and vice versa.
 Is represented by Diamond symbol
The diagram above indicates that students may have some
relationship with schools.
Relationship and Entity: can both have attributes. Examples: an
employee entity might have a Social Security Number (SSN) attribute; the proved
relationship may have a date attribute.
Two related entities
An entity with an attribute
A relationship with an attribute
Figure Relation with entity
There are four types of relationships between
entities:
Cardinality: Defines the numerical attributes of the relationship between
two entities or entity sets
One-to-one (1:1): one instance of an entity (A) is associated with one other
instance of another entity (B). For example, in a database of employees,
each employee name (A) is associated with only one social security number
(B).
One-to-many (1: N):
Any one entity instance from the primary entity can be referenced by
many entity instances from the related entity. One instance of an entity (A)
is associated with zero, one or many instances of another entity (B), but for
one instance of entity B there is only one instance of entity (A). Example,
for a company with all employees working in one building, the building
name (A) is associated with many different employees (B), but those
employees all share the same singular association with entity
Figure 1.11 one to many relations
 Many entity instances from the related entity can reference any one
entity instance from the primary entity
Many-to-one (N: 1)
Figure 1.13 many to one relation
Many-to-many (N: N)
A many-to-many relationship lets users relate one or more
entity instances from another entity to an entity instance of
the current entity
Figure 1.13 many to many relations
notation symbols of relationships
Review business rules
Business rule
 It is a rule of a business, company, or corporation that defines or
constrains some aspect of business and always resolves to either true or
false.
 It is a statement that defines or constrains some aspect of the business,
intended to assert business structure, to control/influence behavior of
the business.
 Describes the operations, definitions and constraints that apply to an
organization.
 Tells an organization what it can do in detail, provides detailed
guidance about how a strategy can be translated to action.
.
Example: rent rules, payment rules, service rules, attendance rules, product
rules, etc.
Documentation of entity
relationship diagram
Overview of data modeling:
 It is an abstract model that documents and organizes the business data
for communication between team members and is used as a plan for
developing applications, specifically how data are stored and accessed.
 It determines the structure of data or structured data. Typical
applications of data models include database models, design of
information systems and enabling exchange of data
Entity – Relationship Diagram (ERD)
 An ERD, or entity relationship diagram, is a type of flowchart that
helps you clearly visualize your database design by showing how
the "entities" in the system relate to one another.
 It is an abstract way to describe a database.
 It is a visual representation of different data using conventions
that describe how these data are related to each other.
For example, the elements writer, novel, and consumer may be
described using ERD this
Entity relation diagram symbols
There are three basic elements in an ER Diagram: entity,
attribute, relationship.
There are more elements which are based on the main elements.
They are weak entity, multi-valued attribute, derived attribute,
weak relationship and recursive relationship.
Entity: An entity can be a person, place, event, or object that is relevant
to a given system. For example, a school system may include students,
teachers, major courses, subjects, fees, and other items. Represented in
ERD by a rectangle and named using singular nouns.
Weak Entity: is an entity that depends on the existence of another
entity. In more technical terms it can defined as an entity that can’t be
identified by its own attributes.
Example: The order item will be meaningless without an order so
it depends on the existence of order.
Student
ID
Nam
e
Ag
e
Level
Sect
ion
Attribute:
 An attribute is a property, trait, or characteristic of an entity, relationship,
or another attribute.
 An entity can have as many attributes as necessary.
 Attributes are represented by oval
shapes. (For example: a student entity
may have attributes such as Name,
Roll no and Age)
Composite attributes:
Attributes having their own specific attributes. For example:
the attribute “customer address” can have the attributes
number, street, city, and state.
Figure 1.17 Composite attribute
Multi-valued Attribute:
If an attribute can have more than one value.
For example, a teacher entity can have multiple subject values.
Figure 1.18 Multi-valued attribute
Derived Attribute:
An attribute based on another attribute, found rarely in ER diagrams. For
example, for a circle the area can be derived from the radius.
Figure 1.189 Derived attribute
Relationship:
A relationship describes how entities interact. For example, the entity
“carpenter” may be related to the entity “table” by the relationship “builds”
or “makes”. Relationships are represented by diamond shapes and are
labeled using verbs.
Recursive Relationship:
If the same entity participates more than once in a relationship it is known
as recursive relationship.
Figure 1.21 Recursive relationships
2 Normalization
This unit will also assist you to attain the learning outcomes stated in
the cover page.
Specifically, upon completion of this learning guide, you will be able
to:
 Understand and analyze business data
 Understand rules of normalization
 Understand benefits of normalization
 Contrast normalization results with ER diagram
 Understand how to conform differences between data
Identify Suitable Business Data
some steps to help identify suitable business data for normalization:
1.Understand the Business Processes: Gain a deep understanding
of the business processes and operations that the database will support.
Identify the key entities, their attributes, and the relationships between them.
2.Conduct Stakeholder Interviews: Engage with stakeholders,
such as business owners, managers, and end-users, to gather their input on the
data requirements. Conduct interviews to understand their needs, pain points, and
how they interact with the data.
3. Review Existing Documentation: Examine any existing
documentation, such as business requirements documents, process flowcharts, or
data dictionaries
4.Analyze Sample Data: Analyze sample data sets to identify the different
types of data that need to be captured.
analysis will help determine the appropriate entities, attributes, and relationships
that should be included in the normalized database.
Identify Key Business Rules:
Understand the business rules that govern the data and its relationships.
These rules define the logic, constraints, and dependencies that shape the
data. Identify any unique constraints, mandatory fields, or conditional
relationships that need to be captured in the database design.
Consider Future Growth and Scalability:
Identify data elements that are likely to change or expand over time. This
includes considering potential new features, additional data sources, or
changes in business processes. By planning for future growth, you can
ensure that the normalized database can accommodate evolving business
needs without significant redesign or restructuring.
Collaborate with Database Experts:
Seek guidance from database experts or experienced database
administrators.
Remember, the goal of normalization is to eliminate redundancy and
improve data integrity. By carefully identifying suitable business data, you
can create a well-structured and efficient database that accurately represents
the business processes and supports the organization's goals
Understand Rules of Normalization
Normalization
 Normalization is a process of organizing the data in database to avoid
data redundancy, insertion anomaly, update anomaly & deletion
anomaly.
 The process of normalization is a formal method that avoid
unnecessary redundancy of data.
 It is the process of decomposing relations with anomalies to produce
smaller, well-structured relations and helps eliminate data
anomalies/problems
Normalization helps to eliminate these anomalies by organizing data into
well-structured tables, ensuring data dependencies are properly defined,
and reducing redundancy. By achieving higher levels of normalization, such
as 3NF or BCNF, the likelihood of anomalies occurring is minimized, and
data integrity is improved
Benefits of database normalization
 Reduced usage of storage space by intelligently categorizing data.
 It enables better, faster, stronger searches as it entails fewer entities to scan in
comparison with the earlier searches based on mixed entities.
 Improves data integrity: it splits all the data into individual entities yet building
strong linkages with the related data.
 More efficient database structure.
 Better understanding of data.
 More flexible database structure.
 Easier to maintain database structure.
 Few (if any) costly surprises down the road.
 Validates your common sense and intuition.
 Avoids redundant fields.
 Ensures that distinct tables exist when necessary
Anomalies in Normalization
Anomalies in normalization refer to inconsistencies or issues that can occur in a
database when it is not properly normalized.
These anomalies can affect data integrity, accuracy, and the ability to perform
efficient data operations.
There are three main types of anomalies that can occur:
Insertion Anomaly: An insertion anomaly happens when it is not
possible to insert a new record into a table without including
additional, unrelated data. This occurs when a table has attributes
that are functionally dependent on only a part of the primary key.
Update Anomaly: An update anomaly occurs when modifying data
in a table leads to inconsistencies or redundant updates in other
parts of the table. This happens when a table has redundant data or
dependencies between non-key attributes.
Deletion Anomaly: A deletion anomaly occurs when removing
data from a table unintentionally removes other related data that
should have been preserved. This happenswhen a table has
dependencies between attributes, and removing data leads to the
loss of other necessary data.
Normalization stages
•1NF - First normal form
•2NF - Second normal form
•3NF - Third normal form
•3.5NF - Boyce Codd Normal Form (BCNF)
•4NF - Fourth normal form
•5NF - Fifth normal form
note
The database community has developed a series of
guidelines for ensuring that databases are normalized.
These are referred to as normal forms
1. First normal form (1NF):Eliminating Repeating
Groups
Is the "basic" level of normalization, corresponds to the definition
of any database
It contains two-dimensional tables with rows and columns.
Each row represents a unique instance of that sub-object or
attribute and must be different in some way from any other row
(no duplicate rows are possible).
All entries in any column must be of the same kind.
For example, in the column labeled "Customer," only customer
names or numbers are permitted.
As per the rule of first normal form, an attribute (column)
of a table cannot hold multiple values.
 It should hold only atomic values.
Example 1: Develop 1NF of the following table
Student Details Course Details Result details
1001 Ram 11/09/1986 M4 Basic Math’s 7 11/11/2004 89 A
1002 Shyam 12/08/1987 M4 Basic Math’s 7 11/11/2004 78 B
1001 Ram 23/06/1987 H6 4 11/11/2004 87 A
1003 Sita 16/07/1985 C3 Basic Chemistry 11 11/11/2004 90 A
1004 Gita 24/09/1988 B3 8 11/11/2004 78 B
1002 Shyam 23/06/1988 P3 Basic Physics 13 11/11/2004 67 C
1005 Sunita 14/09/1987 P3 Basic Physics 13 11/11/2004 78 B
1003 Sita 23/10/1987 B4 5 11/11/2004 67 C
1005 Sunita 13/03/1990 H6 4 11/11/2004 56 D
1004 Gita 21/08/1987 M4 Basic Math’s 7 11/11/2004 78 B
The above table Student Details, Course Details and Result Details can be further divided.
 Student Details attribute is divided into Student#(Student Number), Student Name and date of birth.
 Course Details is divided into Course#, Course Name and duration.
 Results attribute is divided into Date ofexam, Marks and Grade.
2. (2NF): Eliminating Redundant Data
Meet all the requirements of the first normal form and
remove subsets of data that apply to multiple rows of a
table and place them in separate tables.
It requires that all non-key columns are fully dependent
on the entire primary key.
If the table has only a single-column primary key, this
requirement is easily met.
Each column in a table that is not a determiner of the
contents of another column must itself be a function of the
other columns in the table.
Create relationships between these new tables and their
predecessors through the use of foreign keys.
Has no partial dependency(occurs when there is a
composite key)
Example 2
Let us re-visit 1NF table structure.
 Student# is key attribute for Student,
 Course# is key attribute for Course
 Student# and Course# together form the composite key attributes
for result relationship.
 Other attributes are non - key attributes.
To make this table 2NF compliant, we have to remove all the
partial dependencies.
 Student Name and Date ofBirth depends only on student#.
 CourseName, Pre-Requisite and DurationInDays depends only on
Course#
 Date ofExam depends only on Course#.
To remove this partial dependency, we need to split
Student_Course_Result table into four separate tables, STUDENT,
COURSE, RESULT and EXAM_DATE tables as shown in the following:
STUDENT TABLE COURSE TABLE
Student # Student Name DateofBirth
1001 Ram Some value
1002 Shyam Some value
1003 Sita Some value
1004 Geeta Some value
1005 Sunita Some value
Course# Course Name Duration of days
C3 Bio Chemistry 3
B3 Botany 8
P3 Nuclear Physics 1
M4 Applied Mathematics 4
H6 American History 5
B4 Zoology 9
RESULT TABLE EXAMDATE TABLE
Student# Course# Marks Grade
1001 M4 89 A
1002 M4 78 B
1001 H6 87 A
1003 C3 90 A
1004 B3 78 B
1002 P3 67 C
1005 P3 78 B
1003 B4 67 C
1005 H6 56 D
Course# DateOfExam
M4 Some value
H6 Some value
C3 Some value
B3 Some value
P3 Some value
B4 Some value
 In STUDENT table, the key attribute is Student# and all other non-key
attributes, Student name and Date ofBirth are fully functionally dependent
on the key attribute.
 In COURSE table, the key attribute is Course# and all the non-key
attributes, Course name, Duration in days are fully functional dependent on
the key attribute.
 In RESULT table, the key attributes are #StudentCourse# together and all
other non-key attributes, Marks and Grade are fully functional dependent on
the key attributes.
 In EXAM DATE table, the key attribute is Course# and the non key attribute
Date of Exam is fully functionally dependent on the key attribute.
At first look it appears like all our anomalies are taken away! Now we are
storing Student 1003 and M4 record only once.
 We can insert prospective students and courses at our will.
 We will update only once if we need to change any data in STUDENT,
COURSE tables.
 We can get rid of any course or student details by deleting just one
row.
From the above table we conclude that
Let us analyze the RESULT Table
We already concluded that:
 All attributes are atomic in nature
 No partial dependency exists between the key attributes and non-key attributes
 RESULT table is in 2NF
Assume, at present, as per the university evaluation policy,
Students who score more than or equal to 80 marks are awarded with “A” grade
Students who score more than or equal to 70 marks up till 79 are awarded with “B” grade
Students who score more than or equal to 60 marks up till 69 are awarded with “C” grade
Students who score more than or equal to 50 marks up till 59 are awarded with “D” grade
The University management which is committed to improve the quality of
education wants to change the existing grading system to a new grading system. In
the present RESULT table structure,
 We don’t have an option to introduce new grades like A+, B- and E
 We need to do multiple updates on the existing record to bring them to new grading
definition
 We will not be able to take away “D” grade if we want to.
 2NF does not take care of all the anomalies and inconsistencies.
III . Third normal form (3NF): Eliminating Columns Not Dependent
on Keys
 Requires that there are no transitive dependencies, where one column
depends on another column which depends on the primary
 In order to perform first normalization rule, we have to consider
the following concepts
•Meet all the requirements of the second normal form.
•Remove columns that are not dependent upon the primary key.
•No transitive dependency exists between non-key attributes and key
attributes.
Example 3:In the above RESULT table Student# and Course# are the key
attributes. All other attributes, except grade are non-partially, non-transitively
dependent on key attributes. The grade attribute is dependent on “Marks “, and in
turn “Marks” is dependent on #Student#Course. To bring the table in 3NF, we
need to take off this transitive dependency.
Student# Course# Marks
1001 M4 89
1002 M4 78
1001 H6 87
1003 C3 90
1004 B3 78
1002 P3 67
1005 P3 78
1003 B4 67
1005 H6 56
1004 M4 78
UpperBound LowerBound Grade
100 95 A+
94 90 A
89 85 B+
84 80 B
79 75 B-
74 70 C
69 65 C-
After normalizing tables to 3NF, we got rid of all the anomalies and inconsistencies. Now we
can add new grade systems, update the existing one and delete the unwanted ones. Hence the
Third Normal form is the most optimal normal form and 99% of the databases which require
efficiency in
 INSERT, UPDATE and DELETE Operations are designed in this normal form
IV. Boyce-Codd Normal Form (BCNF or 3.5NF)
•The Boyce-Codd Normal form, also referred to as the "third and half (3.5)
normal form", adds one more requirement:
Meet all the requirements of the third normal form.
Every determinant must be a candidate key.
•Boyce Codd Normal Form (BCNF) is a further refinement of 3NF. A row is
in Boyce Codd normal form if and only if every determinant is a candidate
key.
•Most entities in 3NF are already in BCNF.
Fourth Normal Form (4NF)
 Fourth normal form (4NF) has one additional requirement:
 Meet all the requirements of the third normal form.
 A relation is in 4NF if it has no multi-valued dependencies.
 An entity is in Fourth Normal Form (4NF) if and only if it is in 3NF and has no
multiple sets of multi-valued dependencies. In other words, 4NF states that no
entity can have more than a single one-to-many relationship within an entity if the
one-to-many attributes are independent of each other.
Fifth Normal Form (5NF)
 5NF specifies that every join dependency for the entity must be a consequence of its
candidate keys.
Exercise on normalizations
Functional Dependency
 Is a relationship between two sets of attributes in a database table.
 It describes the dependency of one attribute (or a set of attributes) on another
attribute (or a set of attributes).
 Is denoted by an arrow
 In other words, if changing the value of one attribute determines the value of
another attribute(s), then a functional dependency exists.
Example: In a table called "Employees," if the attribute "EmployeeID"
determines the attribute "EmployeeName," it can be represented as: EmployeeID -
> EmployeeName. This means that for every value of EmployeeID, there is a
unique value of EmployeeName associated with it
Full Functional Dependency
 It occurs when an attribute is functionally dependent on the entire primary key of
a table, and not just a part of it.
 In other words, all non-key attributes depend on the entire primary key and not on
any subset of it.
Example: In a table called "Students," if the primary key is composed of "StudentID" and
"CourseID," and the attribute "Grade" depends on both of these attributes, it can be
represented as: StudentID, CourseID -> Grade. This means that for every combination of
StudentID and CourseID, there is a unique value of Grade associated with it.
Partial Dependency
 It occurs when an attribute is functionally dependent on only a part of the primary key,
rather than the entire primary key.
 It means that a non-key attribute depends on only a subset of the primary key, and not
on the entire primary key.
Example: In a table called "Orders," if the primary key is "OrderID," and the attributes
"CustomerName" and "CustomerAddress" depend on only the attribute "OrderID," it
indicates a partial dependency. This can be represented as: Ordered ->CustomerName,
CustomerAddress. To remove the partial dependency, the table can be split into two
separate tables: "Orders" and "Customers," where the customer details are stored
separately.
Transitive Dependency
 It occurs when an attribute depends on another non-key attribute, rather than directly
depending on the primary key.
 It means that the dependency is indirectly established through another attribute.
Example:
In a table called "Employees," if the primary key is "EmployeeID," and the attributes
"Department" and "DepartmentLocation" depend on each other, it indicates a
transitive dependency.
This can be represented as: EmployeeID -> Department -> DepartmentLocation. To
remove the transitive dependency, the table can be split into two separate tables:
"Employees" and "Departments," where the department details are stored separately.
2.3 Normalize business data and document results
 It involves the process of organizing and structuring the data in a
database to eliminate redundancy, improve data integrity, and reduce
anomalies.
 The goal is to ensure that each piece of data is stored in the most
efficient and logical manner.
The steps involved in normalization typically include:
1. Analyzing the data: The first step is to analyze the existing data in the
database. This involves identifying the various entities, attributes, and
relationships between them.
2. Applying normalization rules: Next, the data is normalized by applying
normalization rules, specifically the rules outlined in normal forms,
3. Breaking down tables: In order to meet the criteria for normalization forms,
it may be necessary to break down existing tables into multiple tables, with
each table focusing on a specific entity or relationship.
4. Resolving dependencies: During the normalization process, dependencies
between attributes are identified and resolved. This includes identifying and
eliminating partial dependencies and transitive dependencies.
5. Documenting the results: Once the normalization process is complete, it is
important to document the results.
This documentation includes the structure of the normalized tables, the
relationships between them, and any changes made to the original data model.
NOTE
By undertaking normalization of business data and documenting the results,
organizations can ensure that their databases are efficiently structured, leading to
improved data quality, easier data maintenance, and more effective data operations.
Cont.…
2.4 Compare normalization results with ER diagram
ER Diagram Normalization
A visual representation of the entities
(tables), attributes, and relationships
between them in a database.
Is a set of rules and guidelines used to
eliminate redundancy, improve data
integrity, and reduce anomalies in a
database.
It helps in understanding the structure
and organization of the data, as well as
the dependencies between different
entities
It involves breaking down tables,
resolving dependencies, and organizing
data into well-structured tables.
Includes entity boxes, attribute labels,
and lines representing the relationships
between entities.
We would ensure that the foreign keys in
the normalized tables correctly establish
the relationships between entities.
By comparing the normalization results with the ER diagram, we can validate the
accuracy and consistency of the database design, ensuring that the normalized tables
effectively capture the structure and relationships depicted in the ER diagram.
2.5 Reconcile differences between data
 It refers to the process of resolving conflicts or inconsistencies that
may arise during the normalization process.
 These conflicts can occur when attempting to organize and
structure data into normalized tables, especially when there are
dependencies or relationships between attributes and entities.
key points to understand about reconciling differences between data
in normalization
1. Identify Inconsistencies: The first step is to identify any inconsistencies or
conflicts within the data. This may involve analyzing the relationships,
dependencies, and functional dependencies between attributes and entities.
2. Analyze Dependencies:
 Evaluate the dependencies between attributes and entities to determine if they are
accurately represented.
 This includes identifying partial dependencies (where an attribute depends on only a part
of the primary key) or transitive dependencies (where an attribute depends on another
non-key attribute).
3. Normalize Data:
 This may involve breaking down tables, creating separate tables for related
entities, and defining appropriate primary and foreign keys.
4. Resolve Conflicts: Address any conflicts or inconsistencies that arise during the
normalization process. This may involve making decisions on how to handle partial
dependencies or transitive dependencies
5. Ensure Data Integrity:
. It also involves ensuring that there are no duplicate or redundant data.
6. Validate Results:
This can be done by comparing the normalized tables with the original data,
verifying that the relationships and dependencies are accurately represented.
Data model validation
3
3.1 Validation of data model with client
 It refers to the process of confirming the accuracy, completeness, and
appropriateness of the data model design in collaboration with the client or
stakeholders.
 Validation ensures that the model meets its intended requirements in terms
of the methods employed and the results obtained
 The ultimate goal of model validation is to make the model useful in the
sense that the model addresses the right problem, provides accurate
information about the system being modeled, and to makes the model
actually used.
Few key points to understand about validating the data
model with the client:
Collaboration
 The validation process involves close collaboration with the client or
stakeholders.
 It is essential to actively involve them throughout the data modeling process,
from the initial requirements gathering to the final validation stage.
Requirements Alignment:
The data model should align with the client's requirements and objectives.
Review and Feedback:
 Present the data model to the client for review and feedback.
 This can be done through meetings, presentations, or documentation.
 The client should have the opportunity to evaluate the data model and provide
input, suggestions, or corrections based on their understanding and needs.
Accuracy and Completeness
 This includes verifying that all necessary entities, attributes, relationships, and
constraints have been properly captured in the data model.
Consistency and Usability
 Ensure that the data model is consistent, organized, and easy to understand.
 It should follow established conventions and best practices in database design.
 The client should be able to navigate and comprehend the data model easily, facilitating
effective communication and decision-making.
Iterative Process:
 Validating the data model is typically an iterative process.
 It may involve multiple rounds of review and revision based on client feedback.
 Each iteration aims to refine and improve the data model until it meets the client's
requirements and expectations.
Documentation:
 Document any changes, modifications, or clarifications made during the validation
process.
3.2 Resolve arising issues or recommendations
Key steps to follow Resolve arising issues or recommendations
Identify the Issue: The first step is to identify and understand the specific issue or
challenge at hand. This could be related to performance, security, scalability, user
experience, or any other aspect of web development or database administration.
Gather Information: Collect relevant data and information related to the issue. This may
include analyzing system logs, monitoring metrics, user feedback, or conducting
performance tests.
Analyze the Root Cause:
 Conduct a thorough analysis to determine the underlying cause of the issue.
 The goal is to identify the root cause so that appropriate measures can be taken.
Propose Solutions:
 Based on the analysis, propose potential solutions to address the issue.
 This could involve making changes to the code, optimizing database queries,
adjusting system configurations, enhancing security measures, or implementing
new technologies.
Implement and Test:
 Once a solution is chosen, implement the necessary changes or improvements.
 Ensure thorough testing is conducted to verify that the issue has been resolved
and that the system is functioning as expected.
 This may involve unit testing, integration testing, load testing, or any other
relevant testing methods.
Monitor and Iterate:
 Continuously monitor the system after implementing the solution.
 Keep an eye on performance metrics, user feedback, and any new issues that
may arise.
 If necessary, iterate on the solution or make further adjustments to optimize
the system's performance and address any new challenges.
Document and Communicate:
 Document the issue, solution, and any changes made for future reference.
Communicate the findings and recommendations to relevant stakeholders,
such as developers, database administrators, project managers, or clients.
 This ensures that everyone is aware of the actions taken and the impact on
the system.
3.3 Documentation of completed data model
 Is crucial for maintaining a clear and comprehensive record of the data
model's structure, relationships, and constraints. This documentation
serves as a valuable reference for developers, database administrators, and
other stakeholders involved in the project.
key components to include when documenting a completed data model:
 Entity Relationship Diagram (ERD):
This diagram provides a clear overview of the data model's structure
and helps stakeholders understand the relationships between entities.
 Entity Descriptions
 Provide detailed descriptions of each entity in the data model. Include
information such as the entity's purpose, key attributes, and any constraints or
business rules associated with it.
 This description helps stakeholders understand the role and significance of
each entity in the system.
 Attribute Definitions
 Document the attributes present in each entity, including their names, data
types, lengths, and any applicable constraints (such as primary keys, foreign
keys, or unique constraints).
 This information helps ensure consistency and accuracy when working with
the data model.
 Relationship Descriptions
 Describe the relationships between entities, including their types (such as one-
to-one, one-to-many, or many-to-many) and any constraints or rules that apply
to them
 Data Constraints
 Document any additional constraints or rules that apply to the data model, such
as domain constraints, referential integrity rules, or check constraints.
 These constraints ensure the data remains valid and consistent throughout the
system.
 Indexes and Performance Considerations
 This information helps developers and administrators optimize query
performance and improve overall system efficiency.
 Data Dictionary
 Create a data dictionary that provides a centralized reference for all the entities,
attributes, relationships, and constraints in the data model.
 This dictionary should include clear definitions and explanations of each
element, serving as a comprehensive guide for anyone working with the data
model.
 Version Control and Change History
 Maintain a version control system to track changes made to the data model over
time.
 This ensures transparency and helps with future troubleshooting or system
audits.
 Diagram Notations and Conventions
 Include a section that explains the notations and conventions used in the data
model documentation.
 This helps ensure consistency and understanding among team members who
3.4 Client approval submission
Steps to follow when submitting the modeling data object to the client for
final approval:
 Prepare the Presentation
 Create a clear and concise presentation of the modeling data object.
 This may include visual representations such as entity-relationship diagrams,
data flow diagrams, or any other relevant diagrams to help the client understand
the structure and relationships of the data model.
 Explain the Purpose and Benefits
Highlight the benefits and advantages of the data model, such as improved data organization,
increased efficiency, or enhanced reporting capabilities.
Walkthrough the Data Model:
Explain the entities, attributes, relationships, and any constraints or rules that have
been incorporated.
 Address Questions and Concerns
 This ensures that the client has a clear understanding of the data model and can
make an informed decision.
 Discuss Potential Revisions or Modifications
 If the client raises any concerns or suggests changes to the data model, engage in
a constructive discussion.
 Consider their feedback and evaluate the feasibility and impact of the proposed
revisions. Collaborate with the client to find the most appropriate solutions.
 Document Client Feedback
 Document any feedback or changes requested by the client during the
presentation.
 This serves as a reference for future discussions and helps ensure that the final
data model accurately reflects the client's requirements.
 Seek Approval:
 Once the presentation and discussion are complete, formally request the client's
approval of the modeling data object.
 Address Final Revisions
 If the client requests any final revisions or modification, incorporate them into
the data model as agreed upon.
 Document these changes and ensure that they align with the client's
expectations.
 Obtain Signed Approval
 This can be in the form of a signed document or an email confirming their
acceptance of the data model.
Maintain Documentation
 Keep a copy of the approved data model, along with any related
documentation, for future reference.
 This ensures that there is a record of the agreed-upon data model and provides
a basis for any future updates or enhancements.
NOTE
 Submitting the modeling data object to the client for final approval is a critical
step in the data modeling process.
 It ensures that the client is satisfied with the proposed solution and provides a
basis for moving forward with implementation.
 Effective communication, collaboration, and documentation are the key to
successfully obtaining client approval and ensuring the data model meets their
requirements.
THE END!!
Thank YOU!!

model data objects concepts of entitty.pptx

  • 1.
    Kombolcha poly techniccollege Sector of ICT WDDBA level III Module Title: Model Data Object Module code: EIS WDDBA3 M02 1123 September 2024 Prepared by Haile sitotaw
  • 2.
    Conceptual data model 1 2 3 4 5 Learningoutcomes Normalization 2 Data model validation 3 Nominal duration:50Hours
  • 3.
    Conceptual data model 1 Thisunit will also assist you to attain the learning outcomes stated in the cover page. Specifically, upon completion of this learning guide, you will be able to:  Understand and analyze business operations  Understand scope of the system  Identify and define entities, attributes, data types and relationships  Review business rules to determine impact  Document relationships in an entity relationship diagram
  • 4.
    1.1. Analysis ofbusiness data operations I. Understanding Business operations  Business operations are those ongoing cyclic activities involved in the running of a business for the purpose of producing value.  The outcome of business operations is the harvesting of value from assets owned by a business. Three fundamental management imperatives for Business operations 1. Generate recurring income 2. Increase the value of the business assets 3. Secure the income and value of the business II. Analyzing Business operations  Operational analysis is a business approach that is used to understand and develop operational processes.  It is a technique of probing into the present and past performance of an operational investment.
  • 5.
     It measuresthe performance against particular standard costs, operations and services. It also considers how goals can be achieved in a better way, how cost effectively they can be achieved.  It answers the questions related to the areas of:  Customer Results: tries to determine whether the investment is delivering planned goods and services or not.  Strategic and Business Results: It analyses whether the current investment level is sufficient to get the job done.  Financial Performance: analyses whether the cost is compatible with the performance.  Innovation: It finds solutions to the questions: o How can the customers needs be satisfied in a better way and at a lower cost?; o How can technology be best used to provide better services at lower cost? etc.
  • 6.
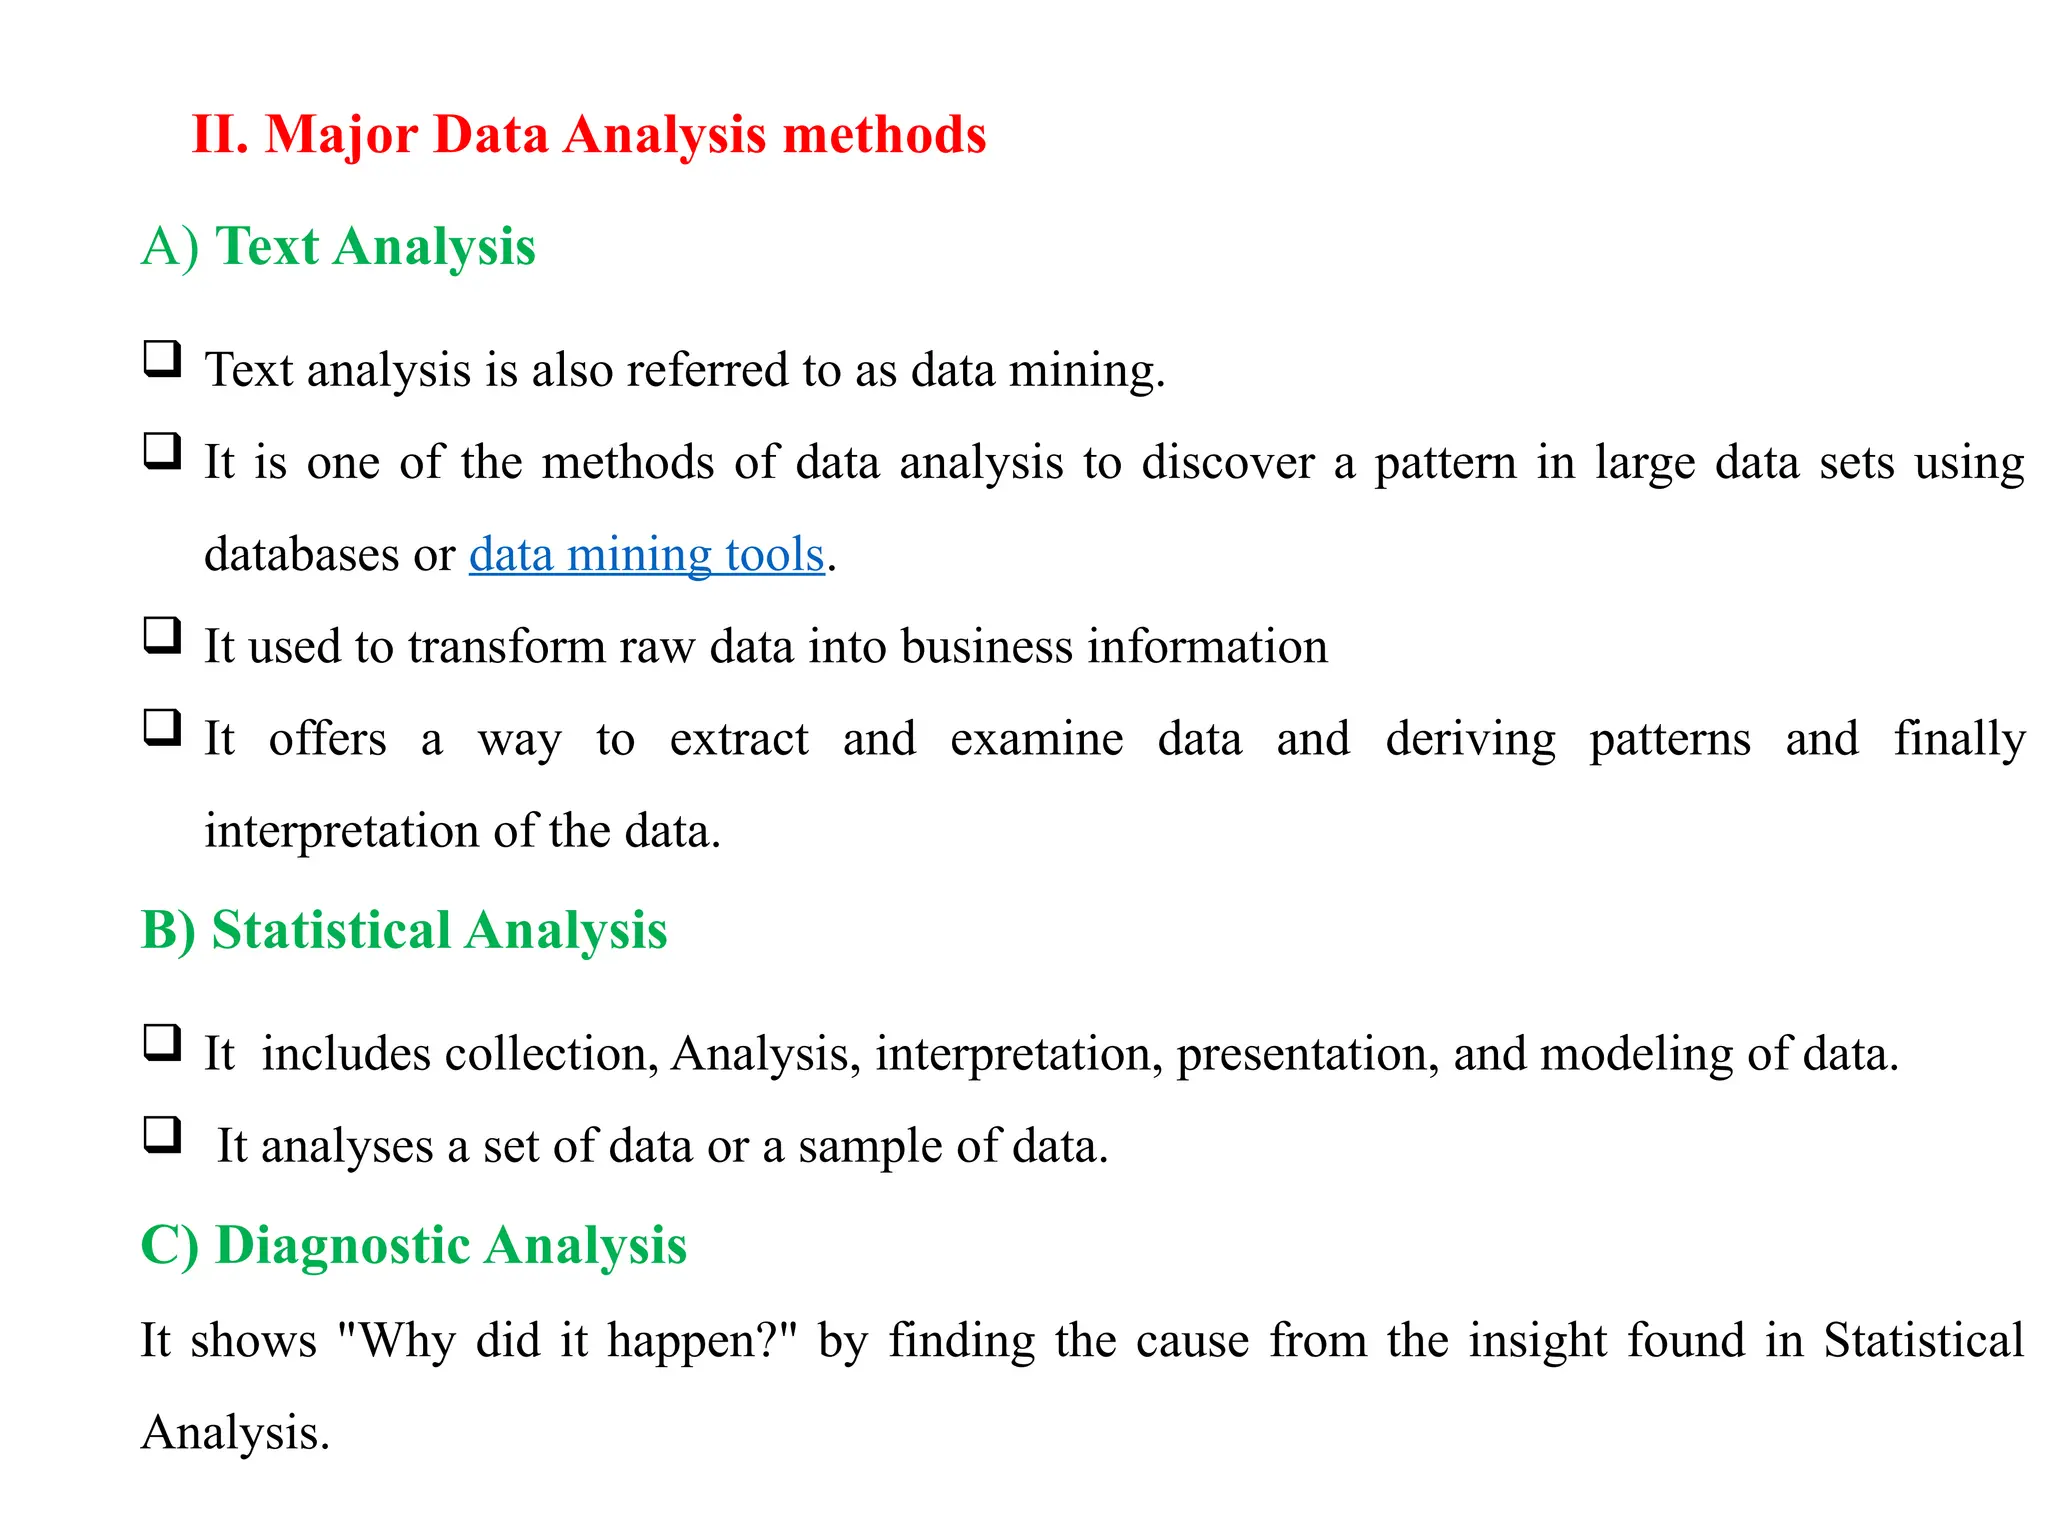
    II. Major DataAnalysis methods A) Text Analysis  Text analysis is also referred to as data mining.  It is one of the methods of data analysis to discover a pattern in large data sets using databases or data mining tools.  It used to transform raw data into business information  It offers a way to extract and examine data and deriving patterns and finally interpretation of the data. B) Statistical Analysis  It includes collection, Analysis, interpretation, presentation, and modeling of data.  It analyses a set of data or a sample of data. C) Diagnostic Analysis It shows "Why did it happen?" by finding the cause from the insight found in Statistical Analysis.
  • 7.
    D) Predictive Analysis It shows "what is likely to happen" by using previous data.  This Analysis makes predictions about future outcomes based on current or past data. Forecasting is just an estimate.  Its accuracy is based on how much detailed information you have and how much you dig in it. E) Prescriptive Analysis  Combines all previous Analysis to determine which action to take in a current problem or decision.  Most data driven companies are utilizing Prescriptive Analysis because predictive analysis are not enough to improve data performance.  Based on current situations and problems, they analyze the data and make decisions.
  • 8.
    2.Scope of thesystem 1.Define the System Scope It defines what the system/project will and will not include, in enough detail to clearly communicate to all participants. The scope must be a complete definition encompassing all types of requirements:  functional requirement  non-functional requirement  pseudo requirement The conceptual or scoping model defines the boundaries of the system (i.e., what is in scope and what is out of scope).
  • 9.
    It identifies:  Eventsoutside the system that cause the system to react,  Actors outside the system that interact with the system,  Information that flows between the system and the actors outside the system,  Major functions included in the system,  User population.
  • 10.
    II. Clarify SystemBoundaries The boundaries identify where the system to be sized starts and ends. The sizing should include everything for which the team is responsible. A scope of a system is identified based on the following  Databases  Applications  Servers  Operating systems  Gateways  Application service provider and  ISP (Internet service provider)
  • 11.
    Entities, attributes, datatypes and relationships of data A. Entity An entity is an existing or real thing. Is a single person, place, or thing about which data can be stored. ex. school, student, course, department, employee, university. Considered as container that holds all instances of a particular thing in a system. Entities are equivalent to database tables in a relational database, with each row of the table representing an instance of that entity.
  • 12.
  • 13.
    Entity type  Anentity type is a collection of entity instances sharing similar properties;  Two entity type instances are considered equal only if they are of the same type and the values of their entity keys are the same.  The entity type is the fundamental building block for describing the structure of data with the Entity Data Model (EDM). Example: The diagram below shows a conceptual model with three entity types: Book, Publisher, and Author:
  • 14.
    Entity set It isset of entities of the same type (e.g., all persons having an account at a bank) An entity set is a logical container for instances of an entity type and instances of any type derived from that entity type. The relationship between an entity type and an entity set is analogous to the relationship between a row and a table in a relational database: Like a row, an entity type describes data structure, and, Like a table, an entity set contains instances of a given structure. Example Branch: the set of all branches of a particular bank. Each branch is described by the attributes w Those are: Branch-name, branch-city and assets.
  • 15.
    Customer: the setof all people having an account at the bank. Attributes are ID, name, Gender, Gender and Phone-number. Figure 1.5Entity examples 2
  • 16.
    Classification of Entity StrongEntity  An entity set that has a primary key is termed as strong entity. Weak Entity  an entity set that does not have sufficient attributes to form a primary key. The existence of a weak entity depends on the existence of stored entity.  The discriminator (partial key) is used to identify other attributes of a weak entity set. Recursive Entity  Is one in which a relation can exist between occurrences of the same entity set. This occurs in a unary relationship. Composite Entities  If a Many to Many relationship exist we must create a bridge entity to convert into 1 to many.  Bridge entity composed of the primary keys of each of the entities to be connected.  The bridge entity is known as a composite entity.
  • 17.
    Attribute  A factor/property/characteristicthat describes an entity Example: (Colour: attribute of your hair/skin/cloth) Employee’s name, age, address, salary and job: attribute of Employee, etc.  Is represented by oval shape Types of Attributes  Simple and Composite Attribute Simple attribute: consist of a single atomic value that can’t be subdivided. (For example, age, sex etc.). Composite attribute: can be further subdivided. (E.g.,ADDRESS can be subdivided into city, Sub-city, Woreda, region, House No., etc.)  Single Valued and Multi Valued attribute Single valued: can have only one or a single value. For example, a person can have only one 'date of birth', 'age', etc. But it can be simple or composite attribute Name Fname Lname
  • 18.
    Example: 'date ofbirth' is a composite attribute; 'age' is a simple attribute. But both are single valued attributes. Multi-valued: can have multiple values. For instance, a person may have multiple phone numbers, multiple degrees etc. Multi-valued attributes are shown by a double line connecting to the entity in the ER diagram.  Stored and Derived Attributes Stored attribute: supplies a value to the related attribute. (e.g., 'Date of birth') Derived attribute: the value is derived from the stored attribute. (e.g., the value of 'AGE' can be derived by subtracting the 'Date of Birth'(DOB) from the current date.  Complex Attribute: attribute that is both composite and multi valued. (e.g., Phone no)
  • 20.
    Selecting Attributes forEntities: choose ones that have the following qualities: Significant: Include only attributes that are useful to the database users. Direct: not derived. Derived data complicates the maintenance of a database. Non-decomposable: An attribute can contain only single values, never lists or repeating groups. Composite values must be separated into individual attributes. Contain data of the same type: For example, you would want to enter only date values in a birthday attribute, not names or telephone numbers.
  • 21.
    Entity Key A propertyor a set of properties of an entity type that are used to determine identity. Value of entity key must uniquely identify an entity type instance within an entity set. Requirements of entity key: No two entity keys within an entity set can be identical. That is, for any two entities within an entity set, the values for all of the properties that constitute a key can’t be the same. An entity key must consist of a set of non-null, immutable, primitive type properties. The properties that make up an entity key can’t change. You cannot allow more than one possible entity key for a given entity type; surrogate keys aren’t supported.
  • 22.
    Types of keys Super/CandidateKey: is a field or combination of fields, can act as a primary key for a table to uniquely identify each record. Every entity in relational database must have at least one candidate key but it is possible to have two or more. (Example: social security number, employee number or driver license number may identify an employee. All of them are considered candidate keys) Primary Key: is an attribute or set of attributes that uniquely identifies one entity from the other. Every entity must have a primary key. It is a candidate key chosen as the main method of uniquely identifying a row. Alternate key - is any candidate key which is not selected to be the primary key Foreign Key: references a particular attribute of an entity containing the corresponding primary key. These keys are used to create relationships between tables. (For example, an employee entity with employee number as its primary key and department entity with department number as its primary key can be related to each other through employee number. Therefore, employee number will be a foreign key for department and primary key for employee).
  • 23.
    Compound/Composite Key: ACombination of more than one column identifying records of a table uniquely. 3 Key Terms Conceptual Entity Relationship Diagram: The highest-level view of the entity relationship diagram, which contains little detail and is solution agnostic. This level of modeling establishes the entities, and their relationships, and defines consistent terminology of the business information. Logical Entity Relationship Diagram: Contains mid-level detail. Attributes are introduced and operational, transactional, and business rules are defined in this model. This entity relationship diagram level defines the structure of the data elements and the relationships between them. Physical Entity Relationship Diagram: Provides the most detail. Physical entity relationship diagrams describe the database-specific implementation of the model and illustrate non-functional requirements such as performance, concurrency, and security.
  • 24.
    Database: A structuredcollection of information. Usually organized so that data can be easily stored to allow for prompt research, retrieval, and updating. Adjective: Attributes that describe or provide details about the entity. For example, a student (noun) might have attributes such as name, age, and address. Note, the term "adjective" is used loosely with the concept of ERDs as many attributes are formally nouns. Noun (common or proper): Entity type of person, object, concept, or event. For example, a person entity relevant to school enrollment would be a "student". Verb: Relationship types between entities such as enroll. For example, a student (entity) would "enroll" in a course (entity).
  • 25.
    Data Types Database datatypes refer to the format of data storage that can hold a distinct type or range of values. Integer – is a whole number that can have a positive, negative or zero value. It cannot be a fraction nor can have decimal places. Character – refers to any number, letter, space or symbol that can be entered in a computer. Each character occupies one byte of space. String – is used to represent text. It is composed of a set of characters that can have spaces and numbers. Strings are enclosed in quotation marks to identify the data as string and not a variable name nor a number. Floating Point Number – is a number that contains decimals. Numbers that contain fractions are also considered as floating-point numbers. Array – contains a group of elements which can be of the same data type like an integer or string. It is used to organize data for easier sorting and searching of related set of values. Varchar – as the name implies is variable character as the memory storage has variable length. Each character occupies one byte of space plus 2 bytes for length information. Boolean – is used for creating true or false statements. To compare values the following operators are being used: AND, OR, XOR, and NOT.
  • 26.
    Relationship  It isan association between entities, captures how entities are related to one another. Relationships can be thought of as verbs, linking two or more nouns.  A relationship is how the data is shared between entities.  Are represented by lines between entities, lines indicate that each instance of an entity may have a relationship with instances of the connected entity, and vice versa.  Is represented by Diamond symbol The diagram above indicates that students may have some relationship with schools.
  • 27.
    Relationship and Entity:can both have attributes. Examples: an employee entity might have a Social Security Number (SSN) attribute; the proved relationship may have a date attribute. Two related entities An entity with an attribute A relationship with an attribute Figure Relation with entity
  • 28.
    There are fourtypes of relationships between entities: Cardinality: Defines the numerical attributes of the relationship between two entities or entity sets One-to-one (1:1): one instance of an entity (A) is associated with one other instance of another entity (B). For example, in a database of employees, each employee name (A) is associated with only one social security number (B).
  • 29.
    One-to-many (1: N): Anyone entity instance from the primary entity can be referenced by many entity instances from the related entity. One instance of an entity (A) is associated with zero, one or many instances of another entity (B), but for one instance of entity B there is only one instance of entity (A). Example, for a company with all employees working in one building, the building name (A) is associated with many different employees (B), but those employees all share the same singular association with entity Figure 1.11 one to many relations
  • 30.
     Many entityinstances from the related entity can reference any one entity instance from the primary entity Many-to-one (N: 1) Figure 1.13 many to one relation
  • 31.
    Many-to-many (N: N) Amany-to-many relationship lets users relate one or more entity instances from another entity to an entity instance of the current entity Figure 1.13 many to many relations
  • 32.
    notation symbols ofrelationships
  • 33.
    Review business rules Businessrule  It is a rule of a business, company, or corporation that defines or constrains some aspect of business and always resolves to either true or false.  It is a statement that defines or constrains some aspect of the business, intended to assert business structure, to control/influence behavior of the business.  Describes the operations, definitions and constraints that apply to an organization.  Tells an organization what it can do in detail, provides detailed guidance about how a strategy can be translated to action. . Example: rent rules, payment rules, service rules, attendance rules, product rules, etc.
  • 34.
    Documentation of entity relationshipdiagram Overview of data modeling:  It is an abstract model that documents and organizes the business data for communication between team members and is used as a plan for developing applications, specifically how data are stored and accessed.  It determines the structure of data or structured data. Typical applications of data models include database models, design of information systems and enabling exchange of data
  • 35.
    Entity – RelationshipDiagram (ERD)  An ERD, or entity relationship diagram, is a type of flowchart that helps you clearly visualize your database design by showing how the "entities" in the system relate to one another.  It is an abstract way to describe a database.  It is a visual representation of different data using conventions that describe how these data are related to each other. For example, the elements writer, novel, and consumer may be described using ERD this
  • 36.
  • 37.
    There are threebasic elements in an ER Diagram: entity, attribute, relationship. There are more elements which are based on the main elements. They are weak entity, multi-valued attribute, derived attribute, weak relationship and recursive relationship. Entity: An entity can be a person, place, event, or object that is relevant to a given system. For example, a school system may include students, teachers, major courses, subjects, fees, and other items. Represented in ERD by a rectangle and named using singular nouns. Weak Entity: is an entity that depends on the existence of another entity. In more technical terms it can defined as an entity that can’t be identified by its own attributes. Example: The order item will be meaningless without an order so it depends on the existence of order.
  • 38.
    Student ID Nam e Ag e Level Sect ion Attribute:  An attributeis a property, trait, or characteristic of an entity, relationship, or another attribute.  An entity can have as many attributes as necessary.  Attributes are represented by oval shapes. (For example: a student entity may have attributes such as Name, Roll no and Age)
  • 39.
    Composite attributes: Attributes havingtheir own specific attributes. For example: the attribute “customer address” can have the attributes number, street, city, and state. Figure 1.17 Composite attribute Multi-valued Attribute: If an attribute can have more than one value. For example, a teacher entity can have multiple subject values.
  • 40.
    Figure 1.18 Multi-valuedattribute Derived Attribute: An attribute based on another attribute, found rarely in ER diagrams. For example, for a circle the area can be derived from the radius. Figure 1.189 Derived attribute
  • 41.
    Relationship: A relationship describeshow entities interact. For example, the entity “carpenter” may be related to the entity “table” by the relationship “builds” or “makes”. Relationships are represented by diamond shapes and are labeled using verbs. Recursive Relationship: If the same entity participates more than once in a relationship it is known as recursive relationship. Figure 1.21 Recursive relationships
  • 42.
    2 Normalization This unitwill also assist you to attain the learning outcomes stated in the cover page. Specifically, upon completion of this learning guide, you will be able to:  Understand and analyze business data  Understand rules of normalization  Understand benefits of normalization  Contrast normalization results with ER diagram  Understand how to conform differences between data
  • 43.
    Identify Suitable BusinessData some steps to help identify suitable business data for normalization: 1.Understand the Business Processes: Gain a deep understanding of the business processes and operations that the database will support. Identify the key entities, their attributes, and the relationships between them. 2.Conduct Stakeholder Interviews: Engage with stakeholders, such as business owners, managers, and end-users, to gather their input on the data requirements. Conduct interviews to understand their needs, pain points, and how they interact with the data. 3. Review Existing Documentation: Examine any existing documentation, such as business requirements documents, process flowcharts, or data dictionaries 4.Analyze Sample Data: Analyze sample data sets to identify the different types of data that need to be captured. analysis will help determine the appropriate entities, attributes, and relationships that should be included in the normalized database.
  • 44.
    Identify Key BusinessRules: Understand the business rules that govern the data and its relationships. These rules define the logic, constraints, and dependencies that shape the data. Identify any unique constraints, mandatory fields, or conditional relationships that need to be captured in the database design. Consider Future Growth and Scalability: Identify data elements that are likely to change or expand over time. This includes considering potential new features, additional data sources, or changes in business processes. By planning for future growth, you can ensure that the normalized database can accommodate evolving business needs without significant redesign or restructuring. Collaborate with Database Experts: Seek guidance from database experts or experienced database administrators. Remember, the goal of normalization is to eliminate redundancy and improve data integrity. By carefully identifying suitable business data, you can create a well-structured and efficient database that accurately represents the business processes and supports the organization's goals
  • 45.
    Understand Rules ofNormalization Normalization  Normalization is a process of organizing the data in database to avoid data redundancy, insertion anomaly, update anomaly & deletion anomaly.  The process of normalization is a formal method that avoid unnecessary redundancy of data.  It is the process of decomposing relations with anomalies to produce smaller, well-structured relations and helps eliminate data anomalies/problems Normalization helps to eliminate these anomalies by organizing data into well-structured tables, ensuring data dependencies are properly defined, and reducing redundancy. By achieving higher levels of normalization, such as 3NF or BCNF, the likelihood of anomalies occurring is minimized, and data integrity is improved
  • 46.
    Benefits of databasenormalization  Reduced usage of storage space by intelligently categorizing data.  It enables better, faster, stronger searches as it entails fewer entities to scan in comparison with the earlier searches based on mixed entities.  Improves data integrity: it splits all the data into individual entities yet building strong linkages with the related data.  More efficient database structure.  Better understanding of data.  More flexible database structure.  Easier to maintain database structure.  Few (if any) costly surprises down the road.  Validates your common sense and intuition.  Avoids redundant fields.  Ensures that distinct tables exist when necessary
  • 47.
    Anomalies in Normalization Anomaliesin normalization refer to inconsistencies or issues that can occur in a database when it is not properly normalized. These anomalies can affect data integrity, accuracy, and the ability to perform efficient data operations. There are three main types of anomalies that can occur: Insertion Anomaly: An insertion anomaly happens when it is not possible to insert a new record into a table without including additional, unrelated data. This occurs when a table has attributes that are functionally dependent on only a part of the primary key. Update Anomaly: An update anomaly occurs when modifying data in a table leads to inconsistencies or redundant updates in other parts of the table. This happens when a table has redundant data or dependencies between non-key attributes. Deletion Anomaly: A deletion anomaly occurs when removing data from a table unintentionally removes other related data that should have been preserved. This happenswhen a table has dependencies between attributes, and removing data leads to the loss of other necessary data.
  • 52.
    Normalization stages •1NF -First normal form •2NF - Second normal form •3NF - Third normal form •3.5NF - Boyce Codd Normal Form (BCNF) •4NF - Fourth normal form •5NF - Fifth normal form note The database community has developed a series of guidelines for ensuring that databases are normalized. These are referred to as normal forms
  • 53.
    1. First normalform (1NF):Eliminating Repeating Groups Is the "basic" level of normalization, corresponds to the definition of any database It contains two-dimensional tables with rows and columns. Each row represents a unique instance of that sub-object or attribute and must be different in some way from any other row (no duplicate rows are possible). All entries in any column must be of the same kind. For example, in the column labeled "Customer," only customer names or numbers are permitted. As per the rule of first normal form, an attribute (column) of a table cannot hold multiple values.  It should hold only atomic values.
  • 55.
    Example 1: Develop1NF of the following table Student Details Course Details Result details 1001 Ram 11/09/1986 M4 Basic Math’s 7 11/11/2004 89 A 1002 Shyam 12/08/1987 M4 Basic Math’s 7 11/11/2004 78 B 1001 Ram 23/06/1987 H6 4 11/11/2004 87 A 1003 Sita 16/07/1985 C3 Basic Chemistry 11 11/11/2004 90 A 1004 Gita 24/09/1988 B3 8 11/11/2004 78 B 1002 Shyam 23/06/1988 P3 Basic Physics 13 11/11/2004 67 C 1005 Sunita 14/09/1987 P3 Basic Physics 13 11/11/2004 78 B 1003 Sita 23/10/1987 B4 5 11/11/2004 67 C 1005 Sunita 13/03/1990 H6 4 11/11/2004 56 D 1004 Gita 21/08/1987 M4 Basic Math’s 7 11/11/2004 78 B The above table Student Details, Course Details and Result Details can be further divided.  Student Details attribute is divided into Student#(Student Number), Student Name and date of birth.  Course Details is divided into Course#, Course Name and duration.  Results attribute is divided into Date ofexam, Marks and Grade.
  • 56.
    2. (2NF): EliminatingRedundant Data Meet all the requirements of the first normal form and remove subsets of data that apply to multiple rows of a table and place them in separate tables. It requires that all non-key columns are fully dependent on the entire primary key. If the table has only a single-column primary key, this requirement is easily met. Each column in a table that is not a determiner of the contents of another column must itself be a function of the other columns in the table. Create relationships between these new tables and their predecessors through the use of foreign keys. Has no partial dependency(occurs when there is a composite key)
  • 57.
    Example 2 Let usre-visit 1NF table structure.  Student# is key attribute for Student,  Course# is key attribute for Course  Student# and Course# together form the composite key attributes for result relationship.  Other attributes are non - key attributes. To make this table 2NF compliant, we have to remove all the partial dependencies.  Student Name and Date ofBirth depends only on student#.  CourseName, Pre-Requisite and DurationInDays depends only on Course#  Date ofExam depends only on Course#. To remove this partial dependency, we need to split Student_Course_Result table into four separate tables, STUDENT, COURSE, RESULT and EXAM_DATE tables as shown in the following:
  • 58.
    STUDENT TABLE COURSETABLE Student # Student Name DateofBirth 1001 Ram Some value 1002 Shyam Some value 1003 Sita Some value 1004 Geeta Some value 1005 Sunita Some value Course# Course Name Duration of days C3 Bio Chemistry 3 B3 Botany 8 P3 Nuclear Physics 1 M4 Applied Mathematics 4 H6 American History 5 B4 Zoology 9 RESULT TABLE EXAMDATE TABLE Student# Course# Marks Grade 1001 M4 89 A 1002 M4 78 B 1001 H6 87 A 1003 C3 90 A 1004 B3 78 B 1002 P3 67 C 1005 P3 78 B 1003 B4 67 C 1005 H6 56 D Course# DateOfExam M4 Some value H6 Some value C3 Some value B3 Some value P3 Some value B4 Some value
  • 59.
     In STUDENTtable, the key attribute is Student# and all other non-key attributes, Student name and Date ofBirth are fully functionally dependent on the key attribute.  In COURSE table, the key attribute is Course# and all the non-key attributes, Course name, Duration in days are fully functional dependent on the key attribute.  In RESULT table, the key attributes are #StudentCourse# together and all other non-key attributes, Marks and Grade are fully functional dependent on the key attributes.  In EXAM DATE table, the key attribute is Course# and the non key attribute Date of Exam is fully functionally dependent on the key attribute. At first look it appears like all our anomalies are taken away! Now we are storing Student 1003 and M4 record only once.  We can insert prospective students and courses at our will.  We will update only once if we need to change any data in STUDENT, COURSE tables.  We can get rid of any course or student details by deleting just one row. From the above table we conclude that
  • 60.
    Let us analyzethe RESULT Table We already concluded that:  All attributes are atomic in nature  No partial dependency exists between the key attributes and non-key attributes  RESULT table is in 2NF Assume, at present, as per the university evaluation policy, Students who score more than or equal to 80 marks are awarded with “A” grade Students who score more than or equal to 70 marks up till 79 are awarded with “B” grade Students who score more than or equal to 60 marks up till 69 are awarded with “C” grade Students who score more than or equal to 50 marks up till 59 are awarded with “D” grade The University management which is committed to improve the quality of education wants to change the existing grading system to a new grading system. In the present RESULT table structure,  We don’t have an option to introduce new grades like A+, B- and E  We need to do multiple updates on the existing record to bring them to new grading definition  We will not be able to take away “D” grade if we want to.  2NF does not take care of all the anomalies and inconsistencies.
  • 61.
    III . Thirdnormal form (3NF): Eliminating Columns Not Dependent on Keys  Requires that there are no transitive dependencies, where one column depends on another column which depends on the primary  In order to perform first normalization rule, we have to consider the following concepts •Meet all the requirements of the second normal form. •Remove columns that are not dependent upon the primary key. •No transitive dependency exists between non-key attributes and key attributes. Example 3:In the above RESULT table Student# and Course# are the key attributes. All other attributes, except grade are non-partially, non-transitively dependent on key attributes. The grade attribute is dependent on “Marks “, and in turn “Marks” is dependent on #Student#Course. To bring the table in 3NF, we need to take off this transitive dependency.
  • 62.
    Student# Course# Marks 1001M4 89 1002 M4 78 1001 H6 87 1003 C3 90 1004 B3 78 1002 P3 67 1005 P3 78 1003 B4 67 1005 H6 56 1004 M4 78 UpperBound LowerBound Grade 100 95 A+ 94 90 A 89 85 B+ 84 80 B 79 75 B- 74 70 C 69 65 C- After normalizing tables to 3NF, we got rid of all the anomalies and inconsistencies. Now we can add new grade systems, update the existing one and delete the unwanted ones. Hence the Third Normal form is the most optimal normal form and 99% of the databases which require efficiency in  INSERT, UPDATE and DELETE Operations are designed in this normal form
  • 63.
    IV. Boyce-Codd NormalForm (BCNF or 3.5NF) •The Boyce-Codd Normal form, also referred to as the "third and half (3.5) normal form", adds one more requirement: Meet all the requirements of the third normal form. Every determinant must be a candidate key. •Boyce Codd Normal Form (BCNF) is a further refinement of 3NF. A row is in Boyce Codd normal form if and only if every determinant is a candidate key. •Most entities in 3NF are already in BCNF.
  • 64.
    Fourth Normal Form(4NF)  Fourth normal form (4NF) has one additional requirement:  Meet all the requirements of the third normal form.  A relation is in 4NF if it has no multi-valued dependencies.  An entity is in Fourth Normal Form (4NF) if and only if it is in 3NF and has no multiple sets of multi-valued dependencies. In other words, 4NF states that no entity can have more than a single one-to-many relationship within an entity if the one-to-many attributes are independent of each other. Fifth Normal Form (5NF)  5NF specifies that every join dependency for the entity must be a consequence of its candidate keys.
  • 65.
  • 66.
    Functional Dependency  Isa relationship between two sets of attributes in a database table.  It describes the dependency of one attribute (or a set of attributes) on another attribute (or a set of attributes).  Is denoted by an arrow  In other words, if changing the value of one attribute determines the value of another attribute(s), then a functional dependency exists. Example: In a table called "Employees," if the attribute "EmployeeID" determines the attribute "EmployeeName," it can be represented as: EmployeeID - > EmployeeName. This means that for every value of EmployeeID, there is a unique value of EmployeeName associated with it
  • 68.
    Full Functional Dependency It occurs when an attribute is functionally dependent on the entire primary key of a table, and not just a part of it.  In other words, all non-key attributes depend on the entire primary key and not on any subset of it. Example: In a table called "Students," if the primary key is composed of "StudentID" and "CourseID," and the attribute "Grade" depends on both of these attributes, it can be represented as: StudentID, CourseID -> Grade. This means that for every combination of StudentID and CourseID, there is a unique value of Grade associated with it.
  • 69.
    Partial Dependency  Itoccurs when an attribute is functionally dependent on only a part of the primary key, rather than the entire primary key.  It means that a non-key attribute depends on only a subset of the primary key, and not on the entire primary key. Example: In a table called "Orders," if the primary key is "OrderID," and the attributes "CustomerName" and "CustomerAddress" depend on only the attribute "OrderID," it indicates a partial dependency. This can be represented as: Ordered ->CustomerName, CustomerAddress. To remove the partial dependency, the table can be split into two separate tables: "Orders" and "Customers," where the customer details are stored separately. Transitive Dependency  It occurs when an attribute depends on another non-key attribute, rather than directly depending on the primary key.  It means that the dependency is indirectly established through another attribute.
  • 70.
    Example: In a tablecalled "Employees," if the primary key is "EmployeeID," and the attributes "Department" and "DepartmentLocation" depend on each other, it indicates a transitive dependency. This can be represented as: EmployeeID -> Department -> DepartmentLocation. To remove the transitive dependency, the table can be split into two separate tables: "Employees" and "Departments," where the department details are stored separately.
  • 71.
    2.3 Normalize businessdata and document results  It involves the process of organizing and structuring the data in a database to eliminate redundancy, improve data integrity, and reduce anomalies.  The goal is to ensure that each piece of data is stored in the most efficient and logical manner. The steps involved in normalization typically include: 1. Analyzing the data: The first step is to analyze the existing data in the database. This involves identifying the various entities, attributes, and relationships between them. 2. Applying normalization rules: Next, the data is normalized by applying normalization rules, specifically the rules outlined in normal forms, 3. Breaking down tables: In order to meet the criteria for normalization forms, it may be necessary to break down existing tables into multiple tables, with each table focusing on a specific entity or relationship.
  • 72.
    4. Resolving dependencies:During the normalization process, dependencies between attributes are identified and resolved. This includes identifying and eliminating partial dependencies and transitive dependencies. 5. Documenting the results: Once the normalization process is complete, it is important to document the results. This documentation includes the structure of the normalized tables, the relationships between them, and any changes made to the original data model. NOTE By undertaking normalization of business data and documenting the results, organizations can ensure that their databases are efficiently structured, leading to improved data quality, easier data maintenance, and more effective data operations. Cont.…
  • 73.
    2.4 Compare normalizationresults with ER diagram ER Diagram Normalization A visual representation of the entities (tables), attributes, and relationships between them in a database. Is a set of rules and guidelines used to eliminate redundancy, improve data integrity, and reduce anomalies in a database. It helps in understanding the structure and organization of the data, as well as the dependencies between different entities It involves breaking down tables, resolving dependencies, and organizing data into well-structured tables. Includes entity boxes, attribute labels, and lines representing the relationships between entities. We would ensure that the foreign keys in the normalized tables correctly establish the relationships between entities. By comparing the normalization results with the ER diagram, we can validate the accuracy and consistency of the database design, ensuring that the normalized tables effectively capture the structure and relationships depicted in the ER diagram.
  • 74.
    2.5 Reconcile differencesbetween data  It refers to the process of resolving conflicts or inconsistencies that may arise during the normalization process.  These conflicts can occur when attempting to organize and structure data into normalized tables, especially when there are dependencies or relationships between attributes and entities. key points to understand about reconciling differences between data in normalization 1. Identify Inconsistencies: The first step is to identify any inconsistencies or conflicts within the data. This may involve analyzing the relationships, dependencies, and functional dependencies between attributes and entities.
  • 75.
    2. Analyze Dependencies: Evaluate the dependencies between attributes and entities to determine if they are accurately represented.  This includes identifying partial dependencies (where an attribute depends on only a part of the primary key) or transitive dependencies (where an attribute depends on another non-key attribute). 3. Normalize Data:  This may involve breaking down tables, creating separate tables for related entities, and defining appropriate primary and foreign keys. 4. Resolve Conflicts: Address any conflicts or inconsistencies that arise during the normalization process. This may involve making decisions on how to handle partial dependencies or transitive dependencies
  • 76.
    5. Ensure DataIntegrity: . It also involves ensuring that there are no duplicate or redundant data. 6. Validate Results: This can be done by comparing the normalized tables with the original data, verifying that the relationships and dependencies are accurately represented.
  • 77.
    Data model validation 3 3.1Validation of data model with client  It refers to the process of confirming the accuracy, completeness, and appropriateness of the data model design in collaboration with the client or stakeholders.  Validation ensures that the model meets its intended requirements in terms of the methods employed and the results obtained  The ultimate goal of model validation is to make the model useful in the sense that the model addresses the right problem, provides accurate information about the system being modeled, and to makes the model actually used.
  • 78.
    Few key pointsto understand about validating the data model with the client: Collaboration  The validation process involves close collaboration with the client or stakeholders.  It is essential to actively involve them throughout the data modeling process, from the initial requirements gathering to the final validation stage. Requirements Alignment: The data model should align with the client's requirements and objectives. Review and Feedback:  Present the data model to the client for review and feedback.  This can be done through meetings, presentations, or documentation.  The client should have the opportunity to evaluate the data model and provide input, suggestions, or corrections based on their understanding and needs. Accuracy and Completeness  This includes verifying that all necessary entities, attributes, relationships, and constraints have been properly captured in the data model.
  • 79.
    Consistency and Usability Ensure that the data model is consistent, organized, and easy to understand.  It should follow established conventions and best practices in database design.  The client should be able to navigate and comprehend the data model easily, facilitating effective communication and decision-making. Iterative Process:  Validating the data model is typically an iterative process.  It may involve multiple rounds of review and revision based on client feedback.  Each iteration aims to refine and improve the data model until it meets the client's requirements and expectations. Documentation:  Document any changes, modifications, or clarifications made during the validation process. 3.2 Resolve arising issues or recommendations Key steps to follow Resolve arising issues or recommendations Identify the Issue: The first step is to identify and understand the specific issue or challenge at hand. This could be related to performance, security, scalability, user experience, or any other aspect of web development or database administration. Gather Information: Collect relevant data and information related to the issue. This may include analyzing system logs, monitoring metrics, user feedback, or conducting performance tests.
  • 80.
    Analyze the RootCause:  Conduct a thorough analysis to determine the underlying cause of the issue.  The goal is to identify the root cause so that appropriate measures can be taken. Propose Solutions:  Based on the analysis, propose potential solutions to address the issue.  This could involve making changes to the code, optimizing database queries, adjusting system configurations, enhancing security measures, or implementing new technologies. Implement and Test:  Once a solution is chosen, implement the necessary changes or improvements.  Ensure thorough testing is conducted to verify that the issue has been resolved and that the system is functioning as expected.  This may involve unit testing, integration testing, load testing, or any other relevant testing methods. Monitor and Iterate:  Continuously monitor the system after implementing the solution.  Keep an eye on performance metrics, user feedback, and any new issues that may arise.  If necessary, iterate on the solution or make further adjustments to optimize the system's performance and address any new challenges.
  • 81.
    Document and Communicate: Document the issue, solution, and any changes made for future reference. Communicate the findings and recommendations to relevant stakeholders, such as developers, database administrators, project managers, or clients.  This ensures that everyone is aware of the actions taken and the impact on the system. 3.3 Documentation of completed data model  Is crucial for maintaining a clear and comprehensive record of the data model's structure, relationships, and constraints. This documentation serves as a valuable reference for developers, database administrators, and other stakeholders involved in the project. key components to include when documenting a completed data model:  Entity Relationship Diagram (ERD): This diagram provides a clear overview of the data model's structure and helps stakeholders understand the relationships between entities.
  • 82.
     Entity Descriptions Provide detailed descriptions of each entity in the data model. Include information such as the entity's purpose, key attributes, and any constraints or business rules associated with it.  This description helps stakeholders understand the role and significance of each entity in the system.  Attribute Definitions  Document the attributes present in each entity, including their names, data types, lengths, and any applicable constraints (such as primary keys, foreign keys, or unique constraints).  This information helps ensure consistency and accuracy when working with the data model.
  • 83.
     Relationship Descriptions Describe the relationships between entities, including their types (such as one- to-one, one-to-many, or many-to-many) and any constraints or rules that apply to them  Data Constraints  Document any additional constraints or rules that apply to the data model, such as domain constraints, referential integrity rules, or check constraints.  These constraints ensure the data remains valid and consistent throughout the system.  Indexes and Performance Considerations  This information helps developers and administrators optimize query performance and improve overall system efficiency.
  • 84.
     Data Dictionary Create a data dictionary that provides a centralized reference for all the entities, attributes, relationships, and constraints in the data model.  This dictionary should include clear definitions and explanations of each element, serving as a comprehensive guide for anyone working with the data model.  Version Control and Change History  Maintain a version control system to track changes made to the data model over time.  This ensures transparency and helps with future troubleshooting or system audits.  Diagram Notations and Conventions  Include a section that explains the notations and conventions used in the data model documentation.  This helps ensure consistency and understanding among team members who
  • 85.
    3.4 Client approvalsubmission Steps to follow when submitting the modeling data object to the client for final approval:  Prepare the Presentation  Create a clear and concise presentation of the modeling data object.  This may include visual representations such as entity-relationship diagrams, data flow diagrams, or any other relevant diagrams to help the client understand the structure and relationships of the data model.  Explain the Purpose and Benefits Highlight the benefits and advantages of the data model, such as improved data organization, increased efficiency, or enhanced reporting capabilities. Walkthrough the Data Model: Explain the entities, attributes, relationships, and any constraints or rules that have been incorporated.
  • 86.
     Address Questionsand Concerns  This ensures that the client has a clear understanding of the data model and can make an informed decision.  Discuss Potential Revisions or Modifications  If the client raises any concerns or suggests changes to the data model, engage in a constructive discussion.  Consider their feedback and evaluate the feasibility and impact of the proposed revisions. Collaborate with the client to find the most appropriate solutions.  Document Client Feedback  Document any feedback or changes requested by the client during the presentation.  This serves as a reference for future discussions and helps ensure that the final data model accurately reflects the client's requirements.
  • 87.
     Seek Approval: Once the presentation and discussion are complete, formally request the client's approval of the modeling data object.  Address Final Revisions  If the client requests any final revisions or modification, incorporate them into the data model as agreed upon.  Document these changes and ensure that they align with the client's expectations.  Obtain Signed Approval  This can be in the form of a signed document or an email confirming their acceptance of the data model.
  • 88.
    Maintain Documentation  Keepa copy of the approved data model, along with any related documentation, for future reference.  This ensures that there is a record of the agreed-upon data model and provides a basis for any future updates or enhancements. NOTE  Submitting the modeling data object to the client for final approval is a critical step in the data modeling process.  It ensures that the client is satisfied with the proposed solution and provides a basis for moving forward with implementation.  Effective communication, collaboration, and documentation are the key to successfully obtaining client approval and ensuring the data model meets their requirements.
  • 89.