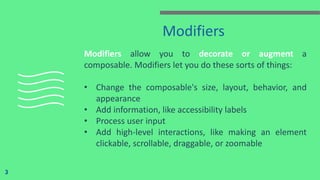
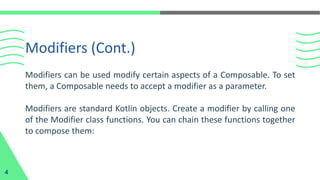
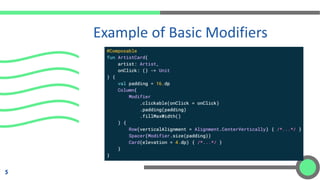
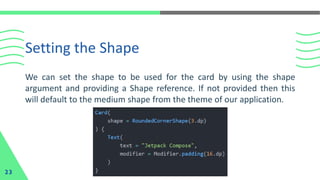
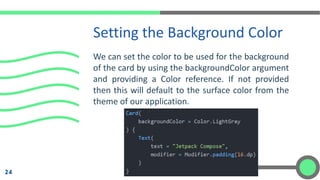
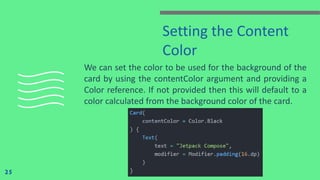
Material for this slide includes:
1. Description of modifiers and examples
2. Built-in modifiers
3. Description of image card and examples
4. Styling the card
Prepared as part of the IT for Business Intelligence course of MBA @VGSOM, IIT Kharagpur. The tutorial describes how to create an interactive map using the open source software QGIS.
A parcel fabric is built from either data migration of existing parcel datasets
or data entry into an empty parcel fabric. Data migration of existing parcels
into a new parcel fabric is the most common method that you will use to
build a parcel fabric.
A detailed look at CSS3 backgrounds including the three key boxes - content-box, padding-box,border-box. The presentation also explores new values - such as space, round, contain and cover. Also covered are three new properties - background-origin, background-clip and background-size. Finally, the presentation explores shorthand CSS3 backgrounds and multiple background images. Not for the faint-hearted!
The updated CSS Dev Conference version of my Building Responsive Layouts talk. Get links to lots of related resources at http://zomigi.com/blog/responsive-layouts-css-dev-conf.
Geographical Information System (GIS) Georeferencing and Digitization, Bihar ...Kamlesh Kumar
This work is an effort to share Geographical Information System: Georeferencing, digitization and map making steps through QGIS 2.0.1
Georeferencing
Digitization of Topographical sheet
Point
Line
Area
Bihar Map
District Headquarters
Railway of Bihar
District Boundaries
Thematic Maps (Literacy & Sex Ratio)
PHYS 221Lab 1 - Acceleration Due to GravityPlease work in g.docxmattjtoni51554
PHYS 221 Lab 1 - Acceleration Due to Gravity
Please work in groups of three. Please submit one lab report per person via Canvas.
In this laboratory we will measure the acceleration due to gravity by studying the motion of a cart accelerating down an inclined plane.
Background
Suppose we start with a level track and then tip it, as shown in Figure 1 below. Let L be the distance between two fixed points on a ramp, selected to be as far apart as possible, on the track. Let h be the difference in the vertical height above the table of these two points.
Figure 1 - Schematic of a cart on an inclined plane. The magnitude of the acceleration of the cart down the ramp can be considered a component of the gravitational acceleration: a = g sinθ
Then we have an incline of angle given by Equation 1:
. (1)
The acceleration of gravity, g, acts vertically downward, so the component of parallel to the incline – which is the acceleration of our cart – is given by Equation 2:
(2)
We see in Equation 2 that a graph of acceleration a as a function of sinθ should be linear with slope g. We will take data to plot such a graph and from its slope determine the value of g.
Setup
Gather the following materials:
· 2 m ramp
· Meter stick
· Lab Stand
· Ramp clamp
· Plastic Box with ULI, AC Adapter, and USB Cable
· Motion Sensor
· Magnetic Bumper
1. Connect the ULI to the computer via the USB cable and connect the AC adapter. Open Logger Pro 3.8.7.
2. Attach the ramp clamp to the lab stand and attach one end of the ramp.
3. Elevate one end of the track slightly using the vertical rod. Choose a value of h so that the angle of inclination stays less than about 8 degrees. (Use Equation 1 to verify).
· You can choose any two points along the track to serve as your L, but they must be the same two points for all your runs!
· Measure h by measuring the difference in the two heights of your two points.
4. Connect a motion sensor to the ULI and mount it on the elevated end of the track. The low end of the track should have a magnetic bumper installed on it (magnets face upward along the track).
Procedure
1. Choose at least five values of height h, to vary over the range 1-8 degrees.
2. Record each value of h chosen, and then obtain a graph of velocity versus time for that value.
3. You have two options for collecting velocity data from the cart:
· Release from the elevated end of the track and let it accelerate to the lower end.
· Push the cart from the lower end of the track up the incline. Record data during its entire motion back to its starting point. This will take slightly more finesse, but the data will be better.
The motion sensor will not record accurate data for a cart closer than 40 cm (the limit of its near range). Do not let the cart collide with the end of the track!
4. Determine the acceleration for the cart by using the Linear Fit tool and highlighting the appropriate region of the velocity graph. Record the .
Compensator Design and parameters modification using Bode plot and root locusMIbrar4
Bode diagram design is an interactive graphical method of modifying a compensator to achieve a
specific open-loop response (loop shaping). To interactively shape the open-loop response using
Control System Designer, use the Bode Editor. In the editor, you can adjust the open-loop
bandwidth and design to gain and phase margin specifications.
To adjust the loop shape, you can add poles and zeros to your compensator and adjust their values
directly in the Bode Editor, or you can use the Compensator Editor. For more information, see Edit
Compensator Dynamics. For information on all the tuning methods available in Control System
Designer, see Control System Designer Tuning Methods.
In this tutorial, we learn to create univariate bar plots using the Graphics package in R. We also learn to modify graphical parameters associated with the bar plot.
* Draw and interpret scatter diagrams.
* Use a graphing utility to find the line of best fit.
* Distinguish between linear and nonlinear relations.
* Fit a regression line to a set of data and use the linear model to make predictions.
Material for this slide includes:
1. Description of firebase and reason to use it
2. What are the benefits of firebase?
3. Major features of firebase
4. Description of firebase cloud storage and their benefits
5. Description of firebase realtime database and their benefits
6. Description of firebase authentication and their benefits
7. Description of firebase analytics and their benefits
8. How to Setup Firebase?
Mobile Programming - 9 Profile UI, Navigation Basic and Splash ScreenAndiNurkholis1
Material for this slide includes:
1. Description of profile UI and their examples
2. Tips on how to build profile UI
3. Description of navigation and their examples
4. Tips on how to build navigation
5. Description and how splash screen works
More Related Content
Similar to Mobile Programming - 4 Modifiers and Image Card
The updated CSS Dev Conference version of my Building Responsive Layouts talk. Get links to lots of related resources at http://zomigi.com/blog/responsive-layouts-css-dev-conf.
Geographical Information System (GIS) Georeferencing and Digitization, Bihar ...Kamlesh Kumar
This work is an effort to share Geographical Information System: Georeferencing, digitization and map making steps through QGIS 2.0.1
Georeferencing
Digitization of Topographical sheet
Point
Line
Area
Bihar Map
District Headquarters
Railway of Bihar
District Boundaries
Thematic Maps (Literacy & Sex Ratio)
PHYS 221Lab 1 - Acceleration Due to GravityPlease work in g.docxmattjtoni51554
PHYS 221 Lab 1 - Acceleration Due to Gravity
Please work in groups of three. Please submit one lab report per person via Canvas.
In this laboratory we will measure the acceleration due to gravity by studying the motion of a cart accelerating down an inclined plane.
Background
Suppose we start with a level track and then tip it, as shown in Figure 1 below. Let L be the distance between two fixed points on a ramp, selected to be as far apart as possible, on the track. Let h be the difference in the vertical height above the table of these two points.
Figure 1 - Schematic of a cart on an inclined plane. The magnitude of the acceleration of the cart down the ramp can be considered a component of the gravitational acceleration: a = g sinθ
Then we have an incline of angle given by Equation 1:
. (1)
The acceleration of gravity, g, acts vertically downward, so the component of parallel to the incline – which is the acceleration of our cart – is given by Equation 2:
(2)
We see in Equation 2 that a graph of acceleration a as a function of sinθ should be linear with slope g. We will take data to plot such a graph and from its slope determine the value of g.
Setup
Gather the following materials:
· 2 m ramp
· Meter stick
· Lab Stand
· Ramp clamp
· Plastic Box with ULI, AC Adapter, and USB Cable
· Motion Sensor
· Magnetic Bumper
1. Connect the ULI to the computer via the USB cable and connect the AC adapter. Open Logger Pro 3.8.7.
2. Attach the ramp clamp to the lab stand and attach one end of the ramp.
3. Elevate one end of the track slightly using the vertical rod. Choose a value of h so that the angle of inclination stays less than about 8 degrees. (Use Equation 1 to verify).
· You can choose any two points along the track to serve as your L, but they must be the same two points for all your runs!
· Measure h by measuring the difference in the two heights of your two points.
4. Connect a motion sensor to the ULI and mount it on the elevated end of the track. The low end of the track should have a magnetic bumper installed on it (magnets face upward along the track).
Procedure
1. Choose at least five values of height h, to vary over the range 1-8 degrees.
2. Record each value of h chosen, and then obtain a graph of velocity versus time for that value.
3. You have two options for collecting velocity data from the cart:
· Release from the elevated end of the track and let it accelerate to the lower end.
· Push the cart from the lower end of the track up the incline. Record data during its entire motion back to its starting point. This will take slightly more finesse, but the data will be better.
The motion sensor will not record accurate data for a cart closer than 40 cm (the limit of its near range). Do not let the cart collide with the end of the track!
4. Determine the acceleration for the cart by using the Linear Fit tool and highlighting the appropriate region of the velocity graph. Record the .
Compensator Design and parameters modification using Bode plot and root locusMIbrar4
Bode diagram design is an interactive graphical method of modifying a compensator to achieve a
specific open-loop response (loop shaping). To interactively shape the open-loop response using
Control System Designer, use the Bode Editor. In the editor, you can adjust the open-loop
bandwidth and design to gain and phase margin specifications.
To adjust the loop shape, you can add poles and zeros to your compensator and adjust their values
directly in the Bode Editor, or you can use the Compensator Editor. For more information, see Edit
Compensator Dynamics. For information on all the tuning methods available in Control System
Designer, see Control System Designer Tuning Methods.
In this tutorial, we learn to create univariate bar plots using the Graphics package in R. We also learn to modify graphical parameters associated with the bar plot.
* Draw and interpret scatter diagrams.
* Use a graphing utility to find the line of best fit.
* Distinguish between linear and nonlinear relations.
* Fit a regression line to a set of data and use the linear model to make predictions.
Similar to Mobile Programming - 4 Modifiers and Image Card (20)
Material for this slide includes:
1. Description of firebase and reason to use it
2. What are the benefits of firebase?
3. Major features of firebase
4. Description of firebase cloud storage and their benefits
5. Description of firebase realtime database and their benefits
6. Description of firebase authentication and their benefits
7. Description of firebase analytics and their benefits
8. How to Setup Firebase?
Mobile Programming - 9 Profile UI, Navigation Basic and Splash ScreenAndiNurkholis1
Material for this slide includes:
1. Description of profile UI and their examples
2. Tips on how to build profile UI
3. Description of navigation and their examples
4. Tips on how to build navigation
5. Description and how splash screen works
Mobile Programming - 8 Progress Bar, Draggable Music Knob, TimerAndiNurkholis1
Material for this slide includes:
1. Description of progress bar and their types
2. Description of draggable music knob and their examples
3. Description of timer and and their examples
Mobile Programming - 7 Side Effects, Effect Handlers, and Simple AnimationsAndiNurkholis1
Material for this slide includes:
1. Description of effect handlers and their types
2. Description of side effects and their examples
3. Description of animations and their APIs in Jetpack Compose
Mobile Programming - 6 Textfields, Button, Showing Snackbars and ListsAndiNurkholis1
Material for this slide includes:
1. Jetpack compose UI element
2. Textfield in jetpack compose (simple, outlined, rounded corner, password)
3. Button in jetpack compose (simple, round, outlined, background color)
4. Snackbar in jetpack compose (simple and custom)
5. Description of list and examples
Mobile Programming - 3 Rows, Column and Basic SizingAndiNurkholis1
Material for this slide includes:
1. Compose Layout Basics
2. Jetpack Compose Layout Structure
3. Composable Function
4. Column Layout
5. Row Layout
6. Box Layout
7. Children Position
Material for this slide includes:
1. Android Jetpack
2. Advantage of Jetpack
3. Jetpack Compose for UI
4. Why is Compose Getting So Popular?
5. Composable Function
Algoritma dan Struktur Data (Python) - Struktur I/OAndiNurkholis1
Materi mata kuliah Algoritma dan Struktur Data (Python) yang mencakup penerapan struktur program (Input/Output) yang terdiri dari runtunan/sequential, variabel, tipe data, konstanta, operator (aritmatika, assignment, relasional, dan logika), dan komentar
Algoritma dan Struktur Data (Python) - Notasi AlgoritmikAndiNurkholis1
Materi mata kuliah Algoritma dan Struktur Data (Python) yang mencakup penerapan notasi yang dapat digunakan dalam visualisasi algoritma, yakni kalimat deskriptif, flowchart, dan pseudo-code
Algorithm and Data Structure - Binary SearchAndiNurkholis1
This material aims to enable students to:
1) Understanding searching algorithm concept
2) Understanding characteristic of binary search
3) Understanding steps of binary search
4) Knowing of advantage and disadvantage of binary search
Algorithm and Data Structure - Linear SearchAndiNurkholis1
This material aims to enable students to:
1) Understanding searching algorithm concept
2) Understanding characteristic of linear search
3) Understanding steps of linear search
4) Knowing of advantage and disadvantage of linear search
This material aims to enable students to:
1) Understanding queue concept
2) Understanding enqueue, dequeue, front, rear operation in a queue
3) Understanding working of queue
4) Knowing of queue application
This material aims to enable students to:
1) Understanding stack concept
2) Understanding push, pop, peek or top, isEmpty, isFull operation in a stack
3) Understanding working of stack
4) Knowing of stack application
Algorithm and Data Structure - Modular ProgrammingAndiNurkholis1
This material aims to enable students to:
1) Understand and practice modular programming concept
2) Implement for use of function and procedure
3) Determine when to use function and procedure
4) Implement subprogram call from the main program
AI Pilot Review: The World’s First Virtual Assistant Marketing SuiteGoogle
AI Pilot Review: The World’s First Virtual Assistant Marketing Suite
👉👉 Click Here To Get More Info 👇👇
https://sumonreview.com/ai-pilot-review/
AI Pilot Review: Key Features
✅Deploy AI expert bots in Any Niche With Just A Click
✅With one keyword, generate complete funnels, websites, landing pages, and more.
✅More than 85 AI features are included in the AI pilot.
✅No setup or configuration; use your voice (like Siri) to do whatever you want.
✅You Can Use AI Pilot To Create your version of AI Pilot And Charge People For It…
✅ZERO Manual Work With AI Pilot. Never write, Design, Or Code Again.
✅ZERO Limits On Features Or Usages
✅Use Our AI-powered Traffic To Get Hundreds Of Customers
✅No Complicated Setup: Get Up And Running In 2 Minutes
✅99.99% Up-Time Guaranteed
✅30 Days Money-Back Guarantee
✅ZERO Upfront Cost
See My Other Reviews Article:
(1) TubeTrivia AI Review: https://sumonreview.com/tubetrivia-ai-review
(2) SocioWave Review: https://sumonreview.com/sociowave-review
(3) AI Partner & Profit Review: https://sumonreview.com/ai-partner-profit-review
(4) AI Ebook Suite Review: https://sumonreview.com/ai-ebook-suite-review
Enterprise Resource Planning System includes various modules that reduce any business's workload. Additionally, it organizes the workflows, which drives towards enhancing productivity. Here are a detailed explanation of the ERP modules. Going through the points will help you understand how the software is changing the work dynamics.
To know more details here: https://blogs.nyggs.com/nyggs/enterprise-resource-planning-erp-system-modules/
Innovating Inference - Remote Triggering of Large Language Models on HPC Clus...Globus
Large Language Models (LLMs) are currently the center of attention in the tech world, particularly for their potential to advance research. In this presentation, we'll explore a straightforward and effective method for quickly initiating inference runs on supercomputers using the vLLM tool with Globus Compute, specifically on the Polaris system at ALCF. We'll begin by briefly discussing the popularity and applications of LLMs in various fields. Following this, we will introduce the vLLM tool, and explain how it integrates with Globus Compute to efficiently manage LLM operations on Polaris. Attendees will learn the practical aspects of setting up and remotely triggering LLMs from local machines, focusing on ease of use and efficiency. This talk is ideal for researchers and practitioners looking to leverage the power of LLMs in their work, offering a clear guide to harnessing supercomputing resources for quick and effective LLM inference.
Top Features to Include in Your Winzo Clone App for Business Growth (4).pptxrickgrimesss22
Discover the essential features to incorporate in your Winzo clone app to boost business growth, enhance user engagement, and drive revenue. Learn how to create a compelling gaming experience that stands out in the competitive market.
Navigating the Metaverse: A Journey into Virtual Evolution"Donna Lenk
Join us for an exploration of the Metaverse's evolution, where innovation meets imagination. Discover new dimensions of virtual events, engage with thought-provoking discussions, and witness the transformative power of digital realms."
Software Engineering, Software Consulting, Tech Lead.
Spring Boot, Spring Cloud, Spring Core, Spring JDBC, Spring Security,
Spring Transaction, Spring MVC,
Log4j, REST/SOAP WEB-SERVICES.
Quarkus Hidden and Forbidden ExtensionsMax Andersen
Quarkus has a vast extension ecosystem and is known for its subsonic and subatomic feature set. Some of these features are not as well known, and some extensions are less talked about, but that does not make them less interesting - quite the opposite.
Come join this talk to see some tips and tricks for using Quarkus and some of the lesser known features, extensions and development techniques.
Experience our free, in-depth three-part Tendenci Platform Corporate Membership Management workshop series! In Session 1 on May 14th, 2024, we began with an Introduction and Setup, mastering the configuration of your Corporate Membership Module settings to establish membership types, applications, and more. Then, on May 16th, 2024, in Session 2, we focused on binding individual members to a Corporate Membership and Corporate Reps, teaching you how to add individual members and assign Corporate Representatives to manage dues, renewals, and associated members. Finally, on May 28th, 2024, in Session 3, we covered questions and concerns, addressing any queries or issues you may have.
For more Tendenci AMS events, check out www.tendenci.com/events
Climate Science Flows: Enabling Petabyte-Scale Climate Analysis with the Eart...Globus
The Earth System Grid Federation (ESGF) is a global network of data servers that archives and distributes the planet’s largest collection of Earth system model output for thousands of climate and environmental scientists worldwide. Many of these petabyte-scale data archives are located in proximity to large high-performance computing (HPC) or cloud computing resources, but the primary workflow for data users consists of transferring data, and applying computations on a different system. As a part of the ESGF 2.0 US project (funded by the United States Department of Energy Office of Science), we developed pre-defined data workflows, which can be run on-demand, capable of applying many data reduction and data analysis to the large ESGF data archives, transferring only the resultant analysis (ex. visualizations, smaller data files). In this talk, we will showcase a few of these workflows, highlighting how Globus Flows can be used for petabyte-scale climate analysis.
First Steps with Globus Compute Multi-User EndpointsGlobus
In this presentation we will share our experiences around getting started with the Globus Compute multi-user endpoint. Working with the Pharmacology group at the University of Auckland, we have previously written an application using Globus Compute that can offload computationally expensive steps in the researcher's workflows, which they wish to manage from their familiar Windows environments, onto the NeSI (New Zealand eScience Infrastructure) cluster. Some of the challenges we have encountered were that each researcher had to set up and manage their own single-user globus compute endpoint and that the workloads had varying resource requirements (CPUs, memory and wall time) between different runs. We hope that the multi-user endpoint will help to address these challenges and share an update on our progress here.
Enhancing Research Orchestration Capabilities at ORNL.pdfGlobus
Cross-facility research orchestration comes with ever-changing constraints regarding the availability and suitability of various compute and data resources. In short, a flexible data and processing fabric is needed to enable the dynamic redirection of data and compute tasks throughout the lifecycle of an experiment. In this talk, we illustrate how we easily leveraged Globus services to instrument the ACE research testbed at the Oak Ridge Leadership Computing Facility with flexible data and task orchestration capabilities.
Unleash Unlimited Potential with One-Time Purchase
BoxLang is more than just a language; it's a community. By choosing a Visionary License, you're not just investing in your success, you're actively contributing to the ongoing development and support of BoxLang.
Custom Healthcare Software for Managing Chronic Conditions and Remote Patient...Mind IT Systems
Healthcare providers often struggle with the complexities of chronic conditions and remote patient monitoring, as each patient requires personalized care and ongoing monitoring. Off-the-shelf solutions may not meet these diverse needs, leading to inefficiencies and gaps in care. It’s here, custom healthcare software offers a tailored solution, ensuring improved care and effectiveness.
Code reviews are vital for ensuring good code quality. They serve as one of our last lines of defense against bugs and subpar code reaching production.
Yet, they often turn into annoying tasks riddled with frustration, hostility, unclear feedback and lack of standards. How can we improve this crucial process?
In this session we will cover:
- The Art of Effective Code Reviews
- Streamlining the Review Process
- Elevating Reviews with Automated Tools
By the end of this presentation, you'll have the knowledge on how to organize and improve your code review proces
Cyaniclab : Software Development Agency Portfolio.pdfCyanic lab
CyanicLab, an offshore custom software development company based in Sweden,India, Finland, is your go-to partner for startup development and innovative web design solutions. Our expert team specializes in crafting cutting-edge software tailored to meet the unique needs of startups and established enterprises alike. From conceptualization to execution, we offer comprehensive services including web and mobile app development, UI/UX design, and ongoing software maintenance. Ready to elevate your business? Contact CyanicLab today and let us propel your vision to success with our top-notch IT solutions.
SOCRadar Research Team: Latest Activities of IntelBrokerSOCRadar
The European Union Agency for Law Enforcement Cooperation (Europol) has suffered an alleged data breach after a notorious threat actor claimed to have exfiltrated data from its systems. Infamous data leaker IntelBroker posted on the even more infamous BreachForums hacking forum, saying that Europol suffered a data breach this month.
The alleged breach affected Europol agencies CCSE, EC3, Europol Platform for Experts, Law Enforcement Forum, and SIRIUS. Infiltration of these entities can disrupt ongoing investigations and compromise sensitive intelligence shared among international law enforcement agencies.
However, this is neither the first nor the last activity of IntekBroker. We have compiled for you what happened in the last few days. To track such hacker activities on dark web sources like hacker forums, private Telegram channels, and other hidden platforms where cyber threats often originate, you can check SOCRadar’s Dark Web News.
Stay Informed on Threat Actors’ Activity on the Dark Web with SOCRadar!
3. Modifiers
Modifiers allow you to decorate or augment a
composable. Modifiers let you do these sorts of things:
• Change the composable's size, layout, behavior, and
appearance
• Add information, like accessibility labels
• Process user input
• Add high-level interactions, like making an element
clickable, scrollable, draggable, or zoomable
3
4. Modifiers (Cont.)
4
Modifiers can be used modify certain aspects of a Composable. To set
them, a Composable needs to accept a modifier as a parameter.
Modifiers are standard Kotlin objects. Create a modifier by calling one
of the Modifier class functions. You can chain these functions together
to compose them:
7. Example of Basic Modifiers (Cont.)
7
In the previous code, notice different modifier
functions used together:
• clickable makes a composable react to user
input and shows a ripple.
• padding puts space around an element.
• fillMaxWidth makes the composable fill the
maximum width given to it from its parent.
• size() specifies an element's preferred width and
height.
8. Order of Modifiers
Matters
The order of modifier functions is significant. Since each
function makes changes to the Modifier returned by the
previous function, the sequence affects the final result.
8
9. Built-in Modifiers
9
Jetpack Compose provides a list of built-in modifiers to help you
decorate or augment a composable. Some modifiers such as padding,
clickable, and fillMaxWidth have already been introduced. Here’s a list
of other common modifiers:
• Size
• Offset
• MatchParentSize in Box
• Weight in Row and Column
10. By default, layouts provided in Compose wrap their
children. However, you can set a size by using the
size modifier:
Size
10
11. In this example, even with the parent height set to
100.dp, the height of the Image will be 150.dp, as
the requiredSize modifier takes precedence.
Size (Cont.)
11
12. Offset
To position a layout relative to its original position, add
the offset modifier and set the offset in the x and y axis.
Offsets can be positive as well as non-positive. The
difference between padding and offset is that adding an
offset to a composable does not change its measurements
12
13. Offset (Cont.)
The offset modifier is applied horizontally according to the
layout direction. In a left-to-right context, a positive offset
shifts the element to the right, while in a right-to-left
context, it shifts the element to the left. If you need to set
an offset without considering layout direction, see the
absoluteOffset modifier, in which a positive offset value
always shifts the element to the right.
13
14. matchParentSize in Box
14
If you want a child layout to be the same size as a parent Box without
affecting the Box size, use the matchParentSize modifier. Note that
matchParentSize is only available within a Box scope, meaning that it
only applies to direct children of Box composables.
In the example below, the child Spacer takes its size from its parent
Box, which in turn takes its size from the biggest children, ArtistCard in
this case.
15. Here is the result :
matchParentSize in Box (Cont.)
15
16. matchParentSize in Box (Cont.)
16
If fillMaxSize were used instead of matchParentSize, the Spacer would
take all the available space allowed to the parent, in turn causing the
parent to expand and fill all the available space.
17. weight in Row and
Column
You can set a composable size to be flexible within its
parent using the weight Modifier that is only available in
RowScope, and ColumnScope.
Let’s take a Row that contains two Box composables. The
first box is given twice the weight of the second, so it's
given twice the width.
17
18. weight in Row and
Column (Cont.)
Since the Row is 210.dp
wide, the first Box is 140.dp
wide, and the second is
70.dp:
18
19. weight in Row and
Column (Cont.)
Here is the result of using weight in row and column on
two elements:
19
20. Image Card
20
The Card composable is a surface that can be used to present content
and actions focused on a single topic.
When it comes to displaying a Card composable, we can do so by using
the provided composable function, along with the minimal required
arguments. The Card only has a single required argument, which is the
content argument – this is used as the body of the Card.
21. Here is a basic example of a card:
Here is the result :
Image Card (Cont.)
21
22. Styling the Card
Once we’ve composed a Card, it might be the case that
we’re going to want to apply some styling to override the
default which is provided by the theme of our application.
In these cases, the Card composable offers several
arguments which can be used to control the look and feel.
22
23. Setting the Shape
23
We can set the shape to be used for the card by using the shape
argument and providing a Shape reference. If not provided then this
will default to the medium shape from the theme of our application.
24. We can set the color to be used for the background
of the card by using the backgroundColor argument
and providing a Color reference. If not provided
then this will default to the surface color from the
theme of our application.
Setting the Background Color
24
25. Setting the Content
Color
We can set the color to be used for the background of the
card by using the contentColor argument and providing a
Color reference. If not provided then this will default to a
color calculated from the background color of the card.
25
26. Adding a Border
26
We can add a border to the card by using the border argument and
providing a dp value. If not provided then this will default to null and
no border will be applied to the card.
27. We can apply elevation to the card by using the
elevation argument and providing a BorderStroke
reference. If not provided then this will default to
the value of 1 dp.
Applying Elevation to the Card
27