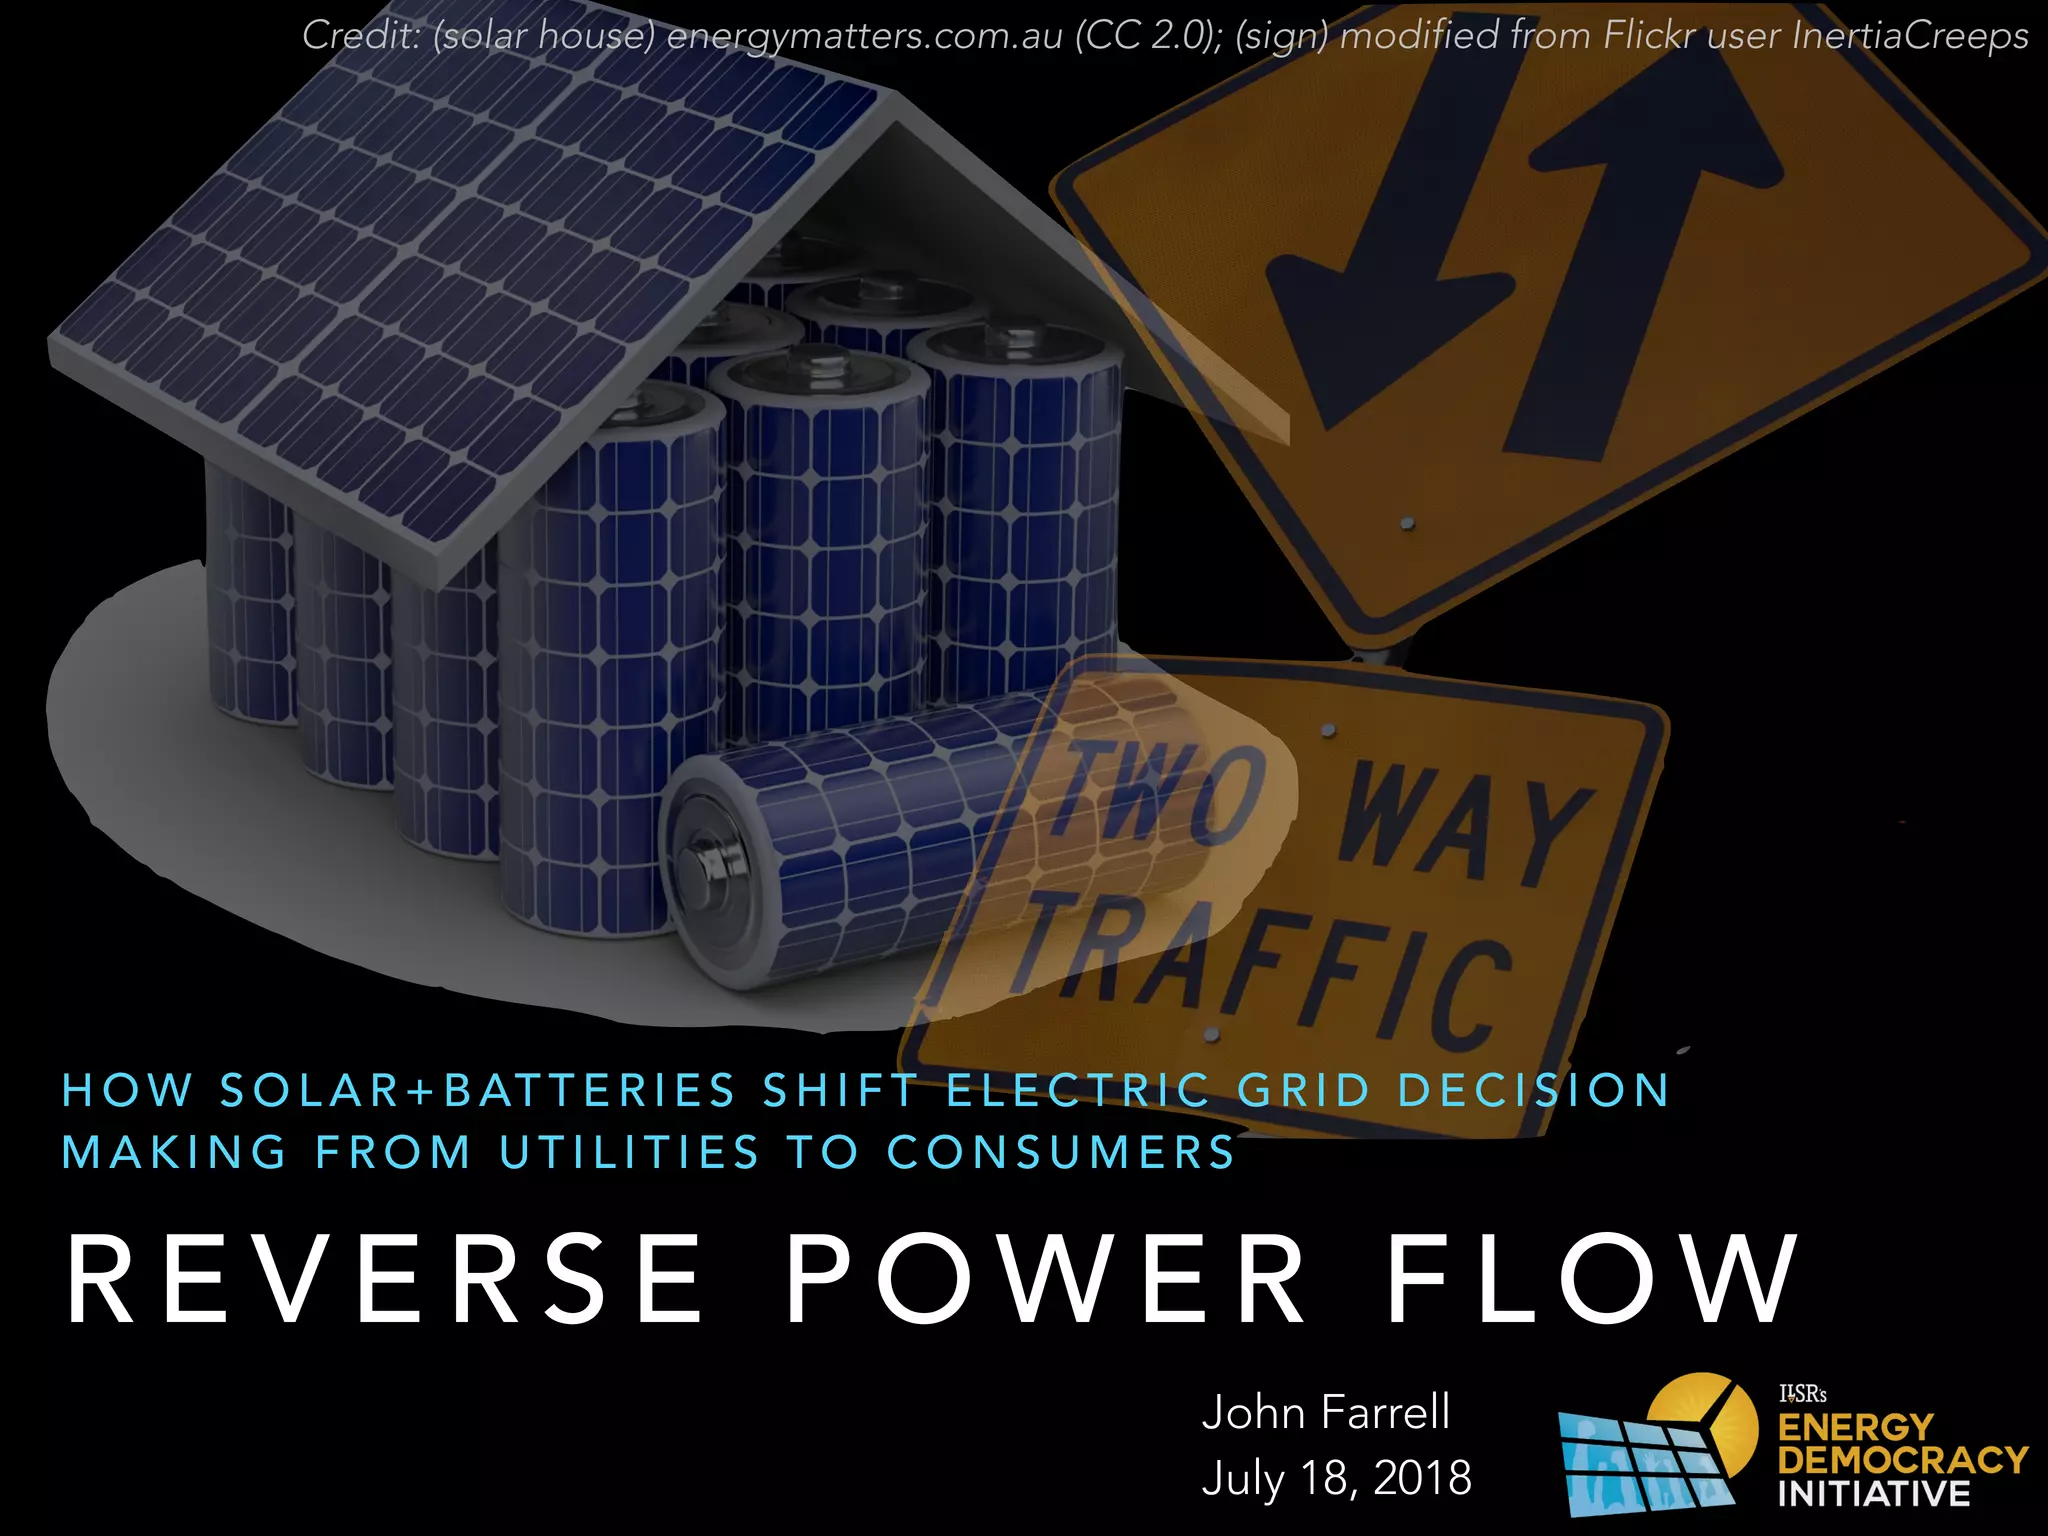
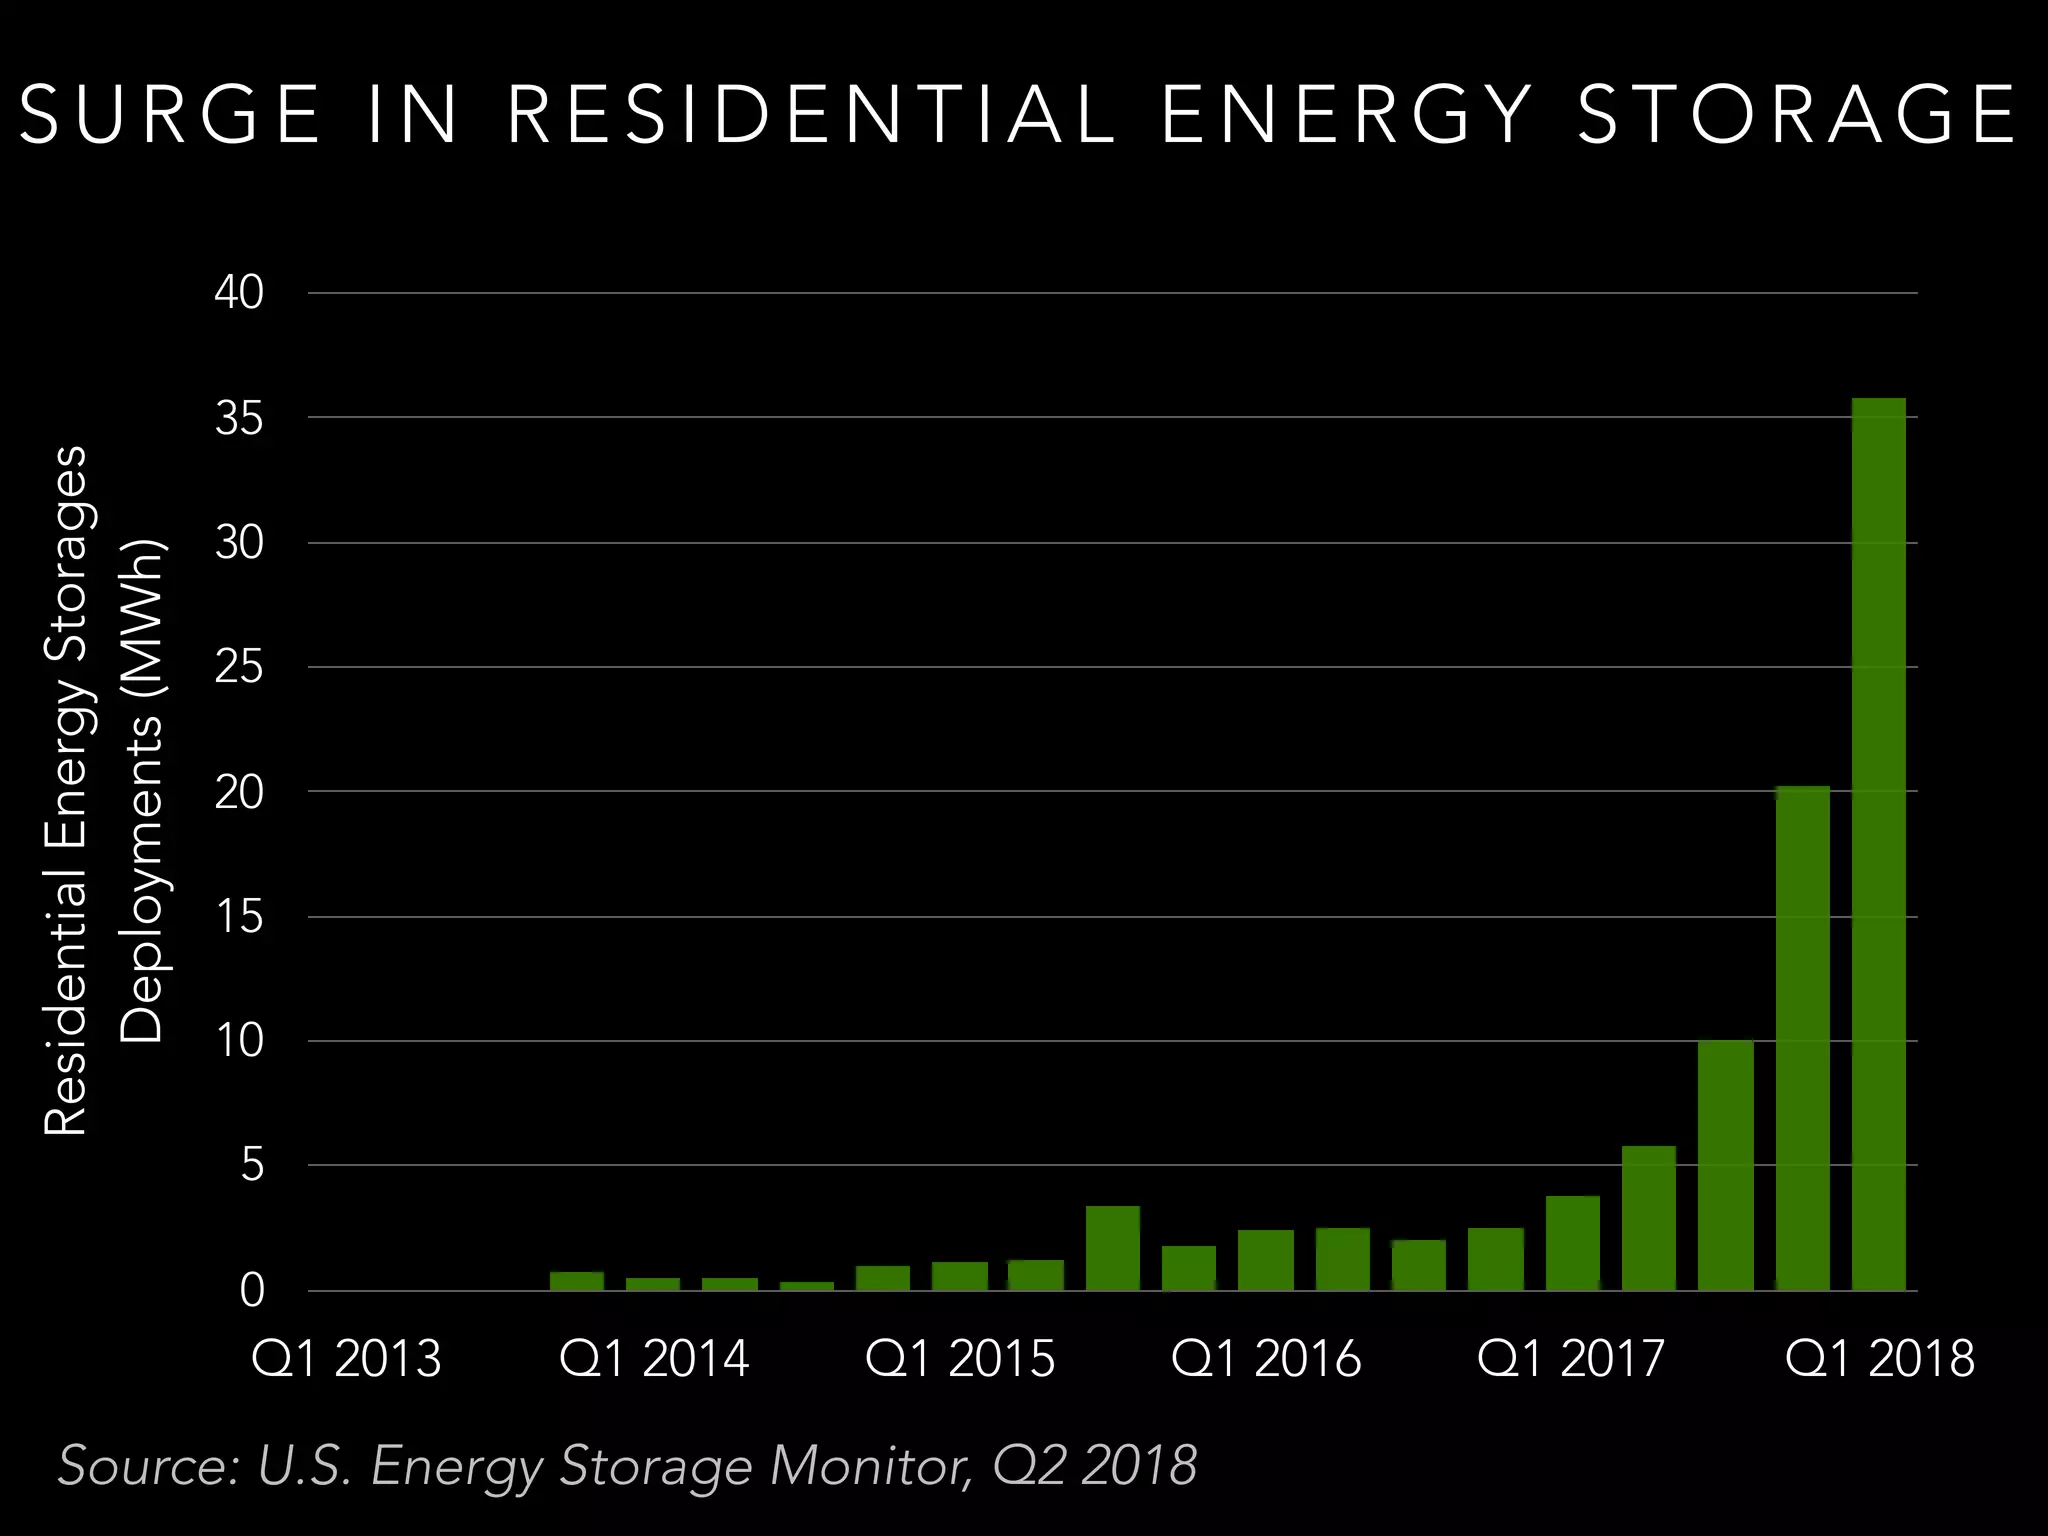
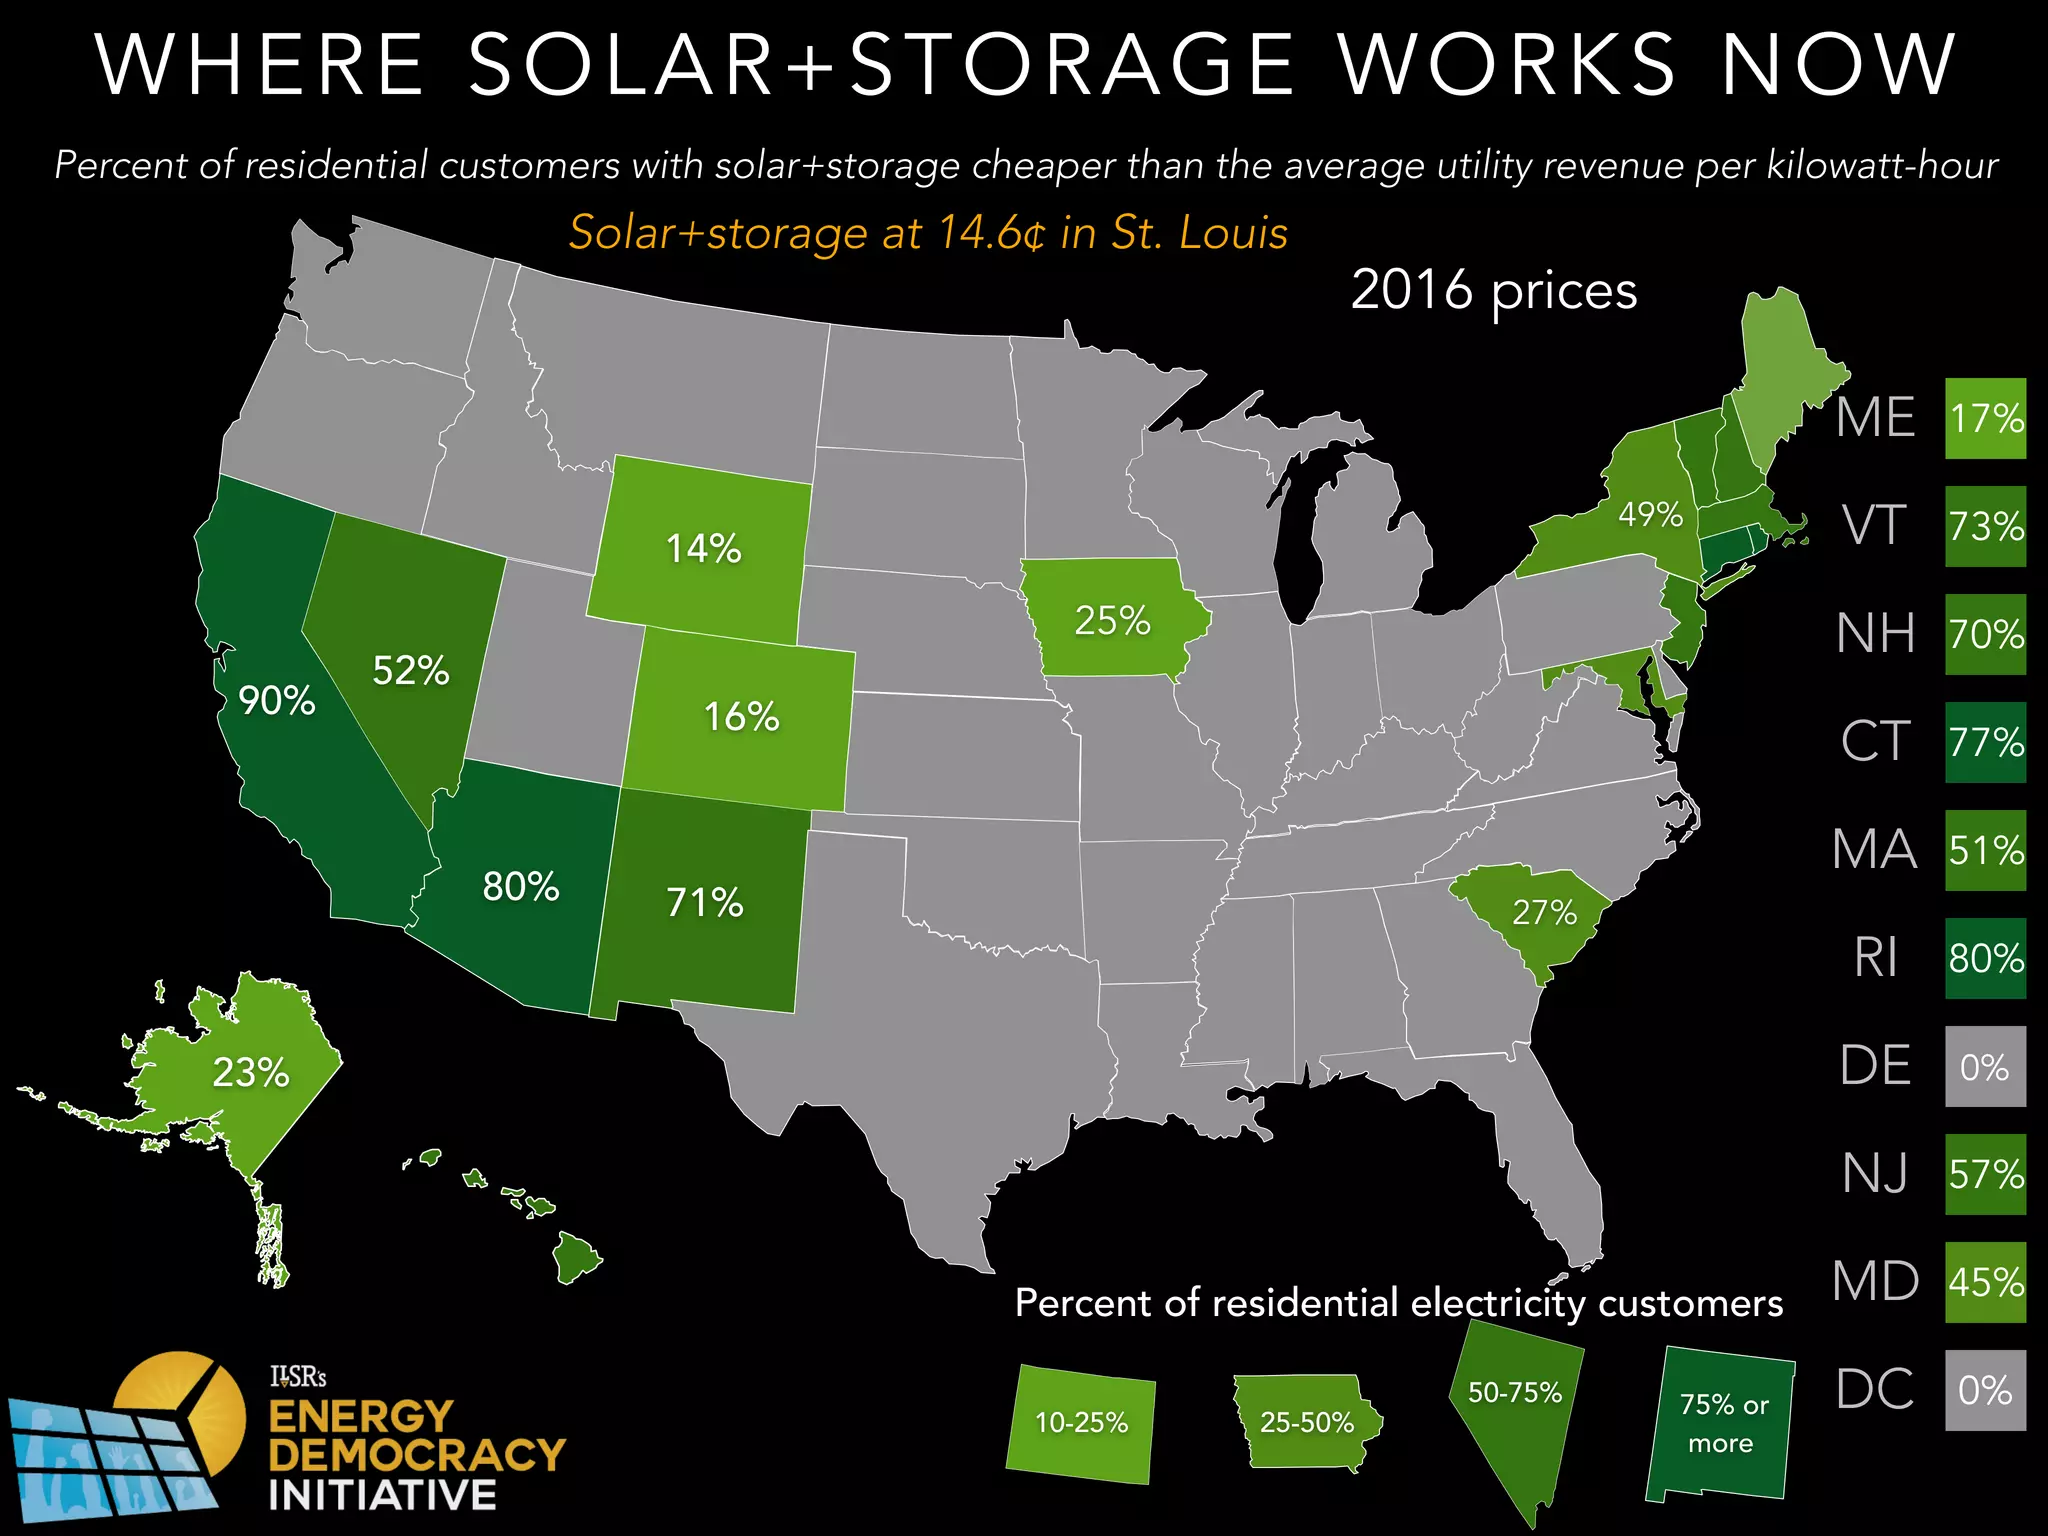
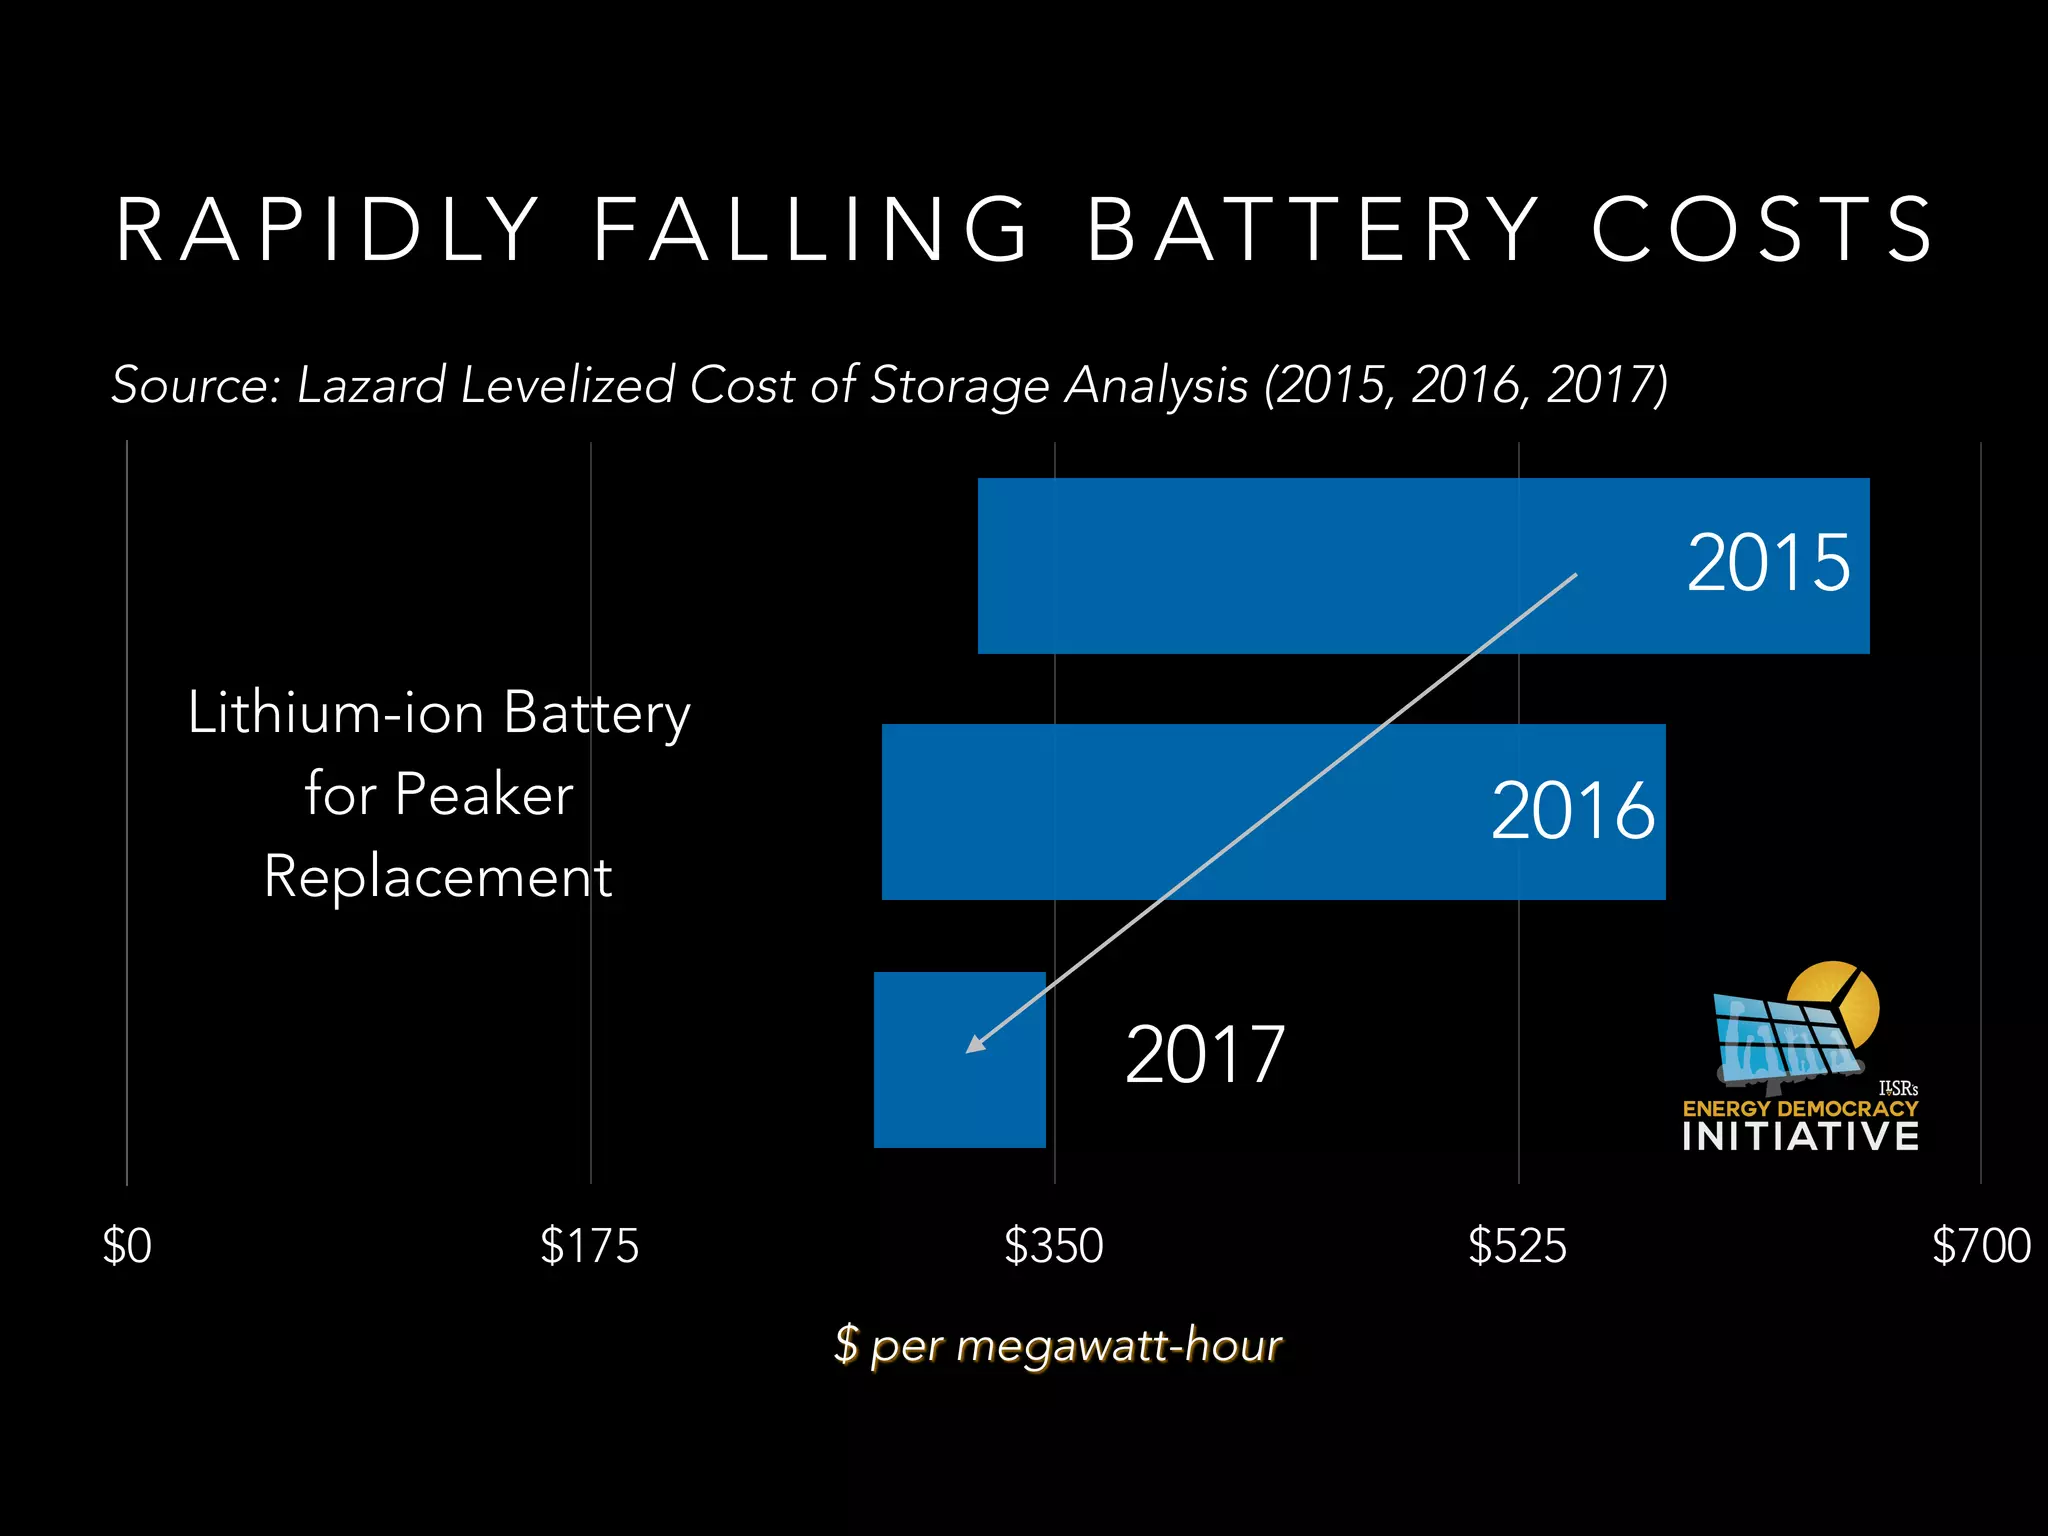
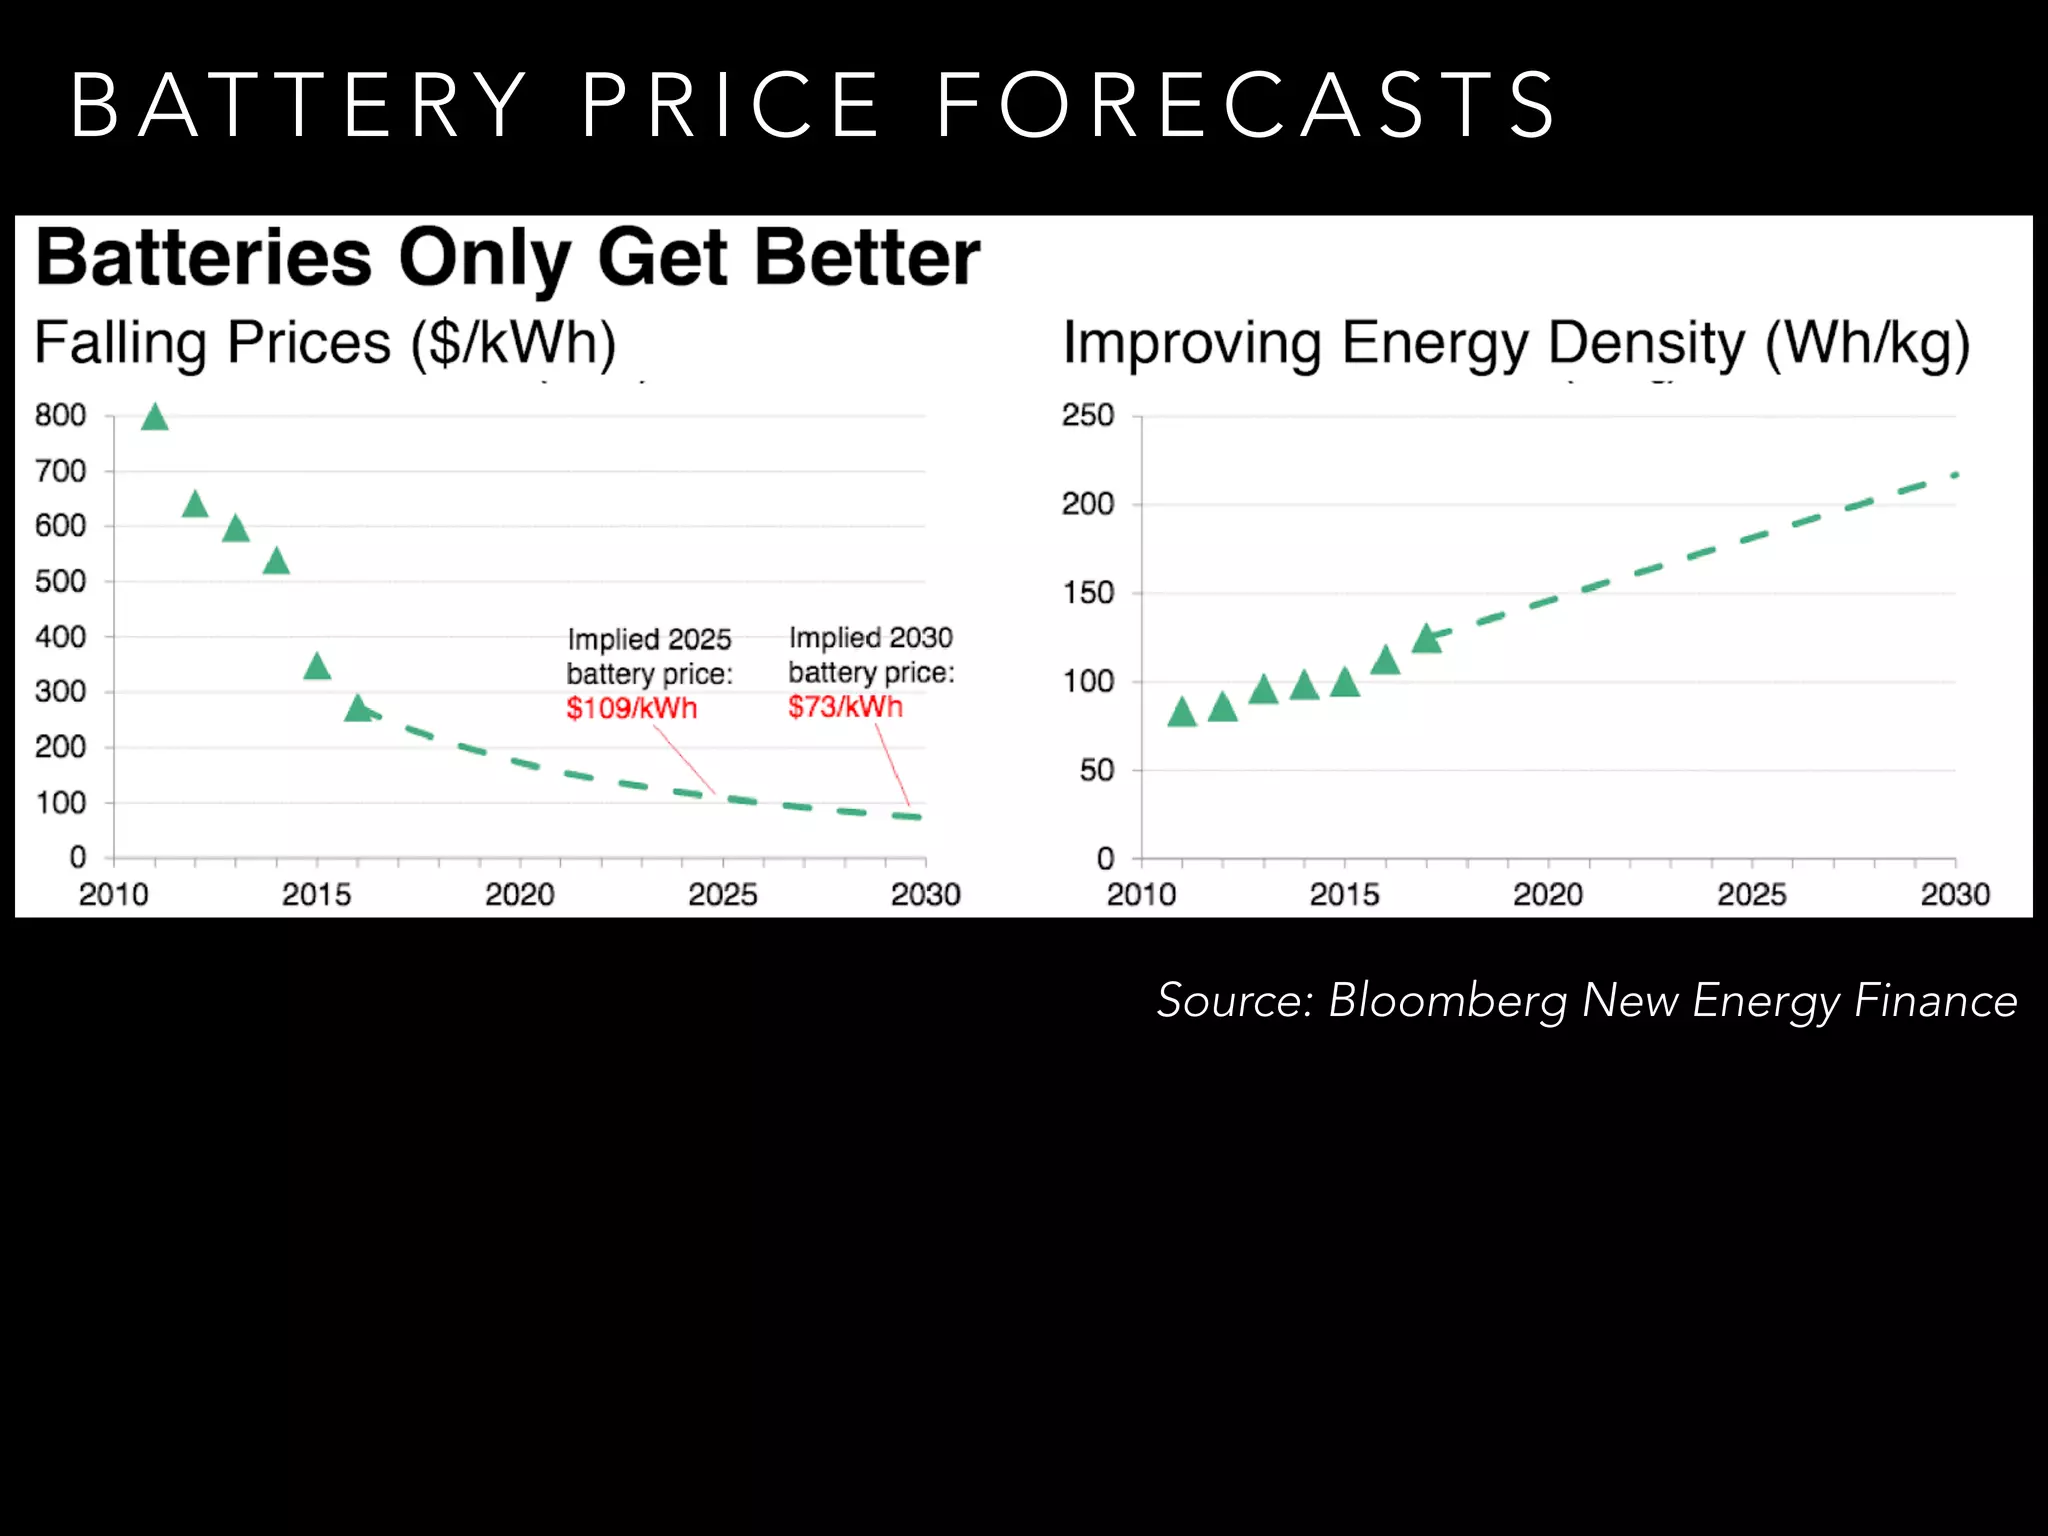
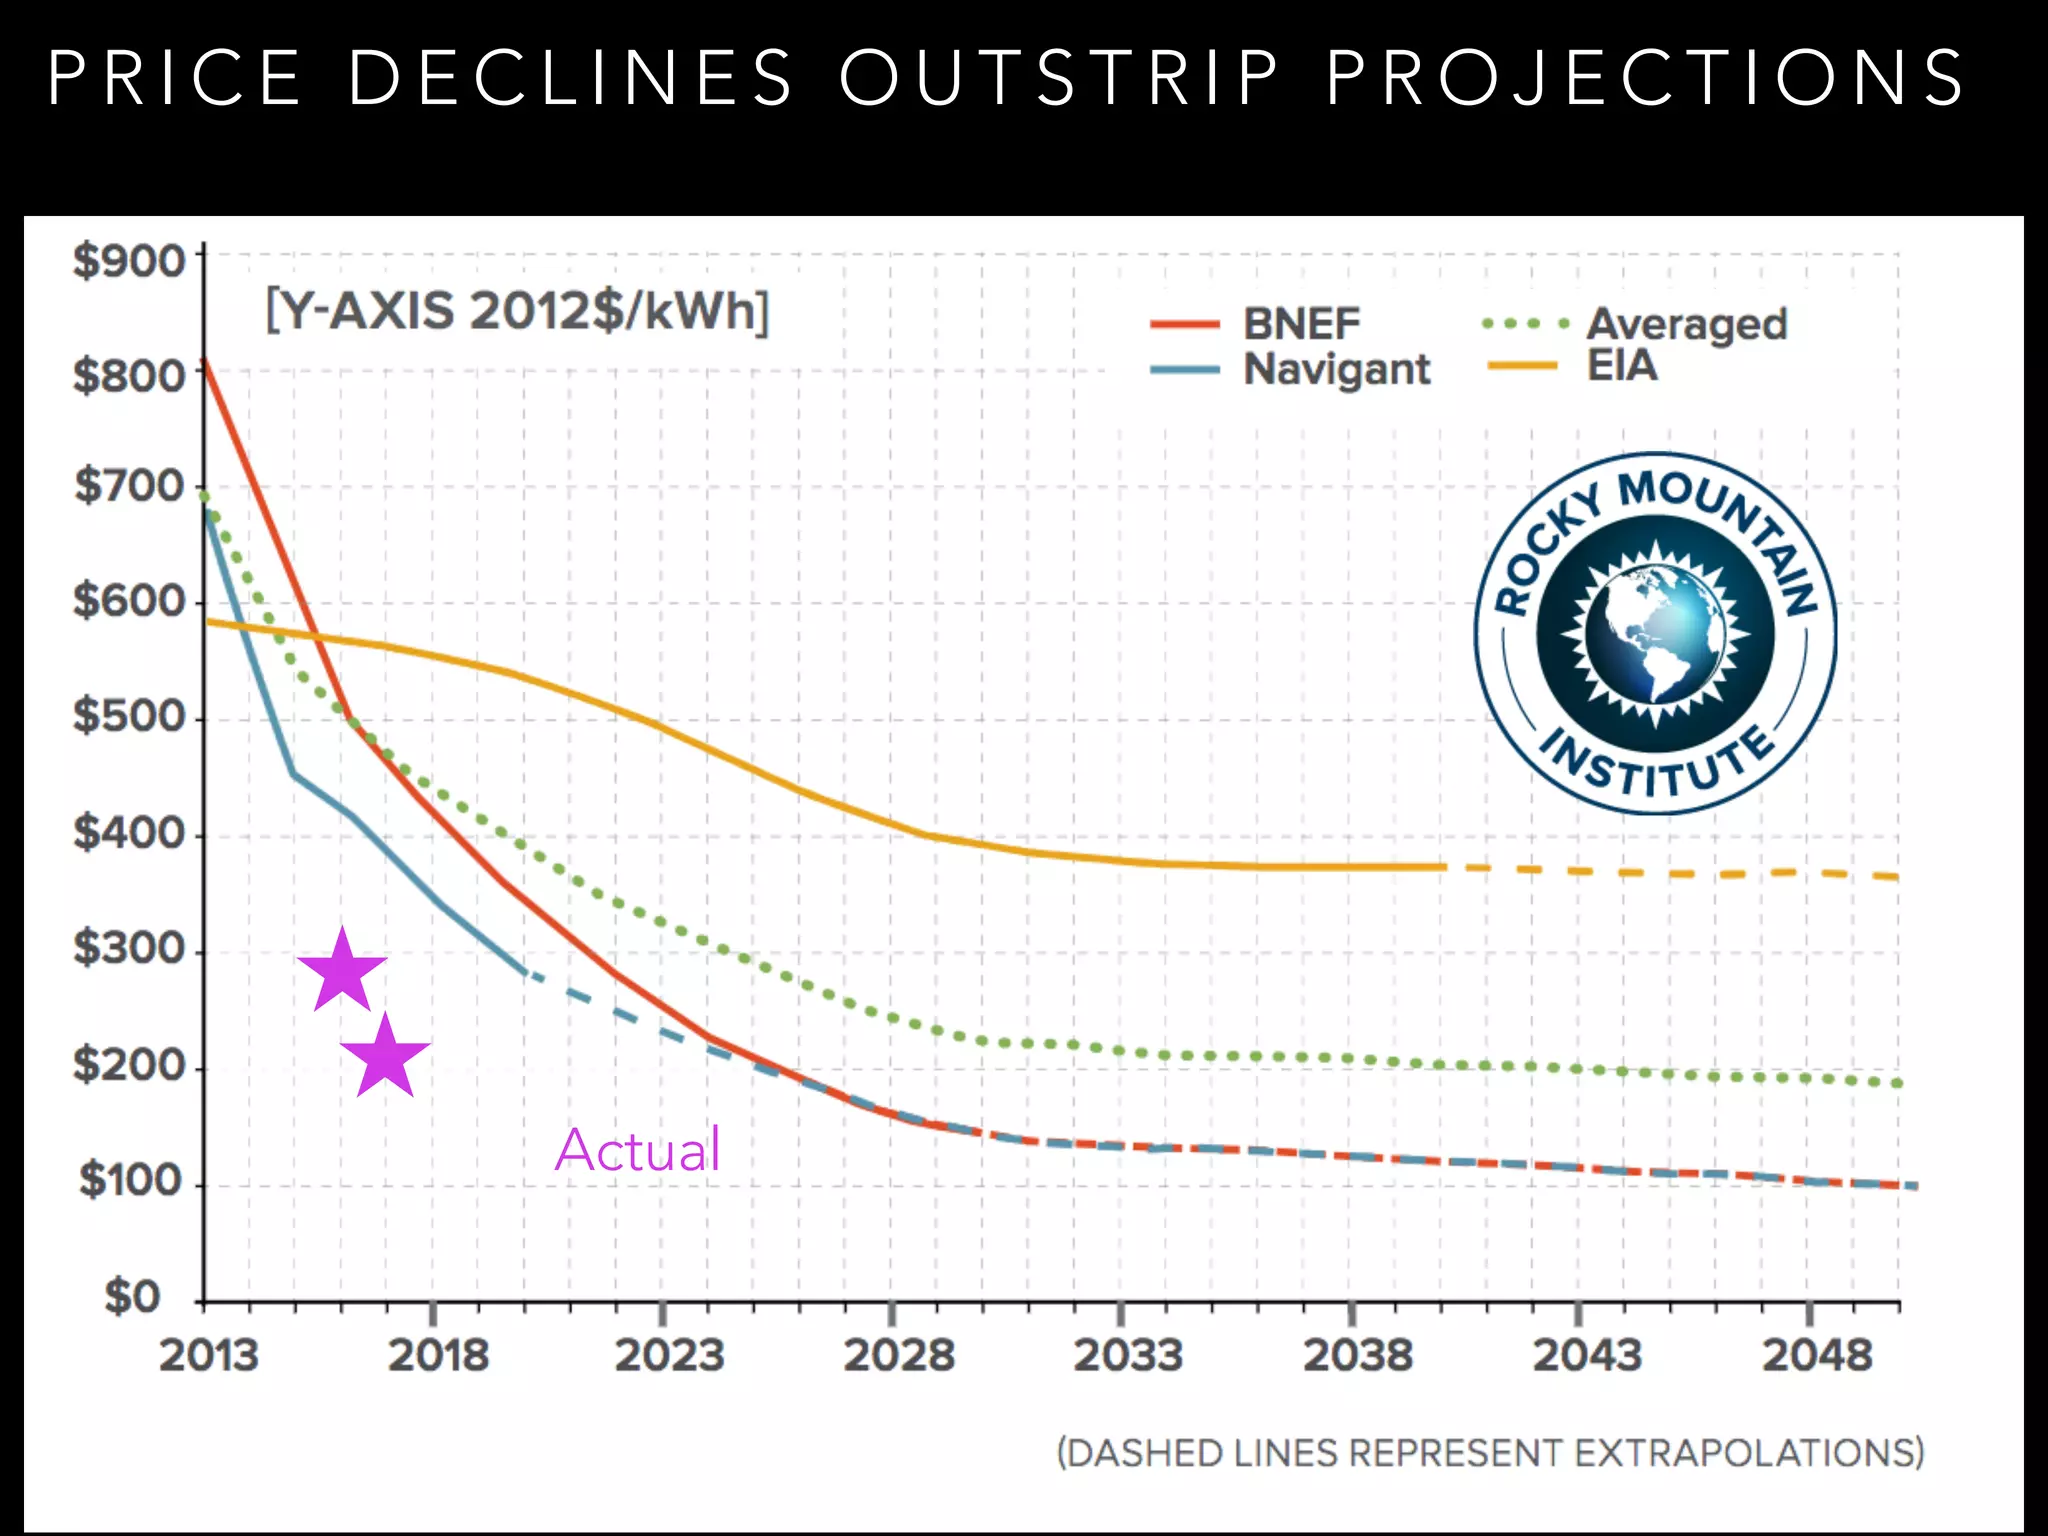
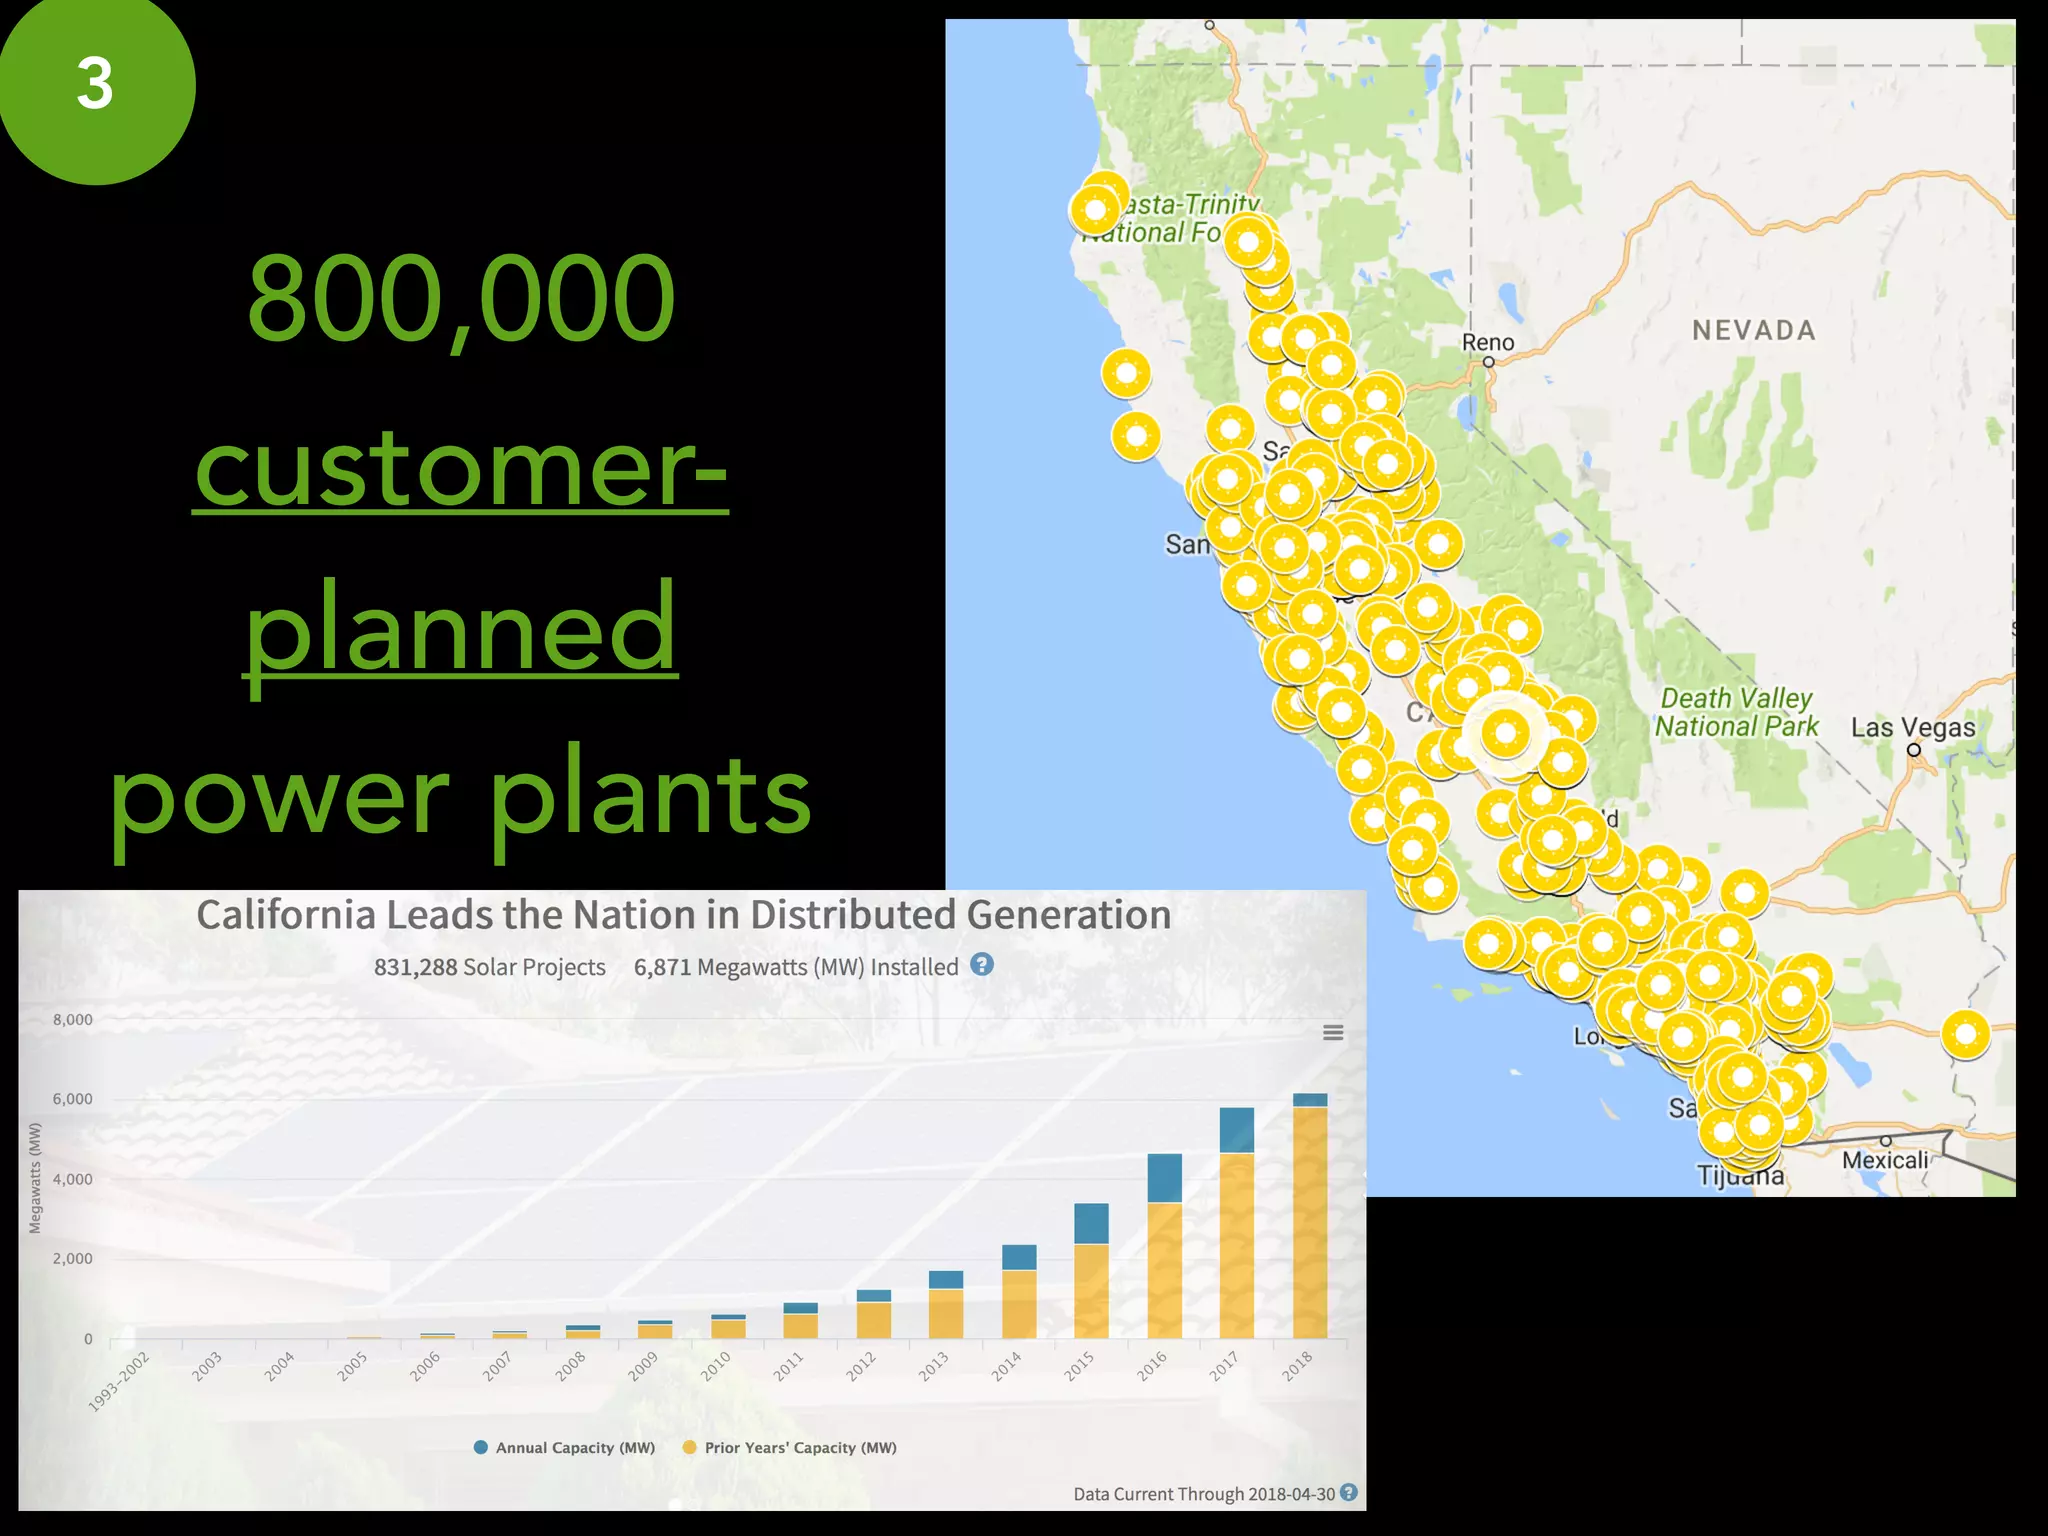
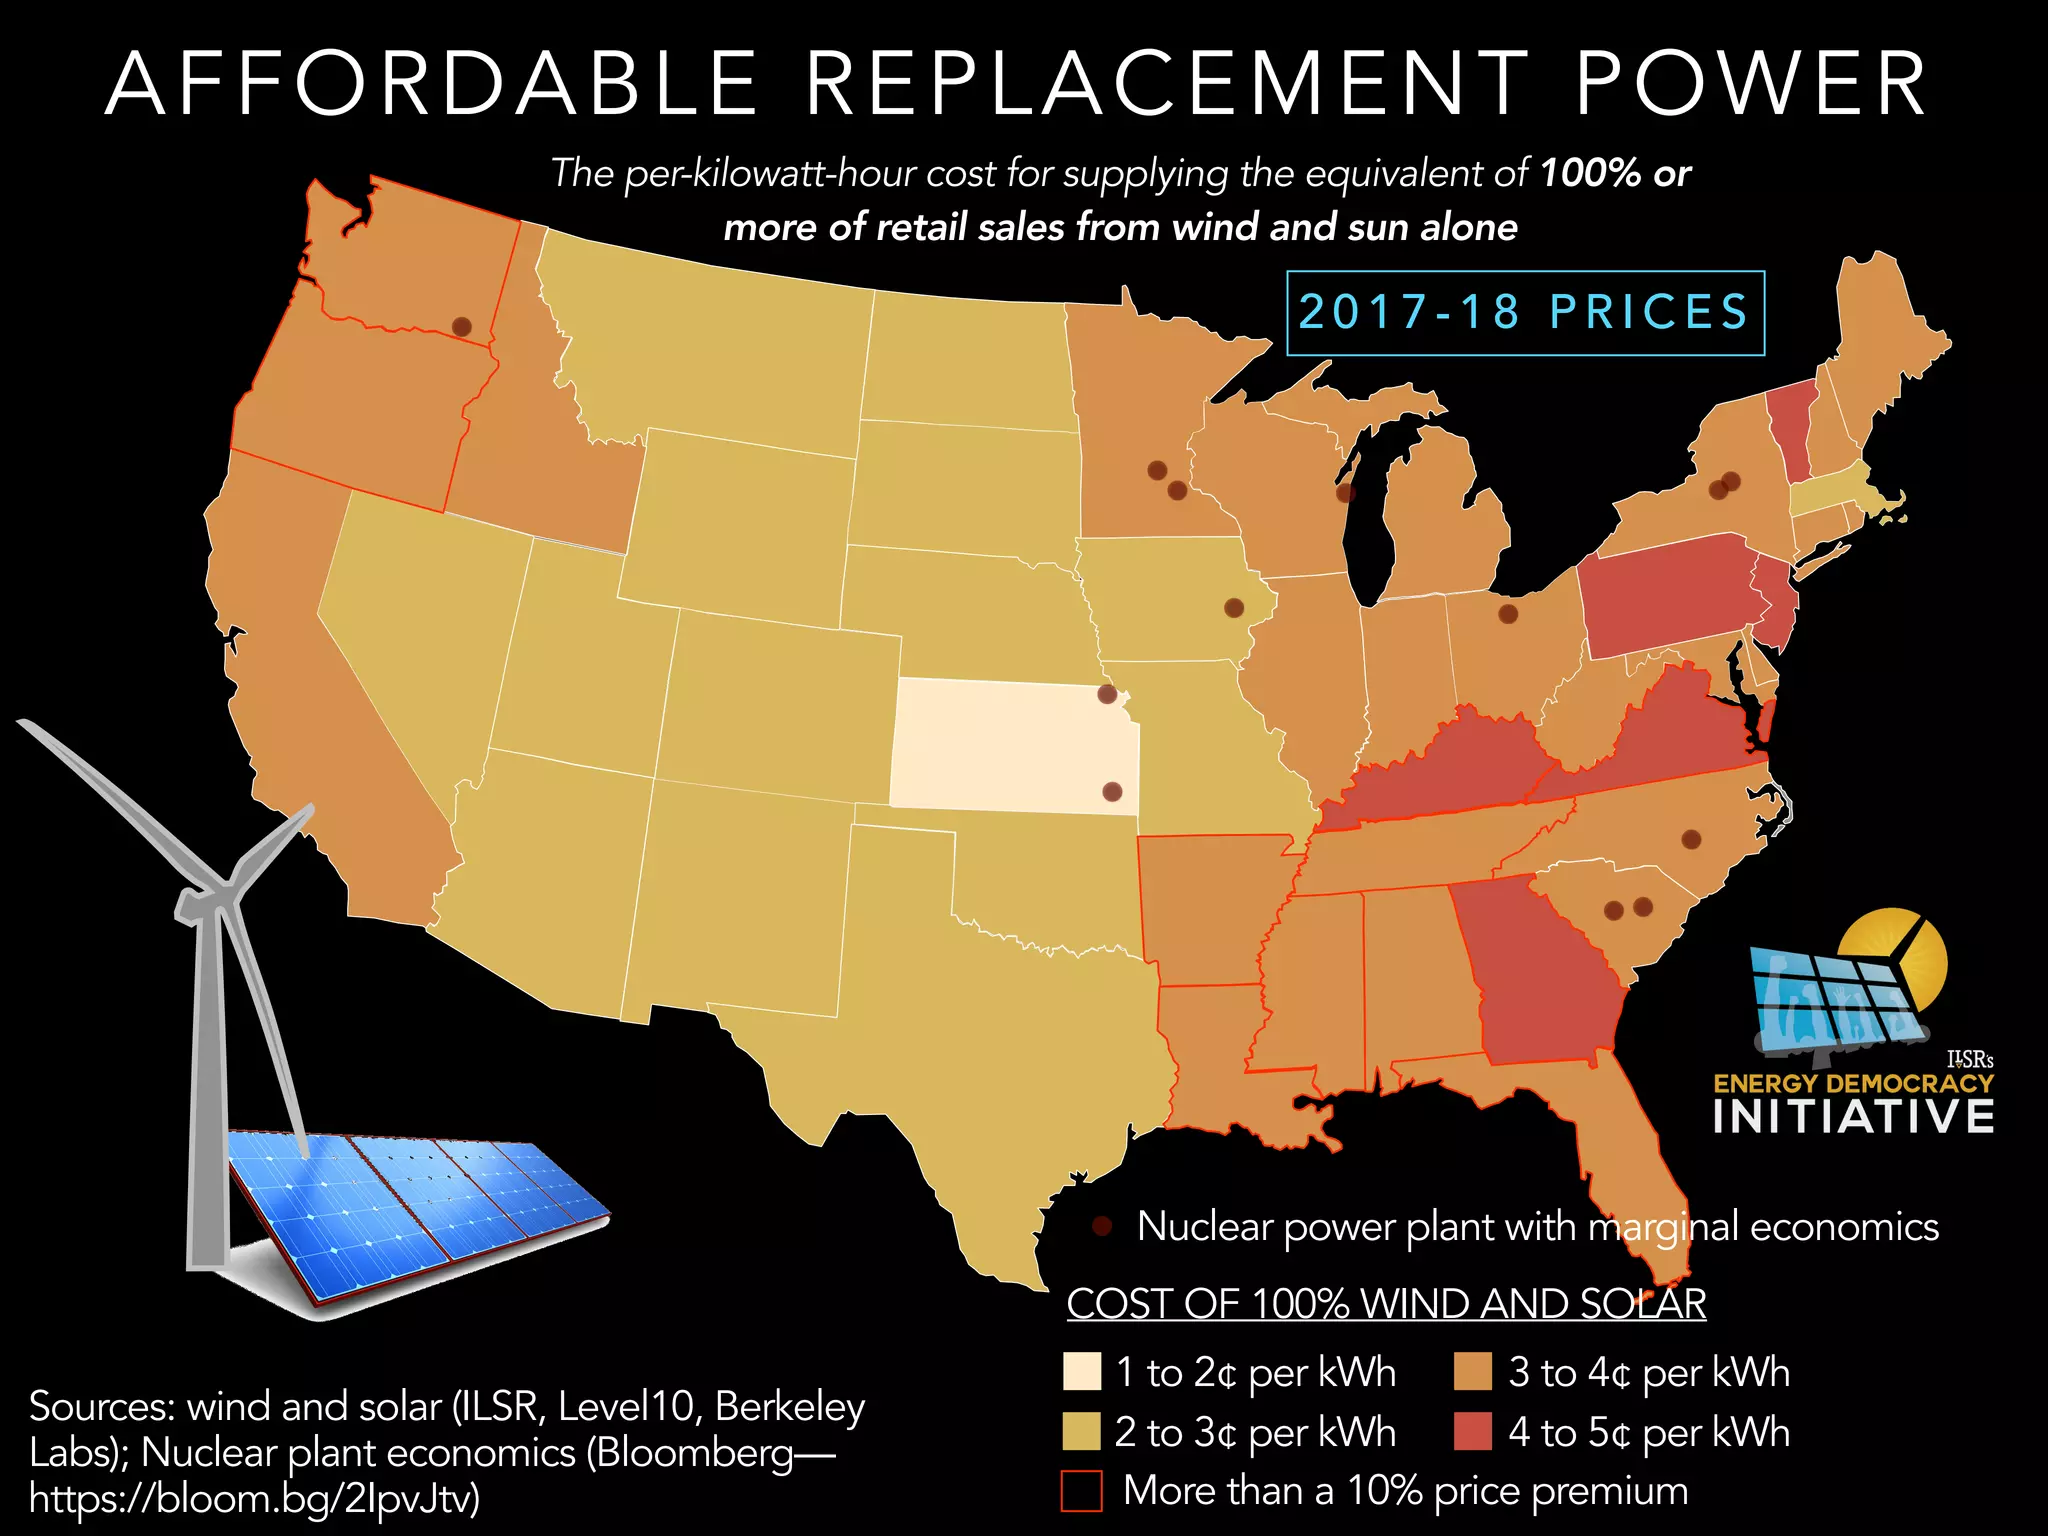
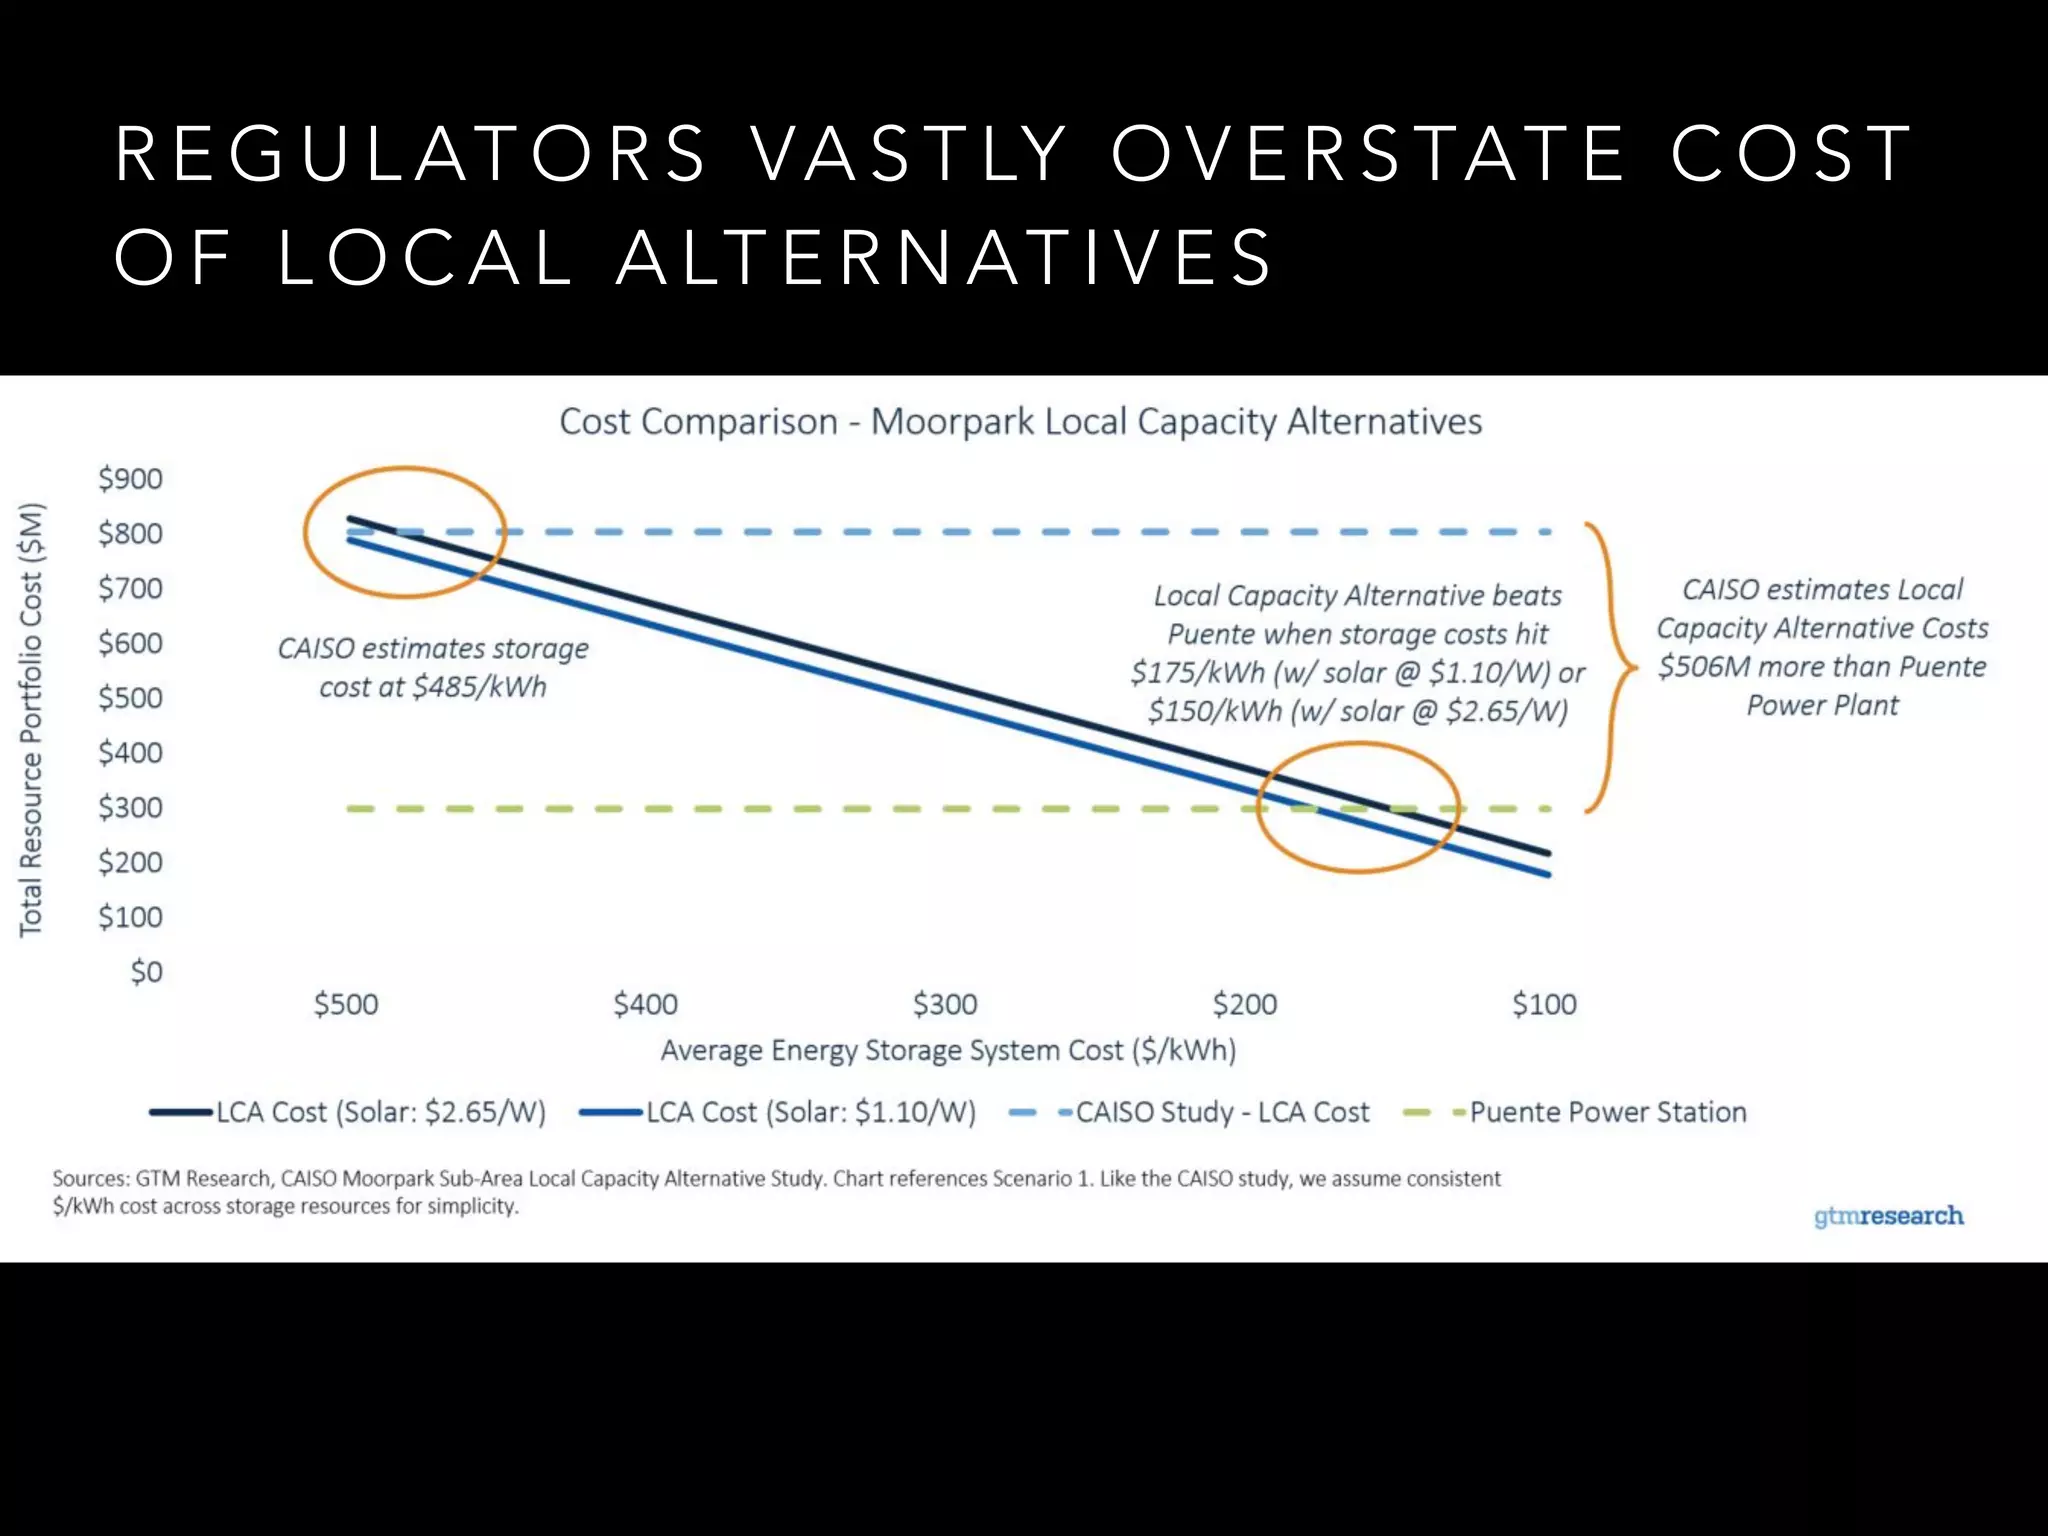
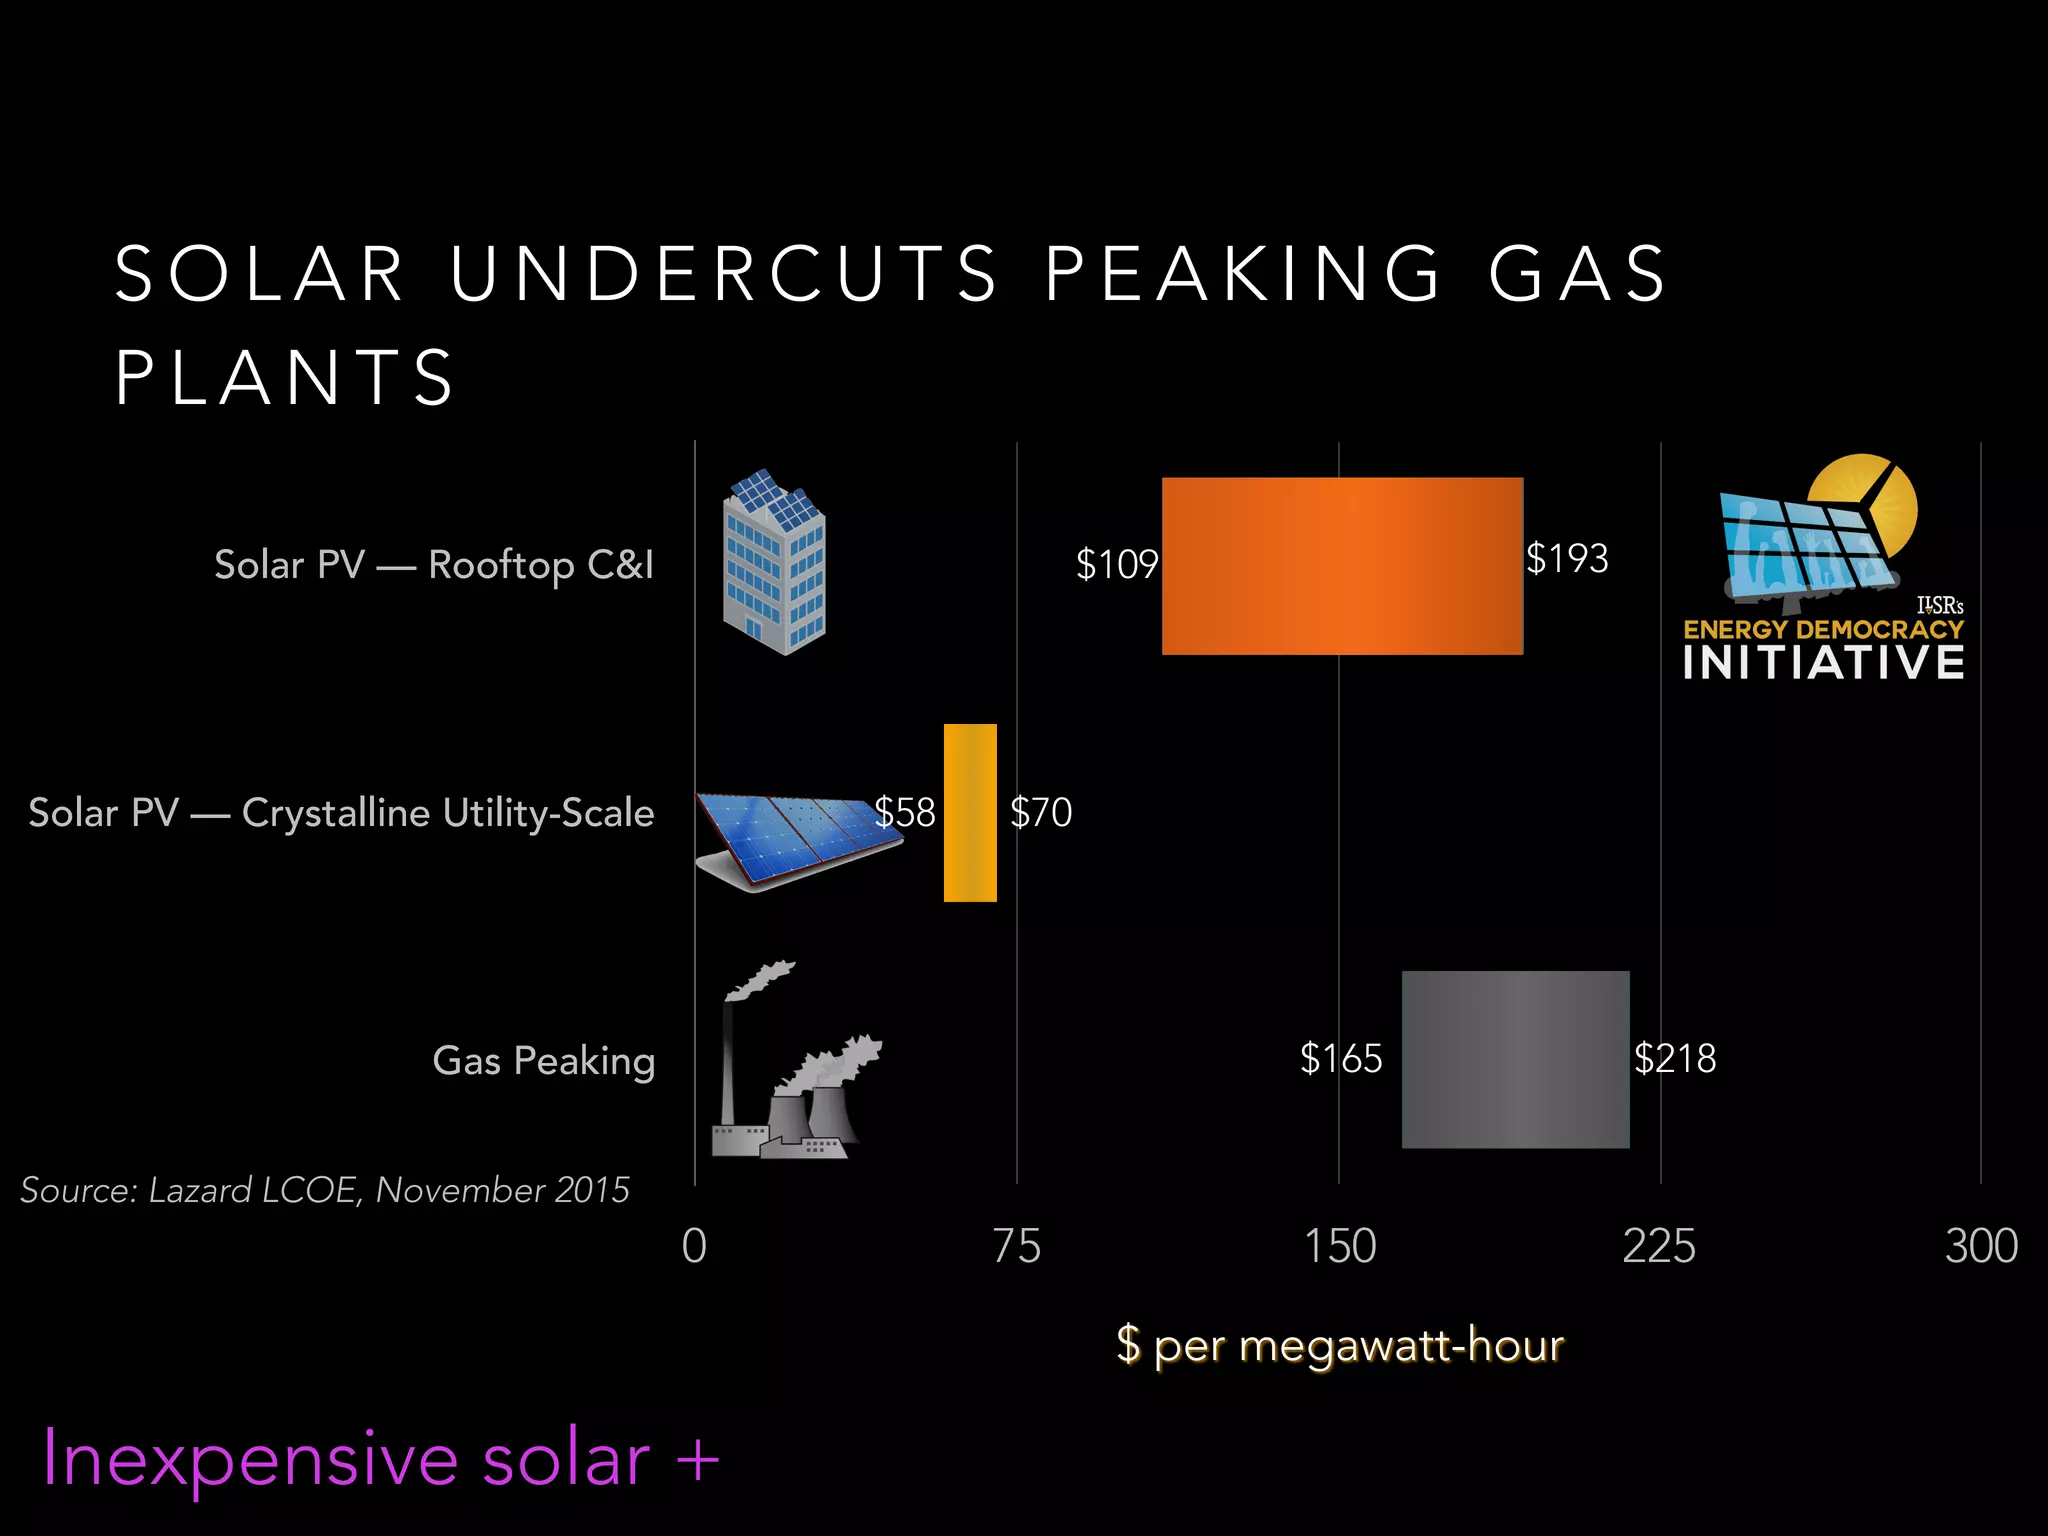
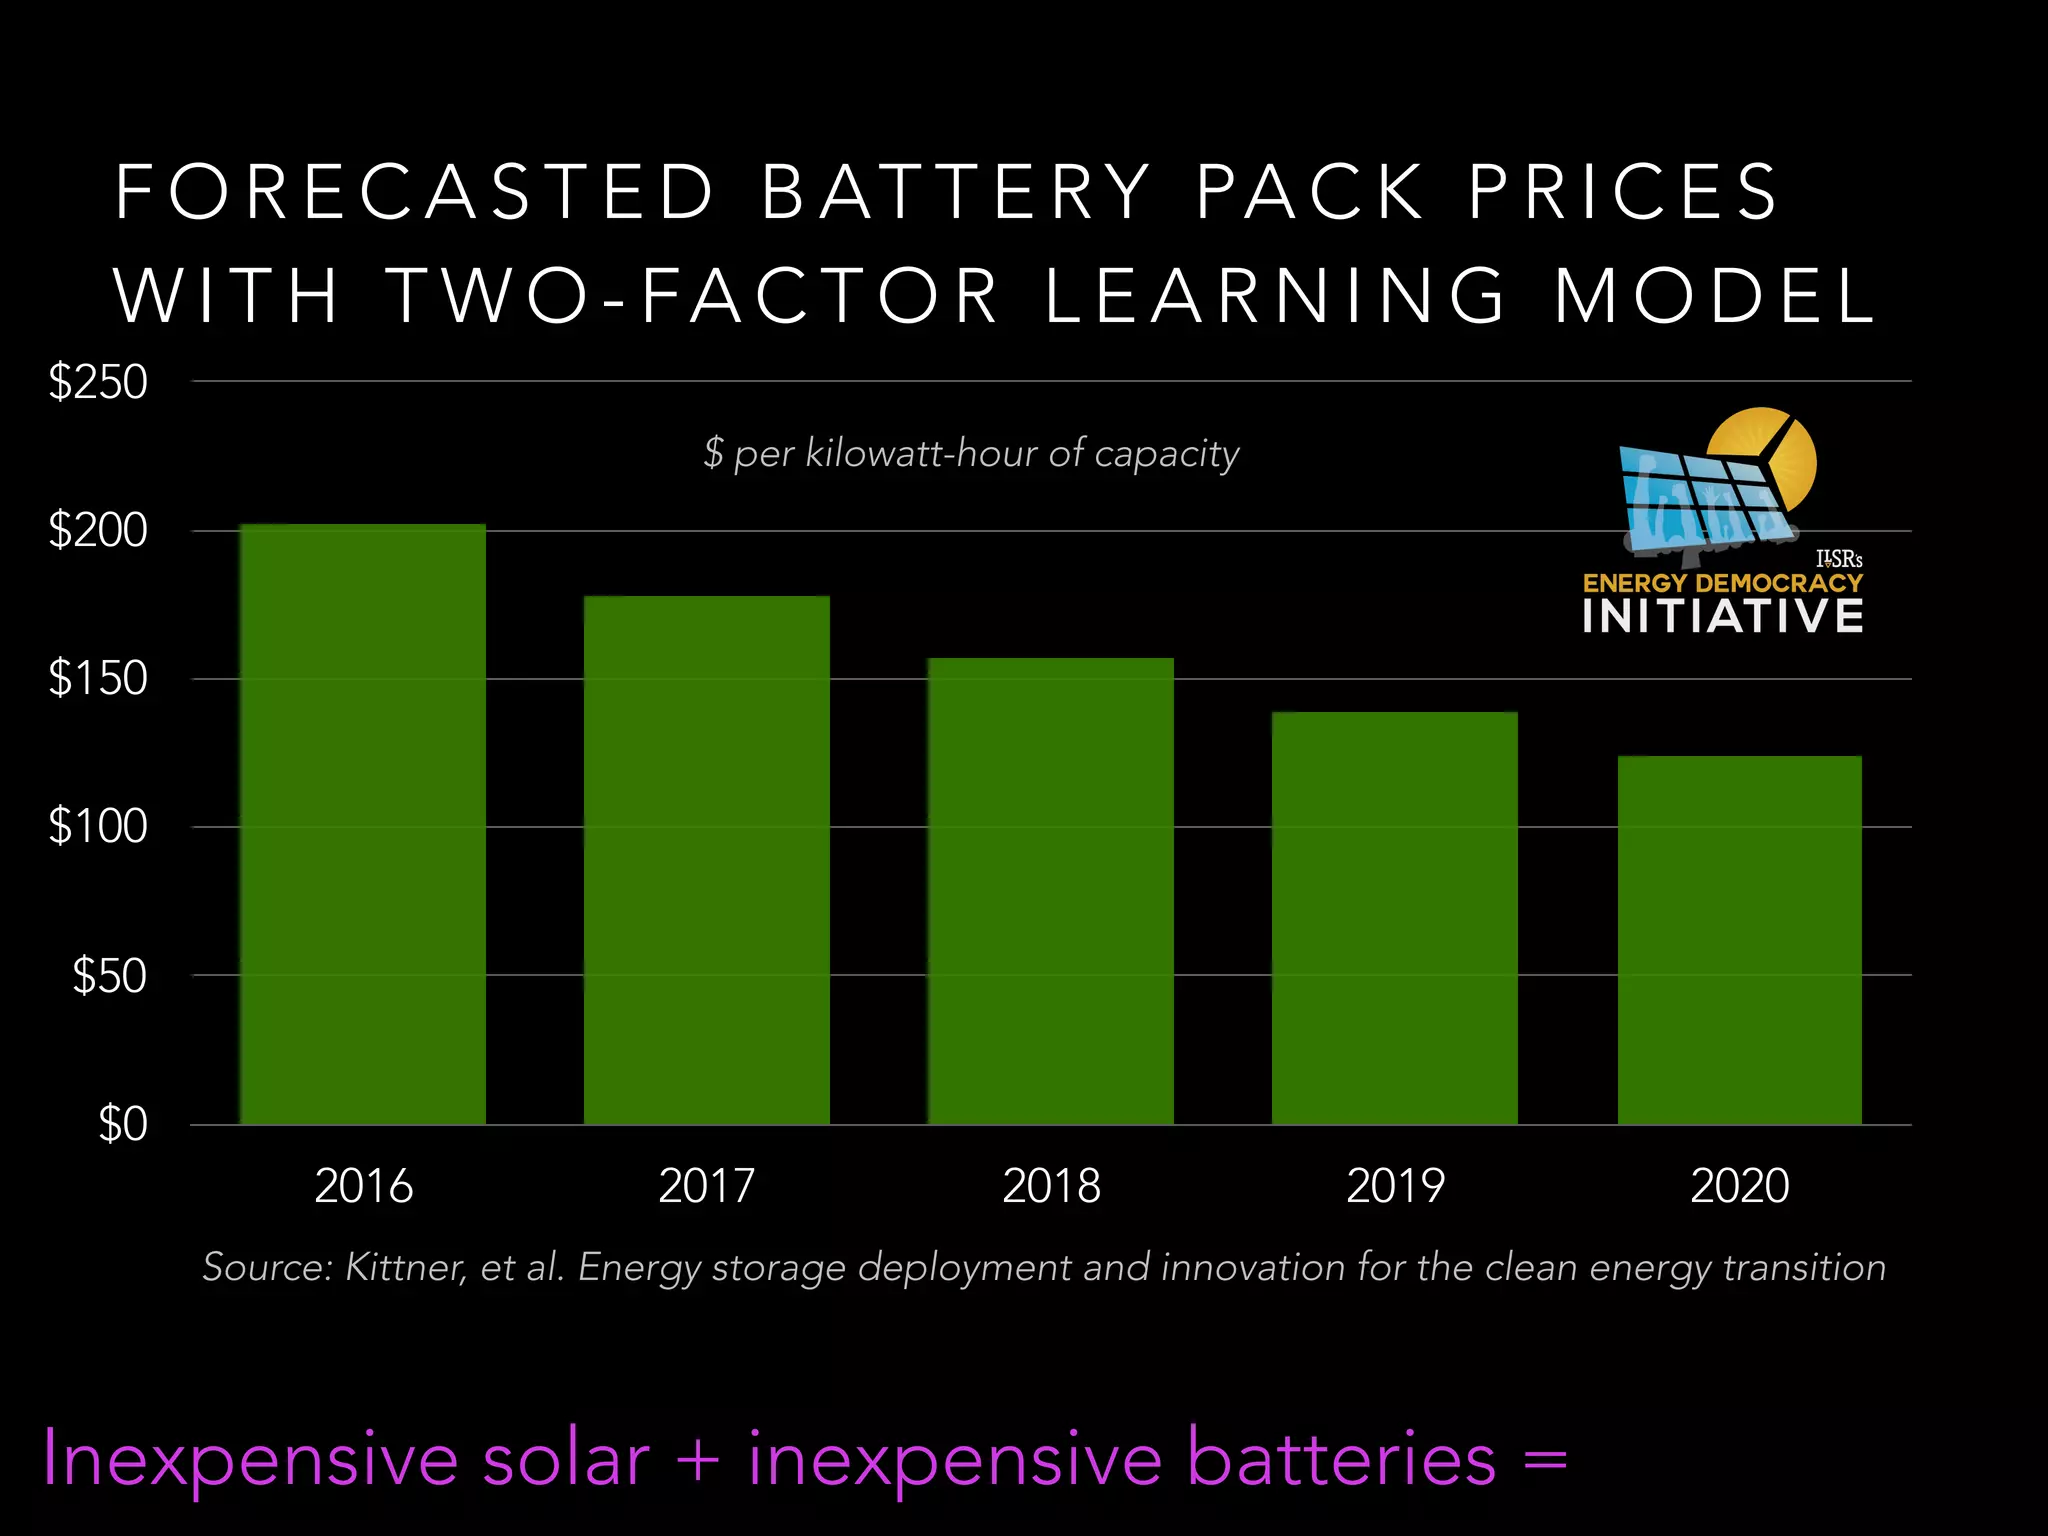
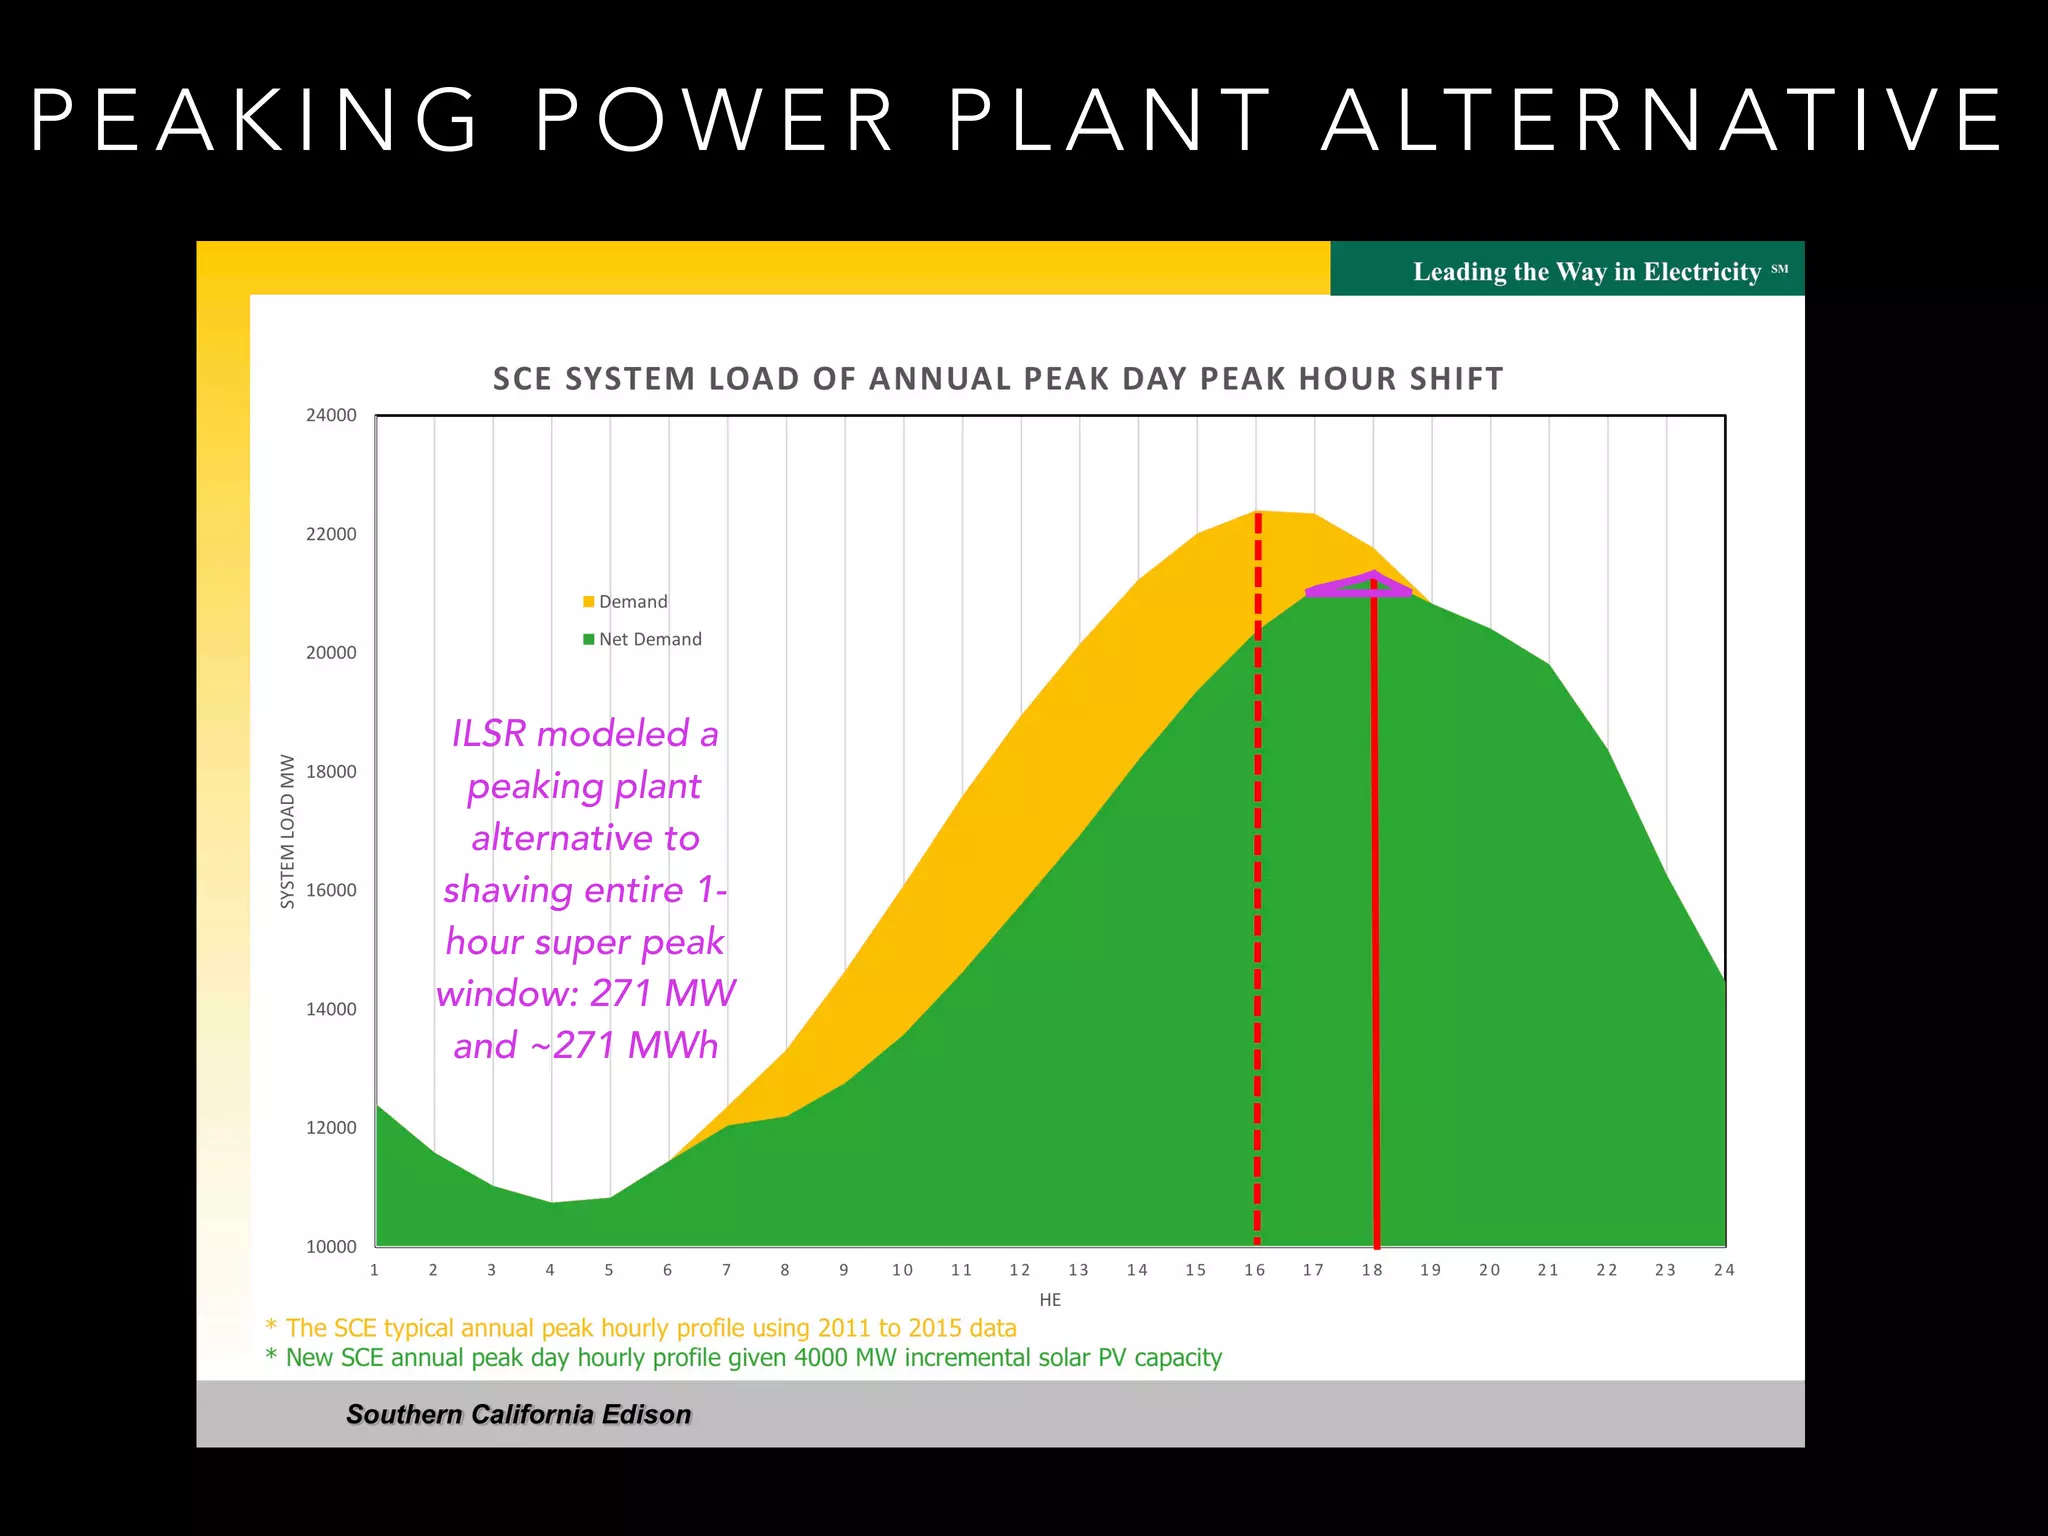
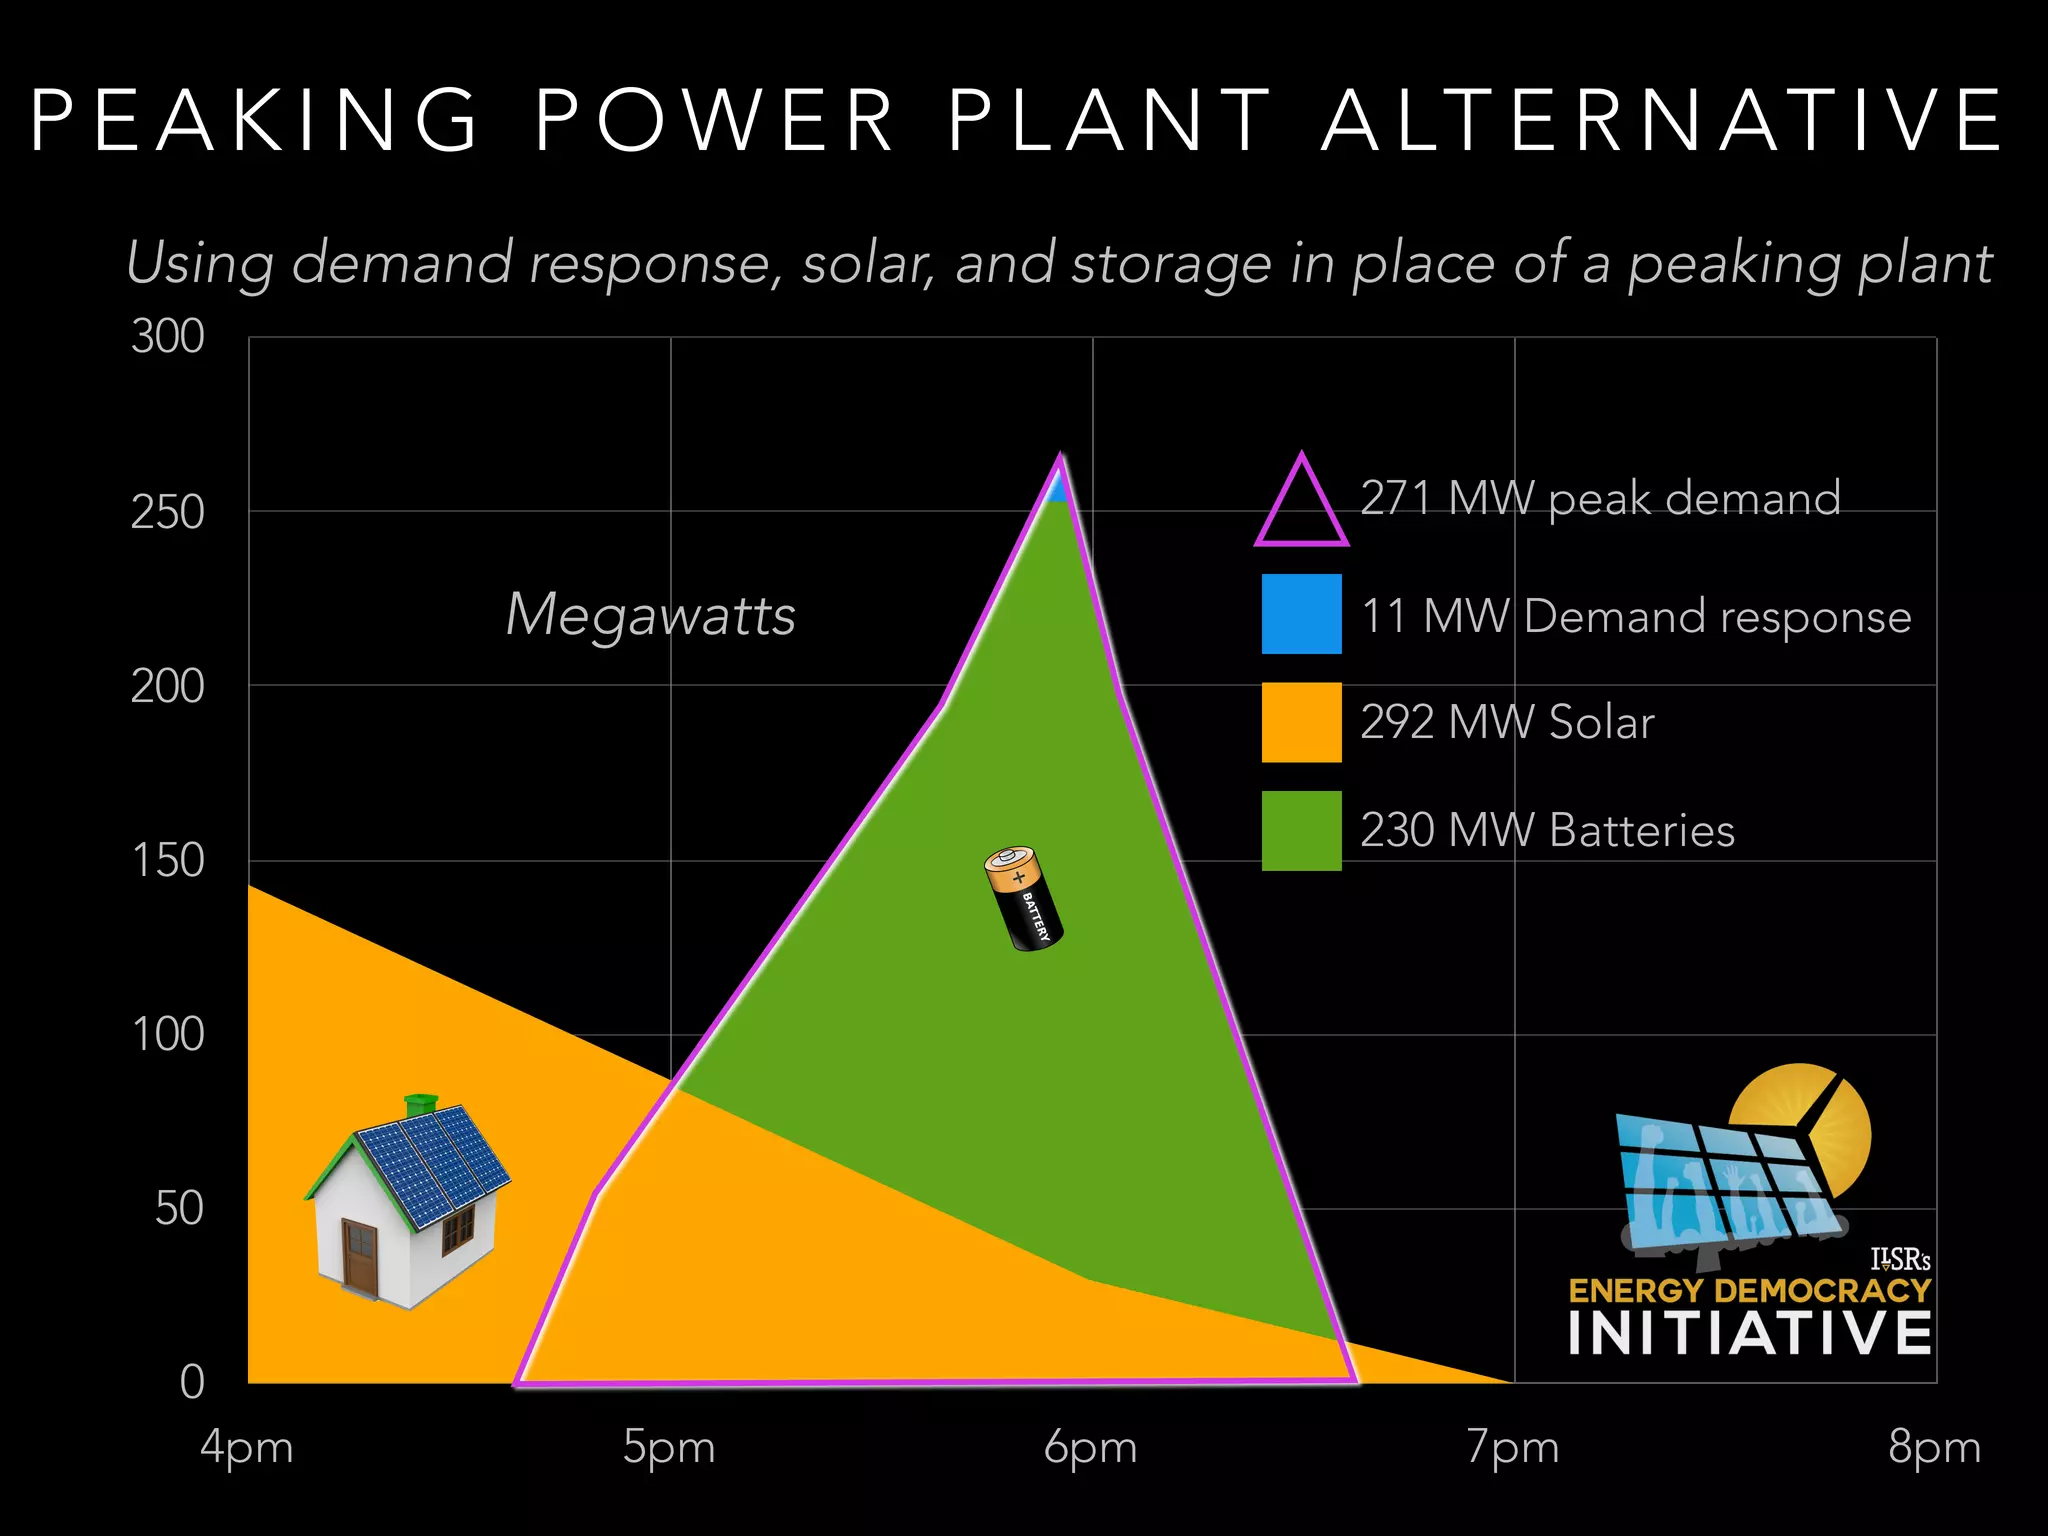
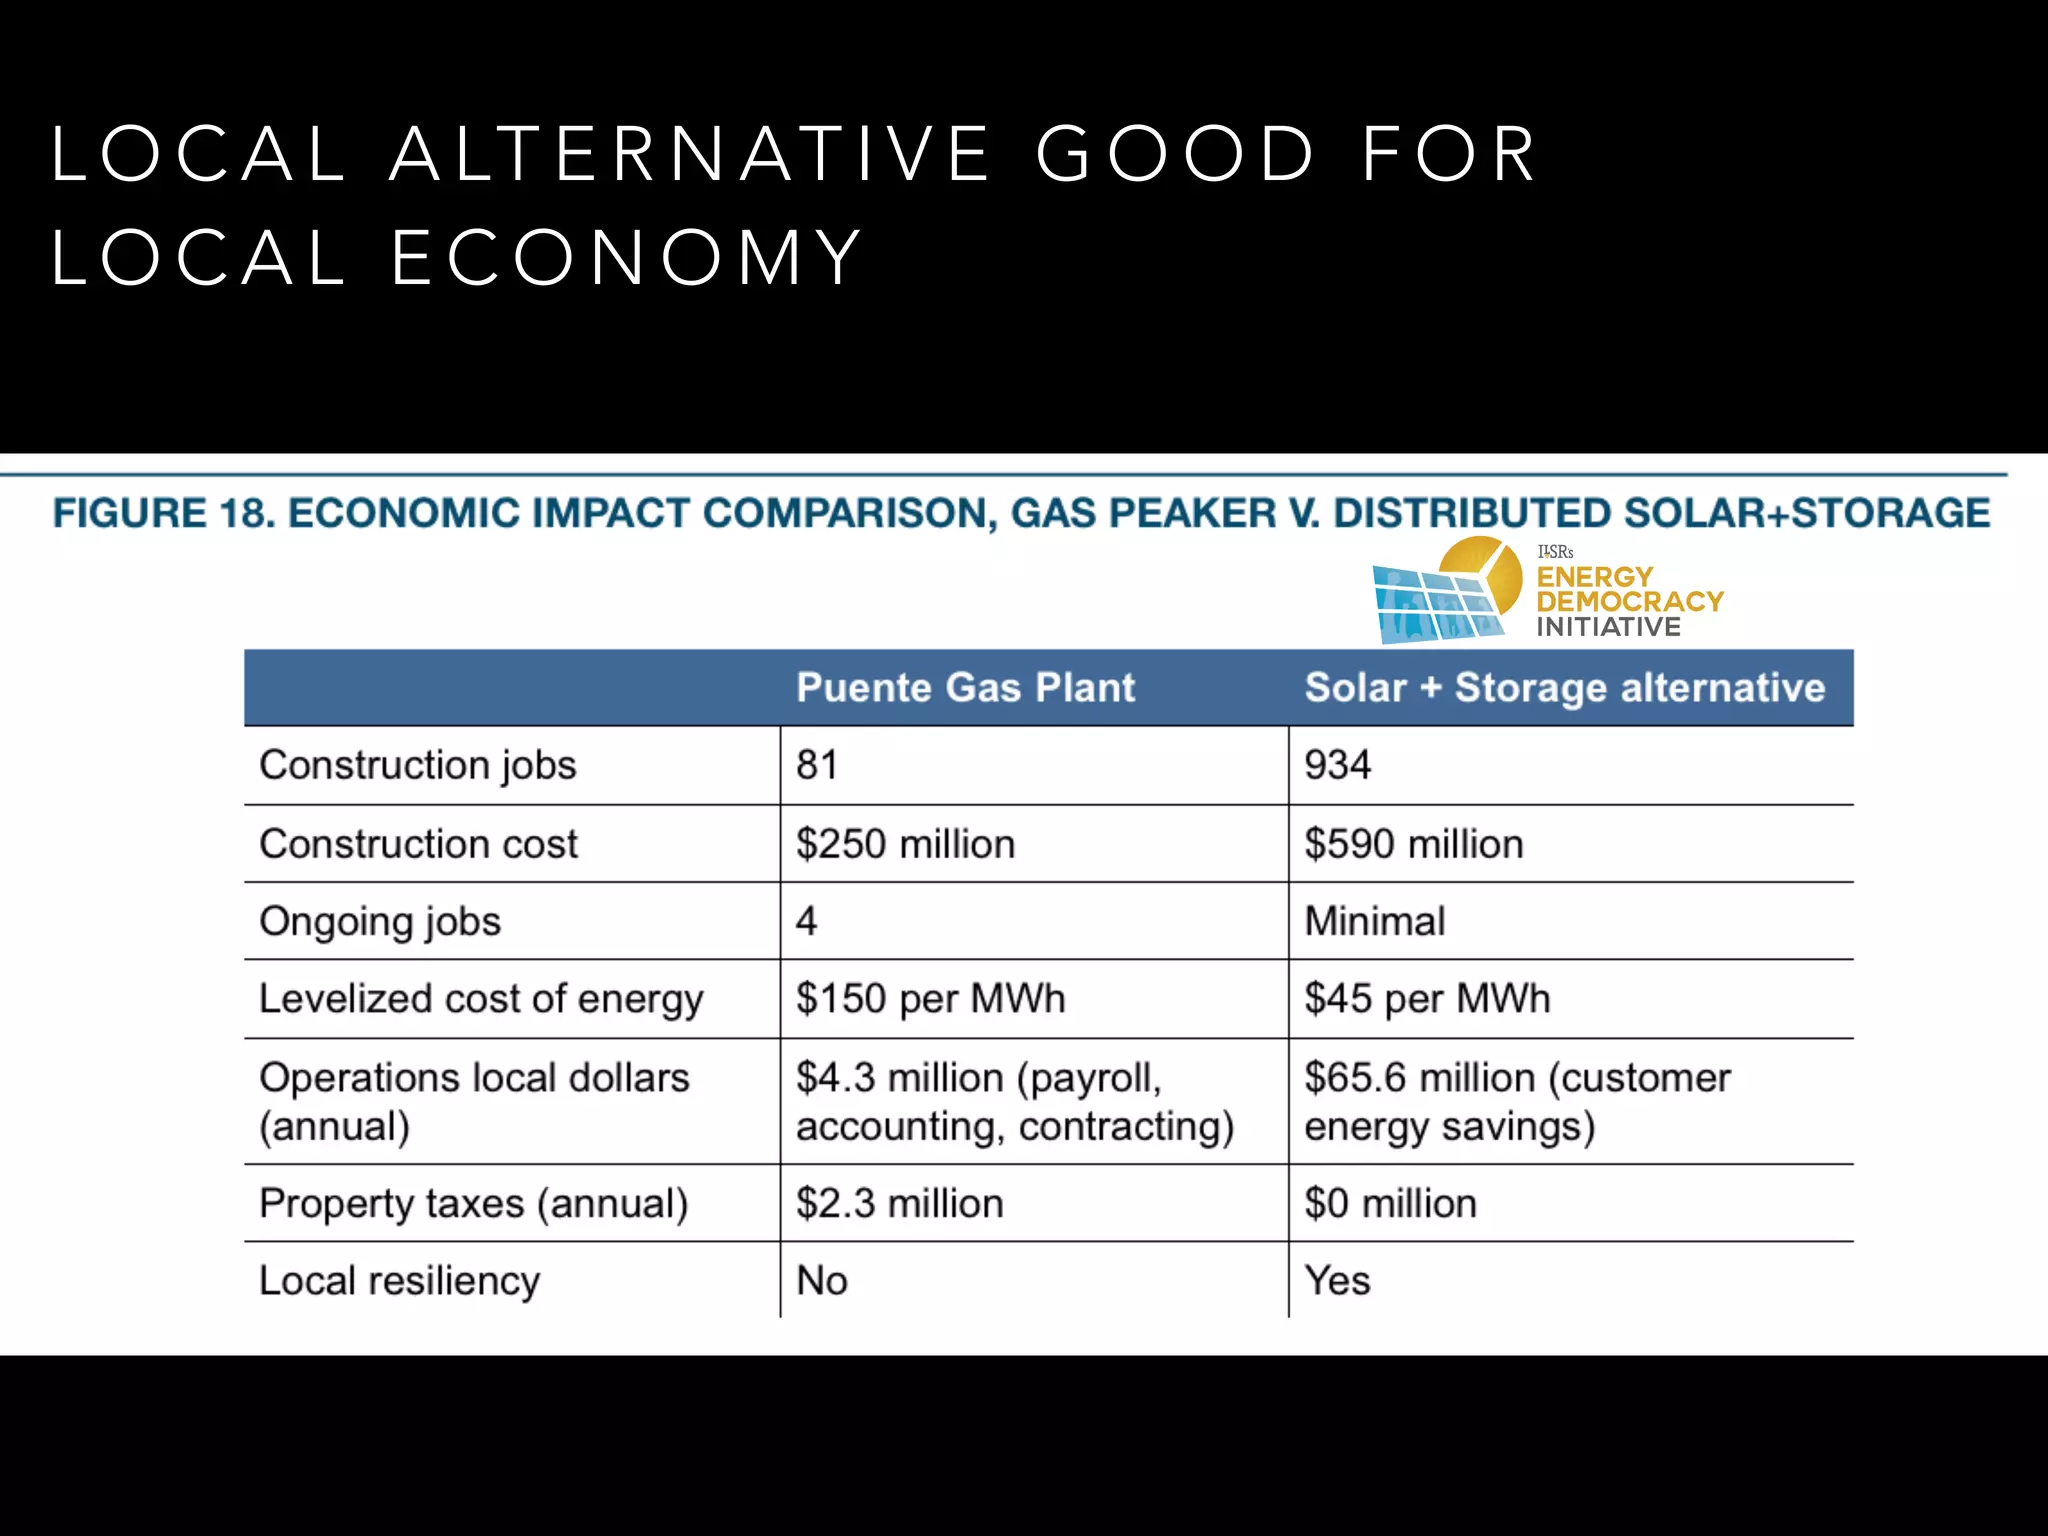
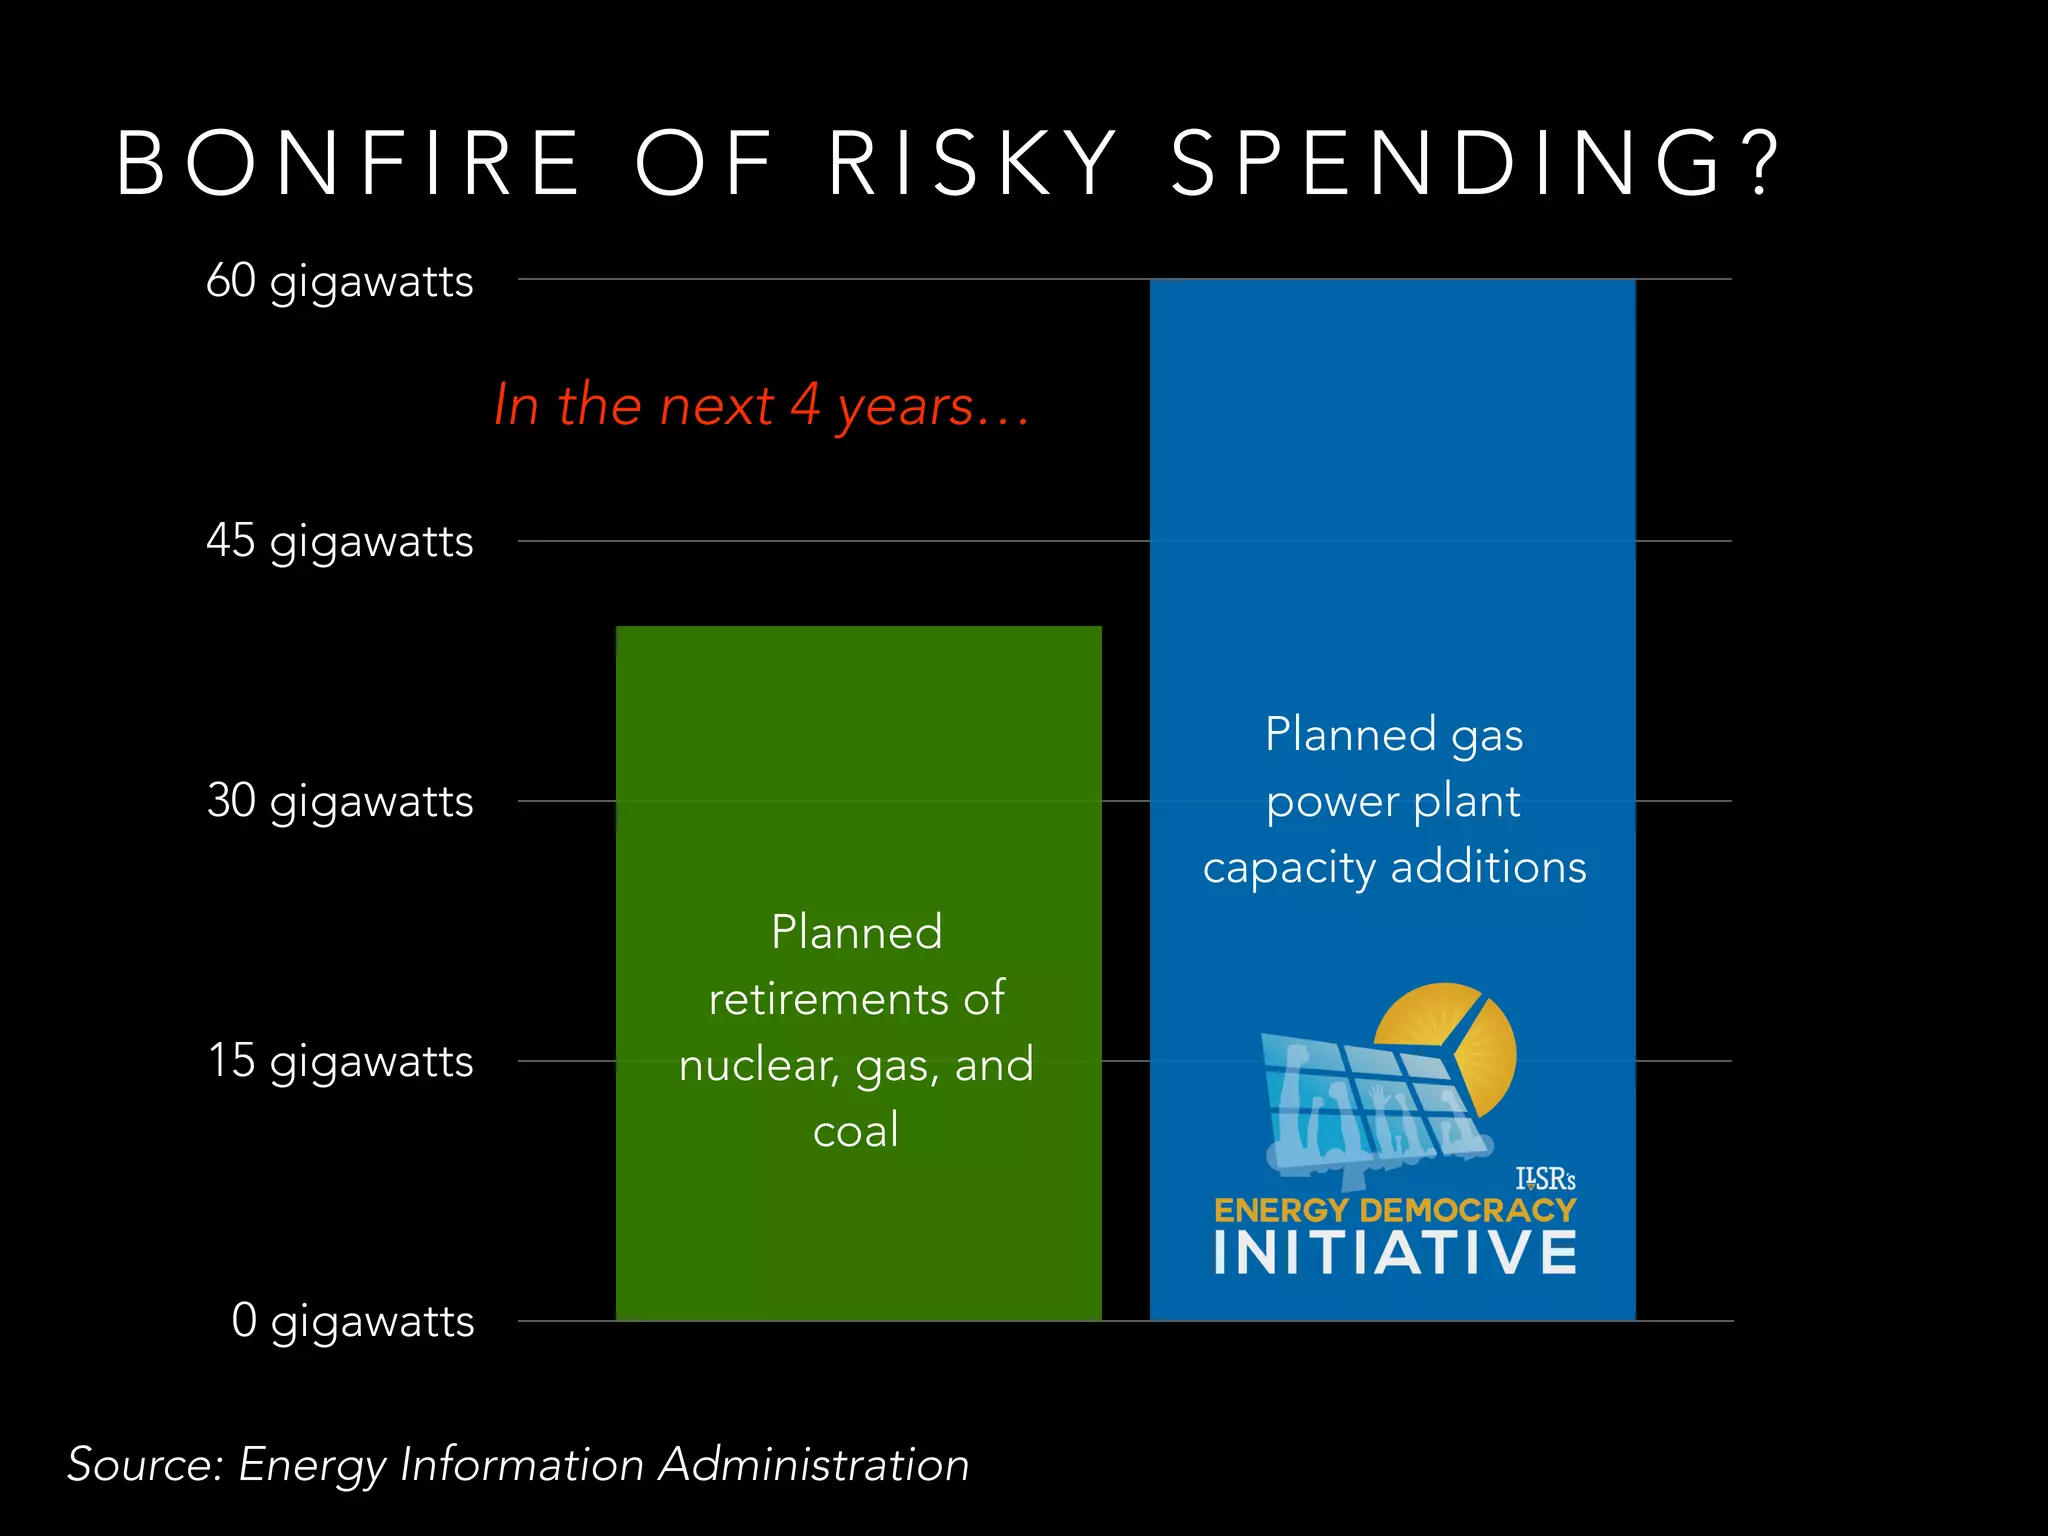
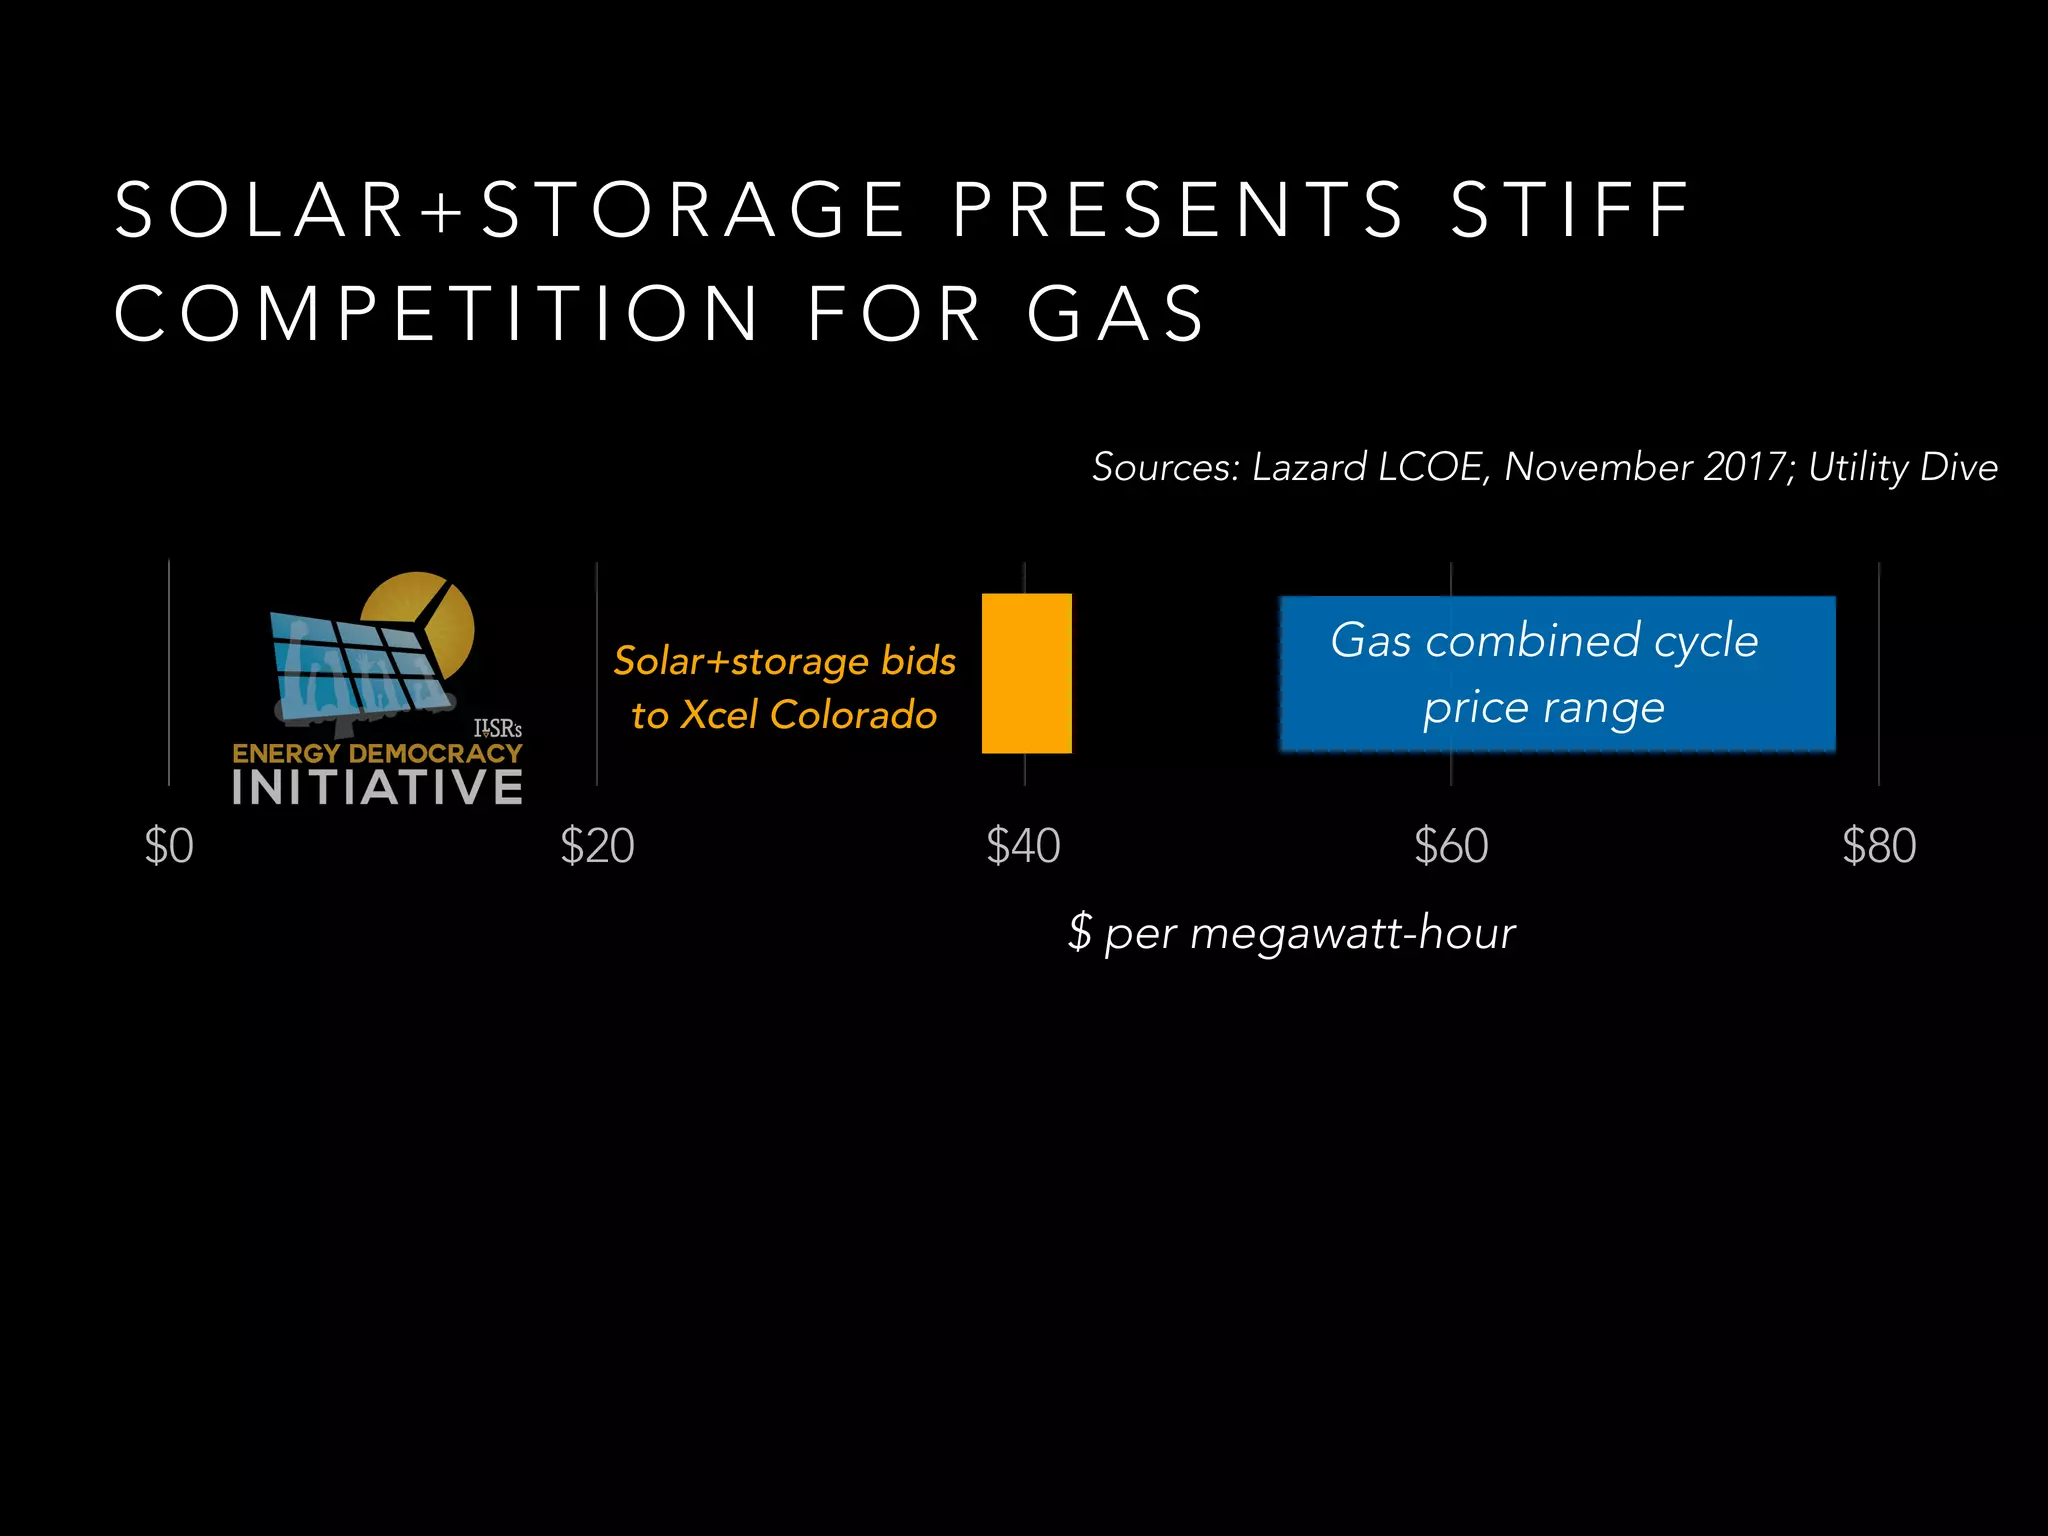
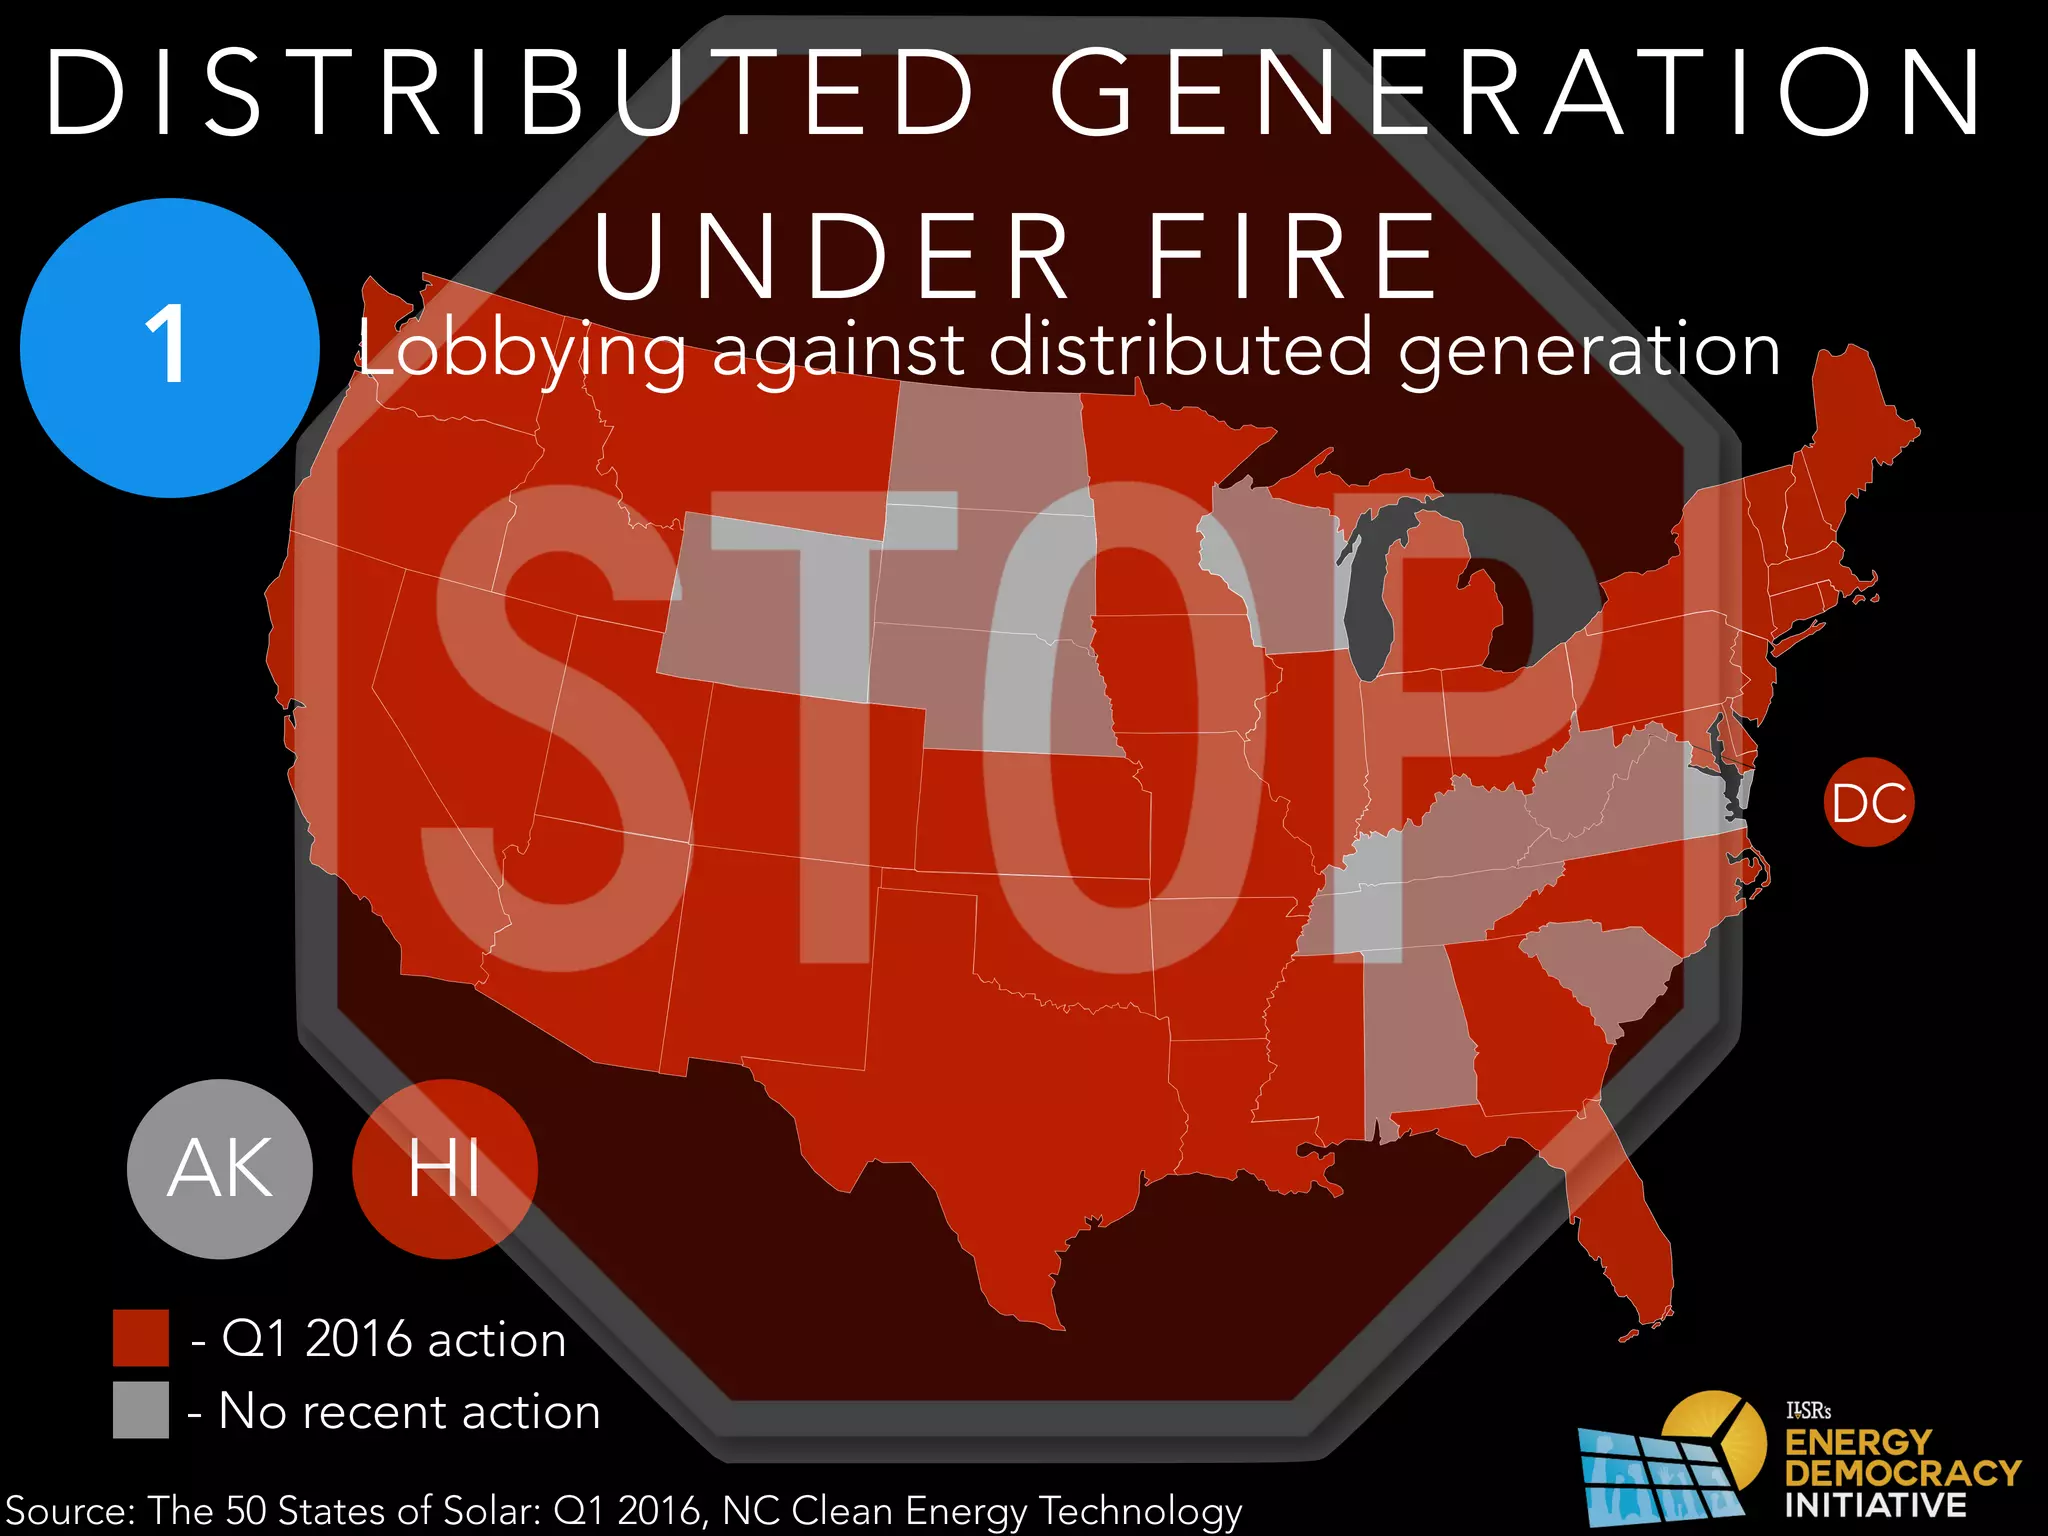
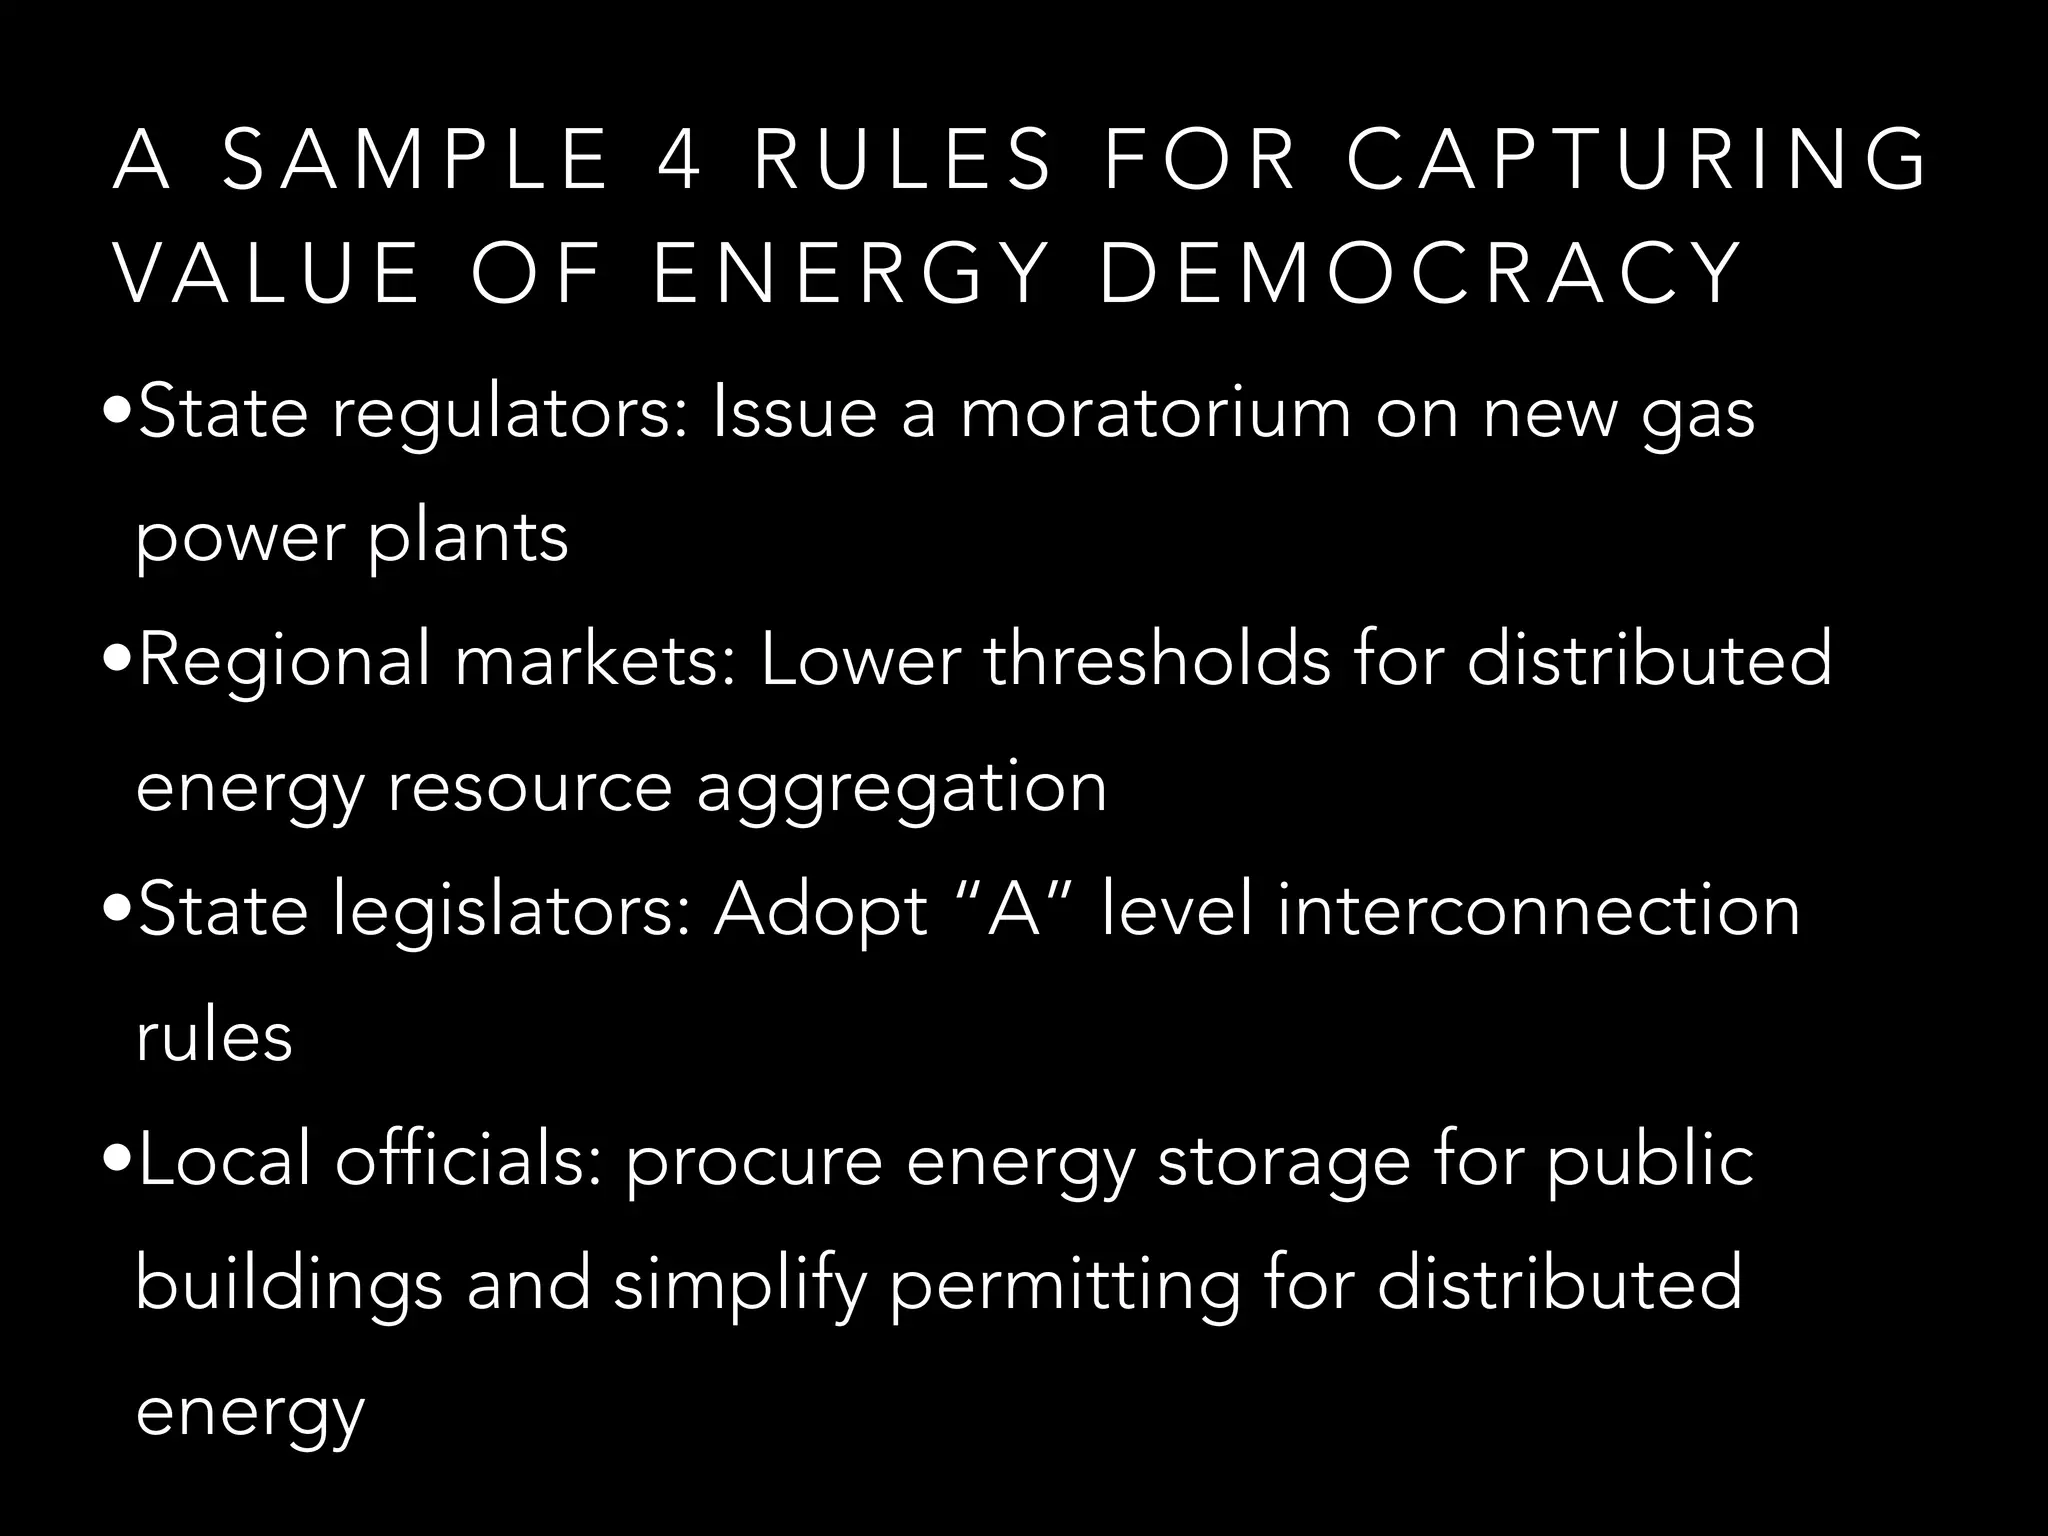
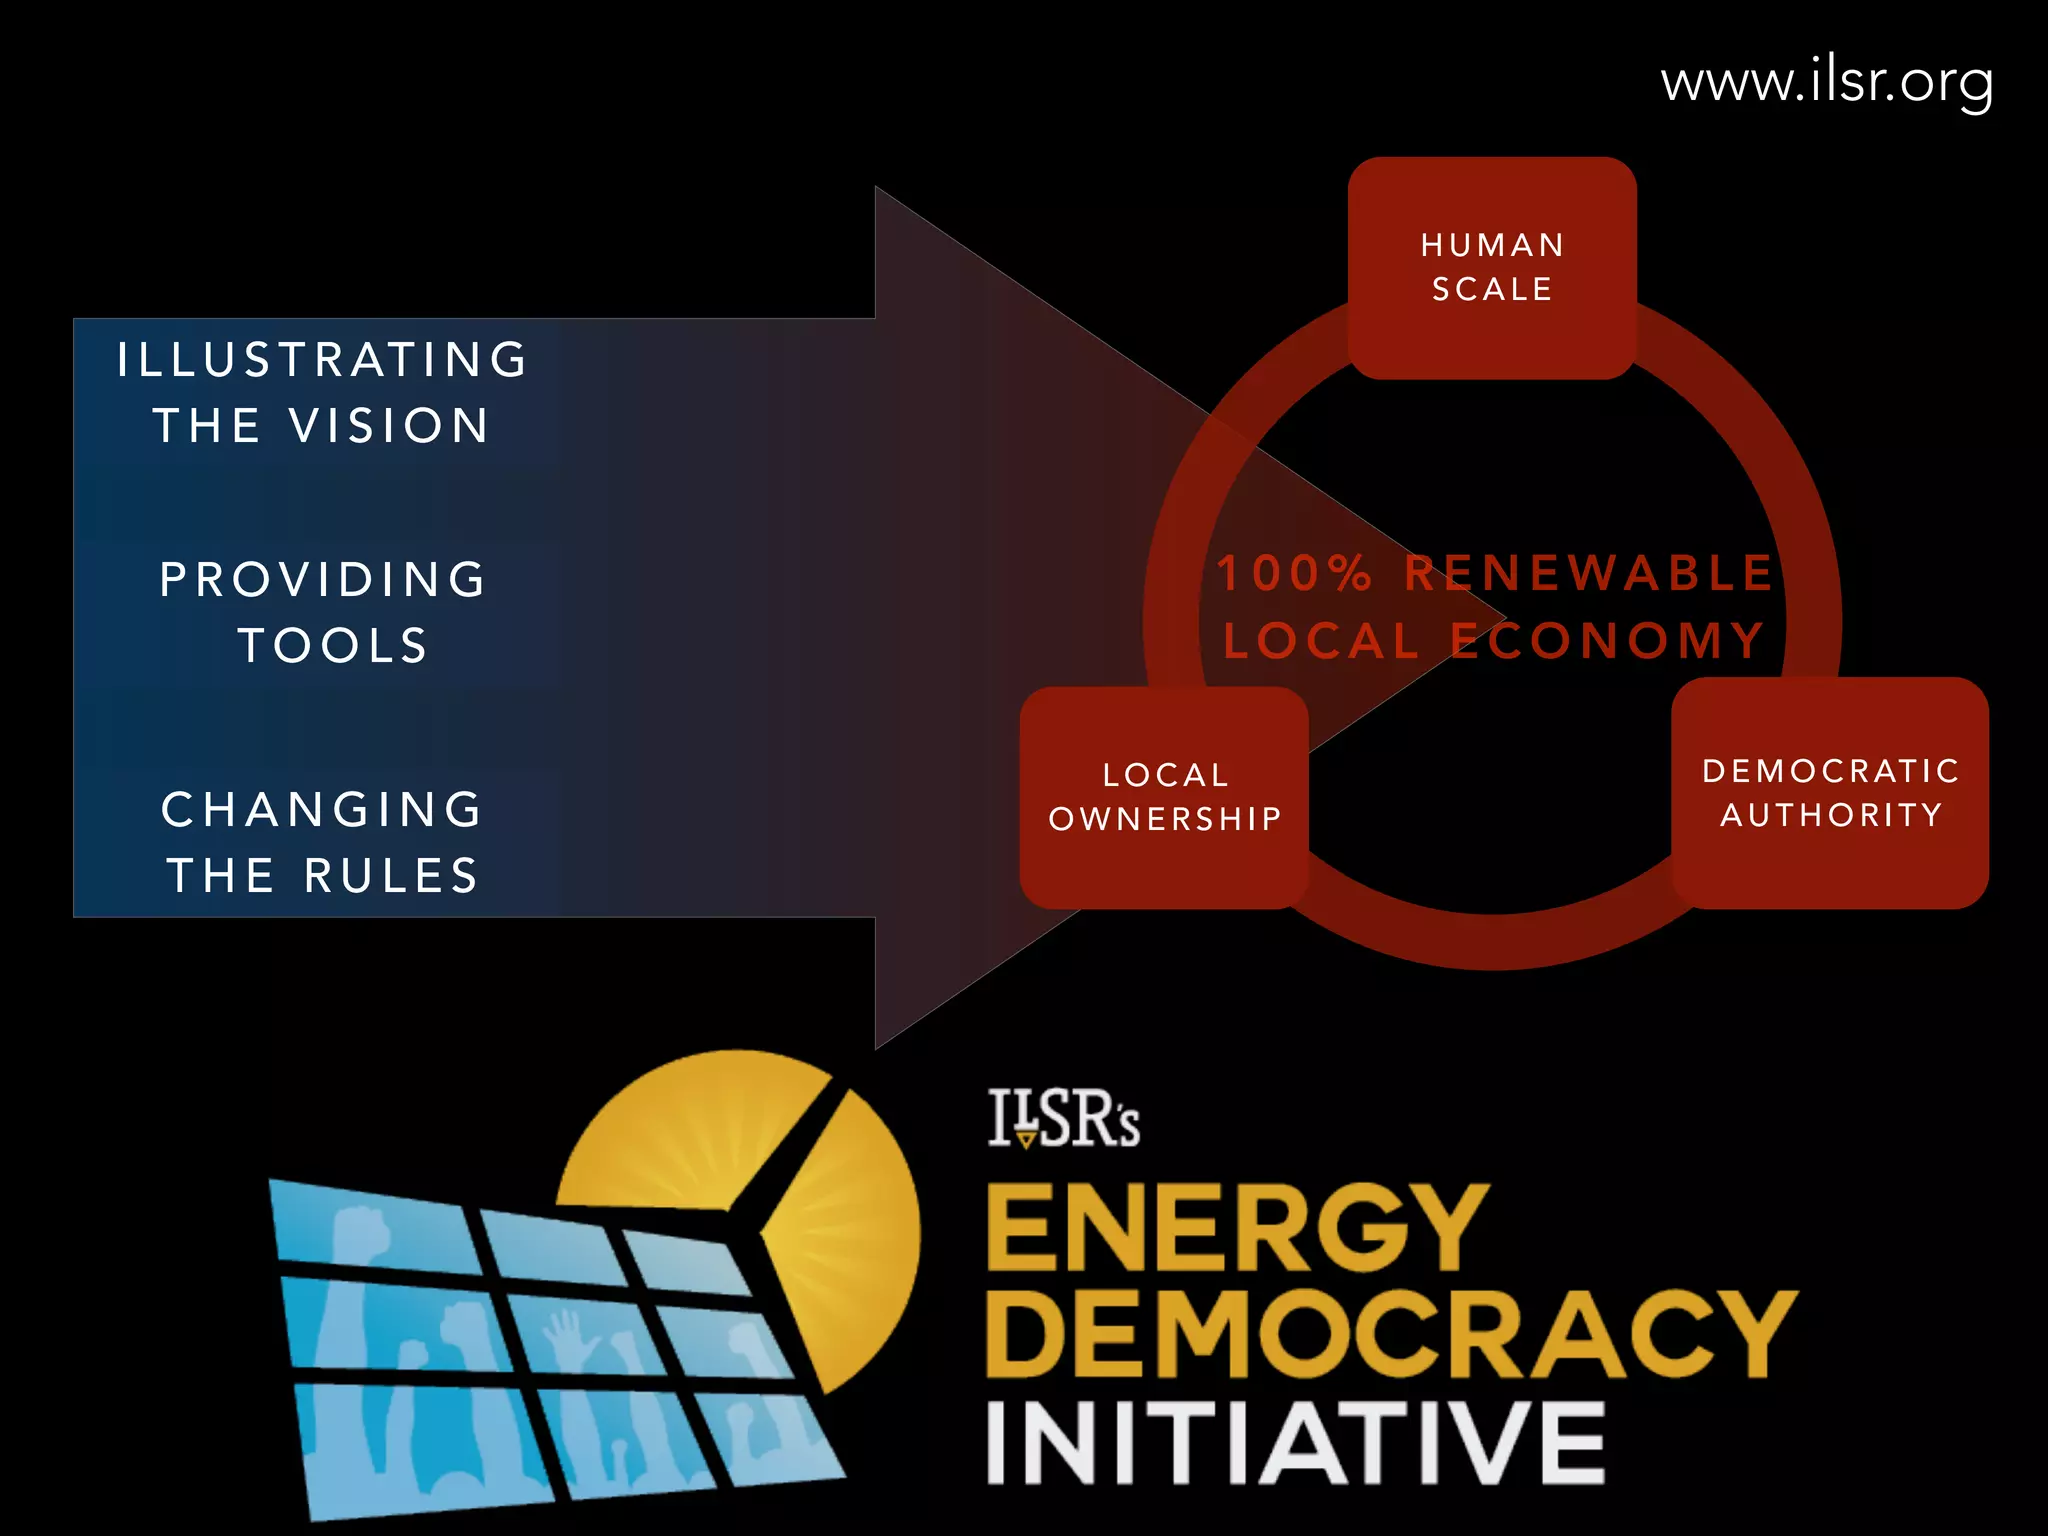
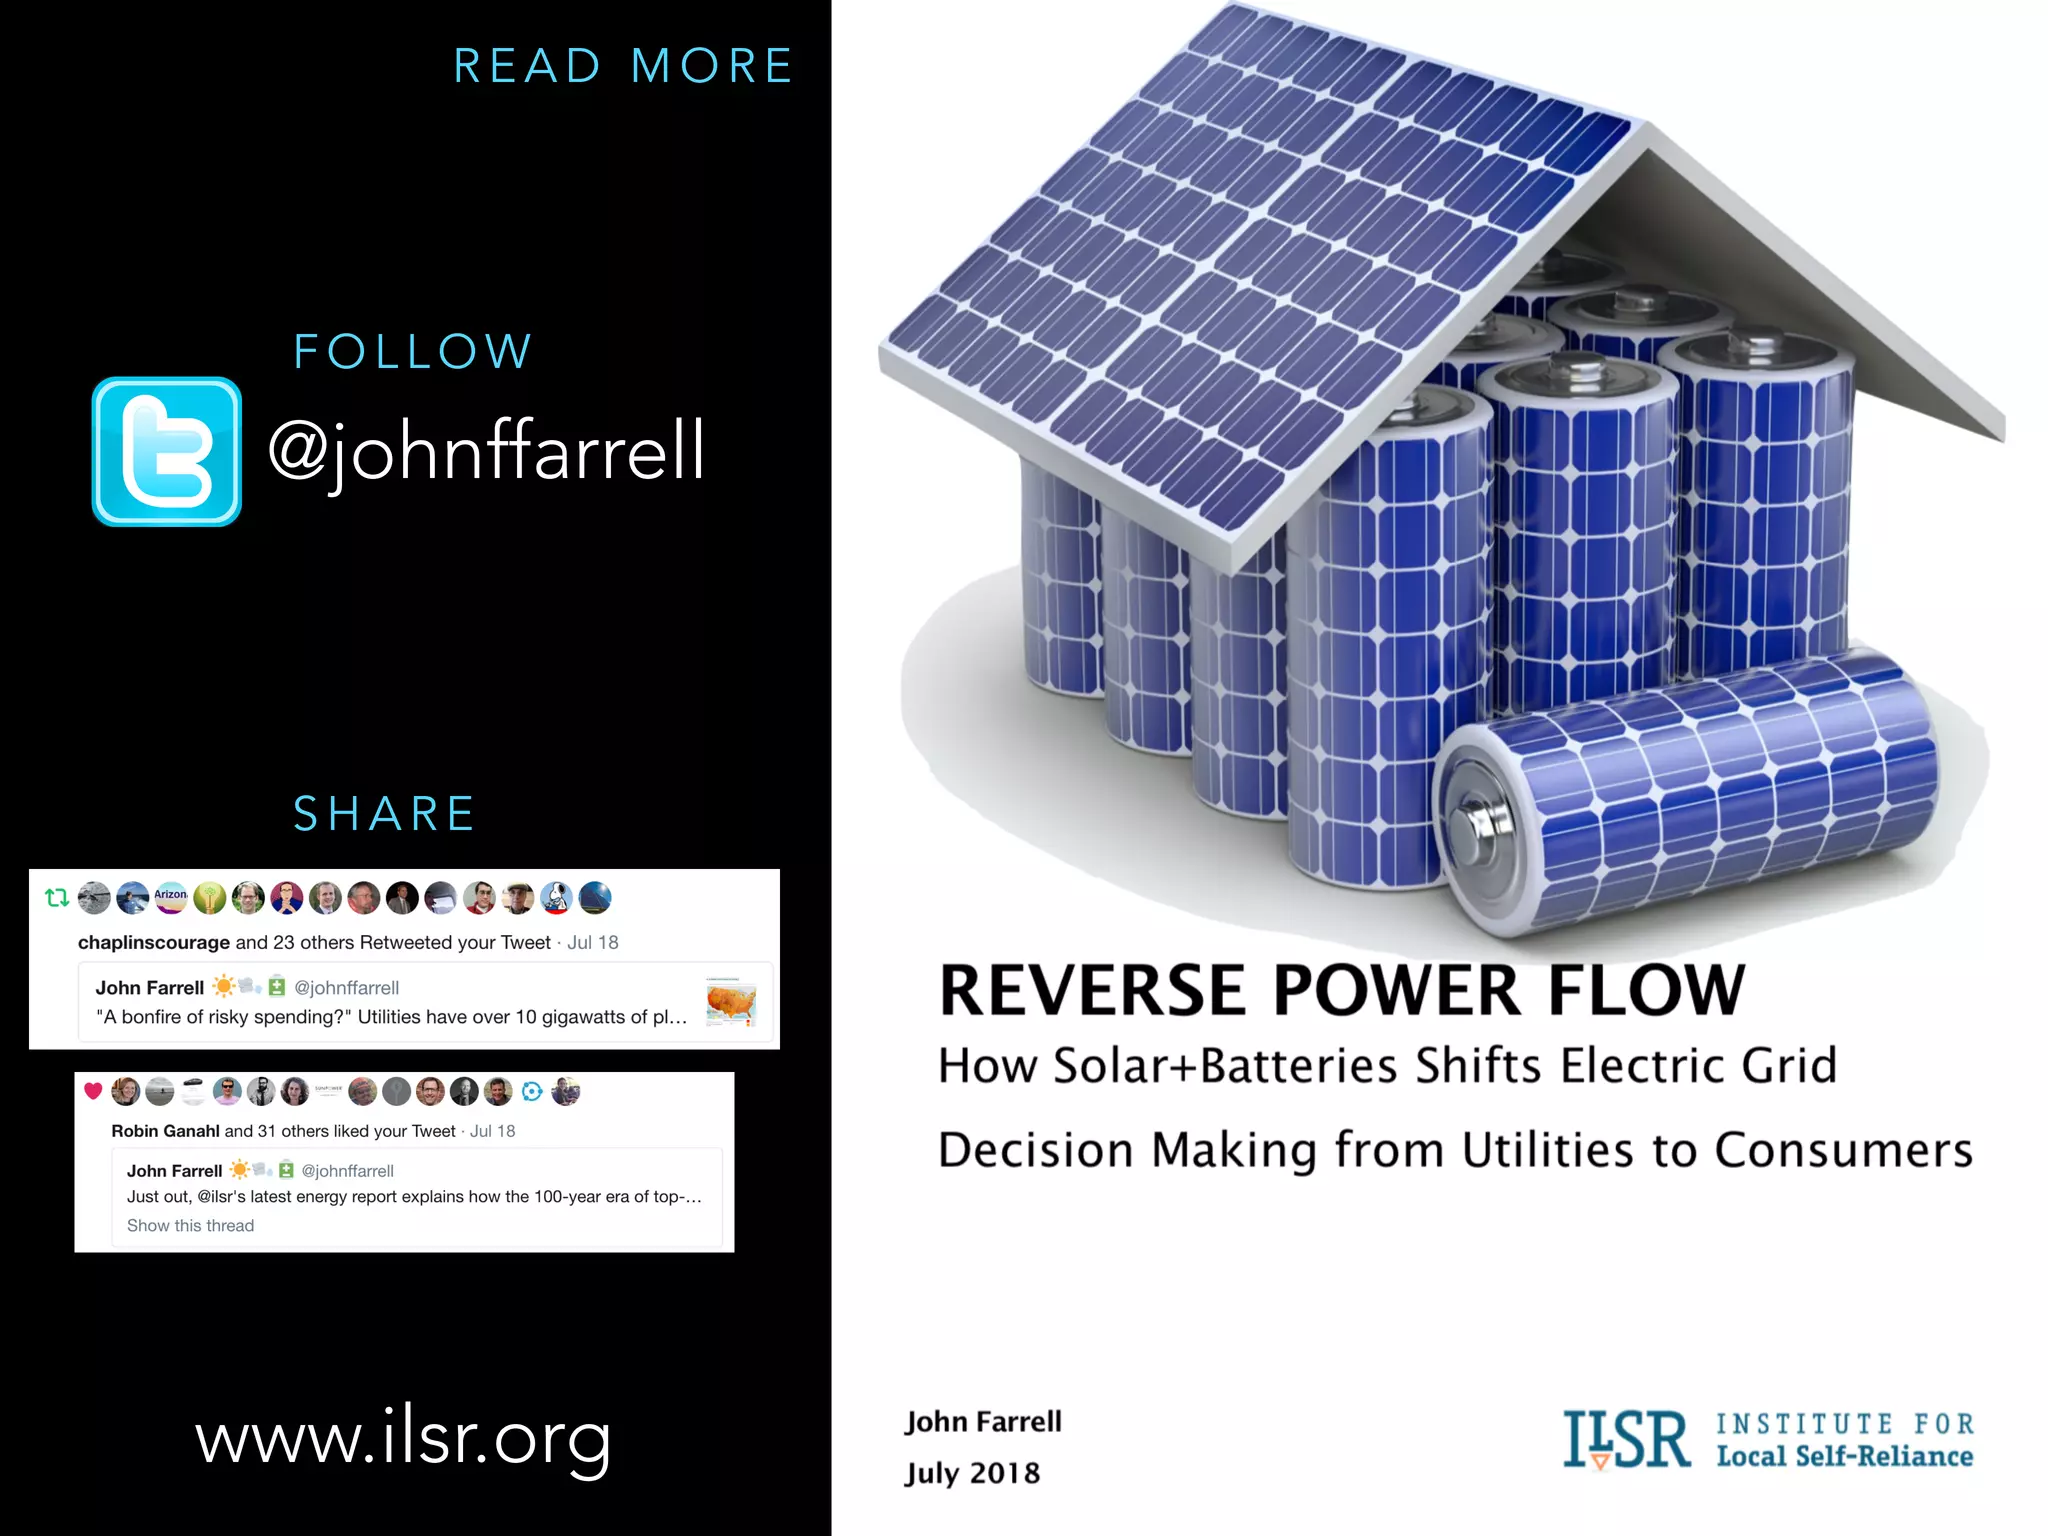
R E V E R S E P O W E R F L O W
H O W S O L A R + B AT T E R I E S S H I F T E L E C T R I C G R I D D E C I S I O N
M A K I N G F R O M U T I L I T I E S T O C O N S U M E R S
John Farrell
July 18, 2018
Credit: (solar house) energymatters.com.au (CC 2.0); (sign) modified from Flickr user InertiaCreeps
P O L L : W H E N WA S N E T
M E T E R I N G F I R S T U S E D ?
A) 1968
B) 1972
C) 1979
D)1985
E) 1993
1 9 7 9
Steven Strong
S U R P R I S E !
Utilities are just as prepared today
S T O R A G E I S H E R E
SURGE IN RESIDENTIAL ENERGY STORAGE
Source: U.S. Energy Storage Monitor, Q2 2018
ResidentialEnergyStorages
Deployments(MWh)
0
5
10
15
20
25
30
35
40
Q1 2013 Q1 2014 Q1 2015 Q1 2016 Q1 2017 Q1 2018
WHERE SOLAR+STORAGE WORKS NOW
90%
52%
80%
14%
71%
16%
49%
25%
27%
23%
Percent of residential customers with solar+storage cheaper than the average utility revenue per kilowatt-hour
10-25% 25-50%
50-75% 75% or
more
CT 77%
70%
MA 51%
MD 45%
NH 70%
ME 17%
NJ 57%
RI 80%
VT 73%
Percent of residential electricity customers
Solar+storage at 14.6¢ in St. Louis
DC 0%
DE 0%
2016 prices
B R O A D O P P O R T U N I T Y T O AV O I D
D E M A N D C H A R G E S
R A P I D LY FA L L I N G B AT T E RY C O S T S
$ per megawatt-hour
$0 $175 $350 $525 $700
Source: Lazard Levelized Cost of Storage Analysis (2015, 2016, 2017)
Lithium-ion Battery
for Peaker
Replacement
2015
2016
2017
B AT T E RY P R I C E F O R E C A S T S
Source: Bloomberg New Energy Finance
P O L L : A R E B AT T E R I E S G E T T I N G
C H E A P E R T H A N F O R E C A S T ?
A)Yes
B) No
Actual
P R I C E D E C L I N E S O U T S T R I P P R O J E C T I O N S
WHERE SOLAR+STORAGE WORKS SOON
0%
0%
90%
71%
85%
58%
46%
54%
3%
40%
55%
84%
69%
75%
75%
49%
36%
71% 20%
8%
10% 28%
34%
60%
24%
3%
11%
32% 66%
52%
55%
2%
16%
3%
0%
41%
2%
40%
63%
Percent of residential customers with solar+storage cheaper than the average utility revenue per kilowatt-hour
25-50%
50-75% 75% or
more10-25%
Percent of residential electricity customers
CT 78%
MA 56%
MD 71%
NH 71%
ME 73%
NJ 79%
RI 81%
VT 81%
70%
Solar+storage at 11.7¢ in St. Louis
DE 3%
DC 0%
45%
2022 prices
A N I N A D V E R T E N T
T R I P L E T H R E AT
A N
I N A D V E R T E N T
T R I P L E T H R E AT
F R O M
D I S T R I B U T E D
S O L A R + S T O R A G E
More valuable
FasterIndependent
1
G E N E R AT I O N T R A N S M I S S I O N D I S T R I B U T I O N
3¢ 3¢ 4¢
Approximate cost of energy if ultimate
customer pays 10¢ per kilowatt-hour
+ +
Energy has more value the closer it is produced to home
1 I N S TA L L E V E RY
6 0 S E C O N D S
2
P O L L : H O W M A N Y N E T M E T E R E D
S O L A R A R R AY S I N C A L I F. ?
A) 25,000
B) 250,000
C) 450,000
D) 830,000
E)1,200,000
3
800,000
customer-
planned
power plants
A N I N A D V E R T E N T
T R I P L E T H R E AT
I M P L I C AT I O N S
D I A B L O C A N Y O N
Credit: ”Mike” Michael L. Baird
Closing due to stagnant sales, competitive renewables
AFFORDABLE REPLACEMENT POWER
The per-kilowatt-hour cost for supplying the equivalent of 100% or
more of retail sales from wind and sun alone
Sources: wind and solar (ILSR, Level10, Berkeley
Labs); Nuclear plant economics (Bloomberg—
https://bloom.bg/2IpvJtv)
2 0 1 7 - 1 8 P R I C E S
Nuclear power plant with marginal economics
1 to 2¢ per kWh
2 to 3¢ per kWh
3 to 4¢ per kWh
4 to 5¢ per kWh
COST OF 100% WIND AND SOLAR
More than a 10% price premium
P U E N T E G A S
P L A N T
R E G U L AT O R S VA S T LY O V E R S TAT E C O S T
O F L O C A L A LT E R N AT I V E S
S O L A R U N D E R C U T S P E A K I N G G A S
P L A N T S
Solar PV — Rooftop C&I
Solar PV — Crystalline Utility-Scale
Gas Peaking
$ per megawatt-hour
0 75 150 225 300
Source: Lazard LCOE, November 2015
$109 $193
$58 $70
$165 $218
Inexpensive solar +
$0
$50
$100
$150
$200
$250
2016 2017 2018 2019 2020
Source: Kittner, et al. Energy storage deployment and innovation for the clean energy transition
F O R E C A S T E D B AT T E RY PA C K P R I C E S
W I T H T W O - FA C T O R L E A R N I N G M O D E L
$ per kilowatt-hour of capacity
Inexpensive solar + inexpensive batteries =
PLANNED GAS PEAKERS IN TROUBLE
395
939
2700
34
80
260 300
40
90
6031
171
250
93
9
Nearly 10 gigawatts of planned gas peaking power plants are in states with competitive solar + storage
CT9 0
MA5 2 5
190
NJ4 3 4
CT9 0
Megawatts of planned gas peakers
300
277
PV insolation:
http://bit.ly/2pwou7C (NREL, 2012)
Power plants: http://bit.ly/2DZDm2N
(EIA, 2018)
Places where regulators have
halted gas peaker deployment
States with a similar solar
resource
ILSR modeled a
peaking plant
alternative to
shaving entire 1-
hour super peak
window: 271 MW
and ~271 MWh
P E A K I N G P O W E R P L A N T A LT E R N AT I V E
0
50
100
150
200
250
300
4pm 5pm 6pm 7pm 8pm
P E A K I N G P O W E R P L A N T A LT E R N AT I V E
Megawatts
Using demand response, solar, and storage in place of a peaking plant
11 MW Demand response
292 MW Solar
230 MW Batteries
271 MW peak demand
L O C A L A LT E R N AT I V E G O O D F O R
L O C A L E C O N O M Y
R E V E R S I N G T H E P O W E R
F L O W
B O N F I R E O F R I S K Y
S P E N D I N G ?
B O N F I R E O F R I S K Y S P E N D I N G ?
0 gigawatts
15 gigawatts
30 gigawatts
45 gigawatts
60 gigawatts
Planned
retirements of
nuclear, gas, and
coal
Planned gas
power plant
capacity additions
Source: Energy Information Administration
In the next 4 years…
S O L A R + S T O R A G E P R E S E N T S S T I F F
C O M P E T I T I O N F O R G A S
$0 $20 $40 $60 $80
$ per megawatt-hour
Sources: Lazard LCOE, November 2017; Utility Dive
Gas combined cycle
price range
Solar+storage bids
to Xcel Colorado
RECENT GAS PEAKERS IN TROUBLE
3262
5
18
40
520
47
129
37
35
87
24
42 79
2
2055
235
20
60
6 147
5
9
Over 5 gigawatts of recently built gas peaking power plants are in states with competitive solar + storage
Places where regulators have
halted gas peaker deployment
States with a similar solar
resource
CT9 0
MA1 5
564
NJ6 3
CT9 0
Megawatts of recently built gas peakers
16
148
Power plants: http://bit.ly/2DZDm2N
(EIA, 2013-18)
PV insolation:
http://bit.ly/2pwou7C (NREL, 2012)
143
1644
MD1 2 9
U T I L I T I E S R E S P O N D
I N C O N S I S T E N T LY
DC
AK HI
Source: The 50 States of Solar: Q1 2016, NC Clean Energy Technology
- Q1 2016 action
- No recent action
D I S T R I B U T E D G E N E R AT I O N
U N D E R F I R E
1 Lobbying against distributed generation
Blue Wing Solar Project, San Antonio; Credit: Duke Energy
2 Building utility-scale renewables
T O T H E O W N E R , T H E S P O I L S
$0
$5,000
$10,000
$15,000
$20,000
Tucson Electric Power customer AZ Public Service customer
$19,400
$14,900
$5,600
$6,800
Utility-owned Customer-owned
25-year net benefit to the customer of utility-owned v. customer-owned solar
$13,800
utility
benefit
$8,100
utility
benefit
3 Building utility-owned distributed generation
N E E D E D R U L E S
C A P T U R E T H E S E VA L U E S T R E A M S
A S A M P L E 4 R U L E S F O R C A P T U R I N G
VA L U E O F E N E R G Y D E M O C R A C Y
•State regulators: Issue a moratorium on new gas
power plants
•Regional markets: Lower thresholds for distributed
energy resource aggregation
•State legislators: Adopt “A” level interconnection
rules
•Local officials: procure energy storage for public
buildings and simplify permitting for distributed
energy
www.ilsr.org
C H A N G I N G
T H E R U L E S
P R O V I D I N G
T O O L S
1 0 0 % R E N E WA B L E
L O C A L E C O N O M Y
H U M A N
S C A L E
L O C A L
O W N E R S H I P
D E M O C R AT I C
A U T H O R I T Y
I L L U S T R AT I N G
T H E V I S I O N
www.ilsr.org
R E A D M O R E
@johnffarrell
F O L L O W
S H A R E

Reverse Power Flow: How solar+batteries shift electric grid decision making from utilities to customers

  • 1.
    R E VE R S E P O W E R F L O W H O W S O L A R + B AT T E R I E S S H I F T E L E C T R I C G R I D D E C I S I O N M A K I N G F R O M U T I L I T I E S T O C O N S U M E R S John Farrell July 18, 2018 Credit: (solar house) energymatters.com.au (CC 2.0); (sign) modified from Flickr user InertiaCreeps
  • 2.
    P O LL : W H E N WA S N E T M E T E R I N G F I R S T U S E D ? A) 1968 B) 1972 C) 1979 D)1985 E) 1993
  • 3.
    1 9 79 Steven Strong
  • 4.
    S U RP R I S E ! Utilities are just as prepared today
  • 5.
    S T OR A G E I S H E R E
  • 6.
    SURGE IN RESIDENTIALENERGY STORAGE Source: U.S. Energy Storage Monitor, Q2 2018 ResidentialEnergyStorages Deployments(MWh) 0 5 10 15 20 25 30 35 40 Q1 2013 Q1 2014 Q1 2015 Q1 2016 Q1 2017 Q1 2018
  • 7.
    WHERE SOLAR+STORAGE WORKSNOW 90% 52% 80% 14% 71% 16% 49% 25% 27% 23% Percent of residential customers with solar+storage cheaper than the average utility revenue per kilowatt-hour 10-25% 25-50% 50-75% 75% or more CT 77% 70% MA 51% MD 45% NH 70% ME 17% NJ 57% RI 80% VT 73% Percent of residential electricity customers Solar+storage at 14.6¢ in St. Louis DC 0% DE 0% 2016 prices
  • 8.
    B R OA D O P P O R T U N I T Y T O AV O I D D E M A N D C H A R G E S
  • 9.
    R A PI D LY FA L L I N G B AT T E RY C O S T S $ per megawatt-hour $0 $175 $350 $525 $700 Source: Lazard Levelized Cost of Storage Analysis (2015, 2016, 2017) Lithium-ion Battery for Peaker Replacement 2015 2016 2017
  • 10.
    B AT TE RY P R I C E F O R E C A S T S Source: Bloomberg New Energy Finance
  • 11.
    P O LL : A R E B AT T E R I E S G E T T I N G C H E A P E R T H A N F O R E C A S T ? A)Yes B) No
  • 12.
    Actual P R IC E D E C L I N E S O U T S T R I P P R O J E C T I O N S
  • 13.
    WHERE SOLAR+STORAGE WORKSSOON 0% 0% 90% 71% 85% 58% 46% 54% 3% 40% 55% 84% 69% 75% 75% 49% 36% 71% 20% 8% 10% 28% 34% 60% 24% 3% 11% 32% 66% 52% 55% 2% 16% 3% 0% 41% 2% 40% 63% Percent of residential customers with solar+storage cheaper than the average utility revenue per kilowatt-hour 25-50% 50-75% 75% or more10-25% Percent of residential electricity customers CT 78% MA 56% MD 71% NH 71% ME 73% NJ 79% RI 81% VT 81% 70% Solar+storage at 11.7¢ in St. Louis DE 3% DC 0% 45% 2022 prices
  • 14.
    A N IN A D V E R T E N T T R I P L E T H R E AT
  • 15.
    A N I NA D V E R T E N T T R I P L E T H R E AT F R O M D I S T R I B U T E D S O L A R + S T O R A G E More valuable FasterIndependent
  • 16.
    1 G E NE R AT I O N T R A N S M I S S I O N D I S T R I B U T I O N 3¢ 3¢ 4¢ Approximate cost of energy if ultimate customer pays 10¢ per kilowatt-hour + + Energy has more value the closer it is produced to home
  • 17.
    1 I NS TA L L E V E RY 6 0 S E C O N D S 2
  • 18.
    P O LL : H O W M A N Y N E T M E T E R E D S O L A R A R R AY S I N C A L I F. ? A) 25,000 B) 250,000 C) 450,000 D) 830,000 E)1,200,000
  • 19.
  • 20.
    A N IN A D V E R T E N T T R I P L E T H R E AT I M P L I C AT I O N S
  • 21.
    D I AB L O C A N Y O N Credit: ”Mike” Michael L. Baird Closing due to stagnant sales, competitive renewables
  • 22.
    AFFORDABLE REPLACEMENT POWER Theper-kilowatt-hour cost for supplying the equivalent of 100% or more of retail sales from wind and sun alone Sources: wind and solar (ILSR, Level10, Berkeley Labs); Nuclear plant economics (Bloomberg— https://bloom.bg/2IpvJtv) 2 0 1 7 - 1 8 P R I C E S Nuclear power plant with marginal economics 1 to 2¢ per kWh 2 to 3¢ per kWh 3 to 4¢ per kWh 4 to 5¢ per kWh COST OF 100% WIND AND SOLAR More than a 10% price premium
  • 23.
    P U EN T E G A S P L A N T
  • 24.
    R E GU L AT O R S VA S T LY O V E R S TAT E C O S T O F L O C A L A LT E R N AT I V E S
  • 25.
    S O LA R U N D E R C U T S P E A K I N G G A S P L A N T S Solar PV — Rooftop C&I Solar PV — Crystalline Utility-Scale Gas Peaking $ per megawatt-hour 0 75 150 225 300 Source: Lazard LCOE, November 2015 $109 $193 $58 $70 $165 $218 Inexpensive solar +
  • 26.
    $0 $50 $100 $150 $200 $250 2016 2017 20182019 2020 Source: Kittner, et al. Energy storage deployment and innovation for the clean energy transition F O R E C A S T E D B AT T E RY PA C K P R I C E S W I T H T W O - FA C T O R L E A R N I N G M O D E L $ per kilowatt-hour of capacity Inexpensive solar + inexpensive batteries =
  • 27.
    PLANNED GAS PEAKERSIN TROUBLE 395 939 2700 34 80 260 300 40 90 6031 171 250 93 9 Nearly 10 gigawatts of planned gas peaking power plants are in states with competitive solar + storage CT9 0 MA5 2 5 190 NJ4 3 4 CT9 0 Megawatts of planned gas peakers 300 277 PV insolation: http://bit.ly/2pwou7C (NREL, 2012) Power plants: http://bit.ly/2DZDm2N (EIA, 2018) Places where regulators have halted gas peaker deployment States with a similar solar resource
  • 28.
    ILSR modeled a peakingplant alternative to shaving entire 1- hour super peak window: 271 MW and ~271 MWh P E A K I N G P O W E R P L A N T A LT E R N AT I V E
  • 29.
    0 50 100 150 200 250 300 4pm 5pm 6pm7pm 8pm P E A K I N G P O W E R P L A N T A LT E R N AT I V E Megawatts Using demand response, solar, and storage in place of a peaking plant 11 MW Demand response 292 MW Solar 230 MW Batteries 271 MW peak demand
  • 30.
    L O CA L A LT E R N AT I V E G O O D F O R L O C A L E C O N O M Y
  • 31.
    R E VE R S I N G T H E P O W E R F L O W
  • 33.
    B O NF I R E O F R I S K Y S P E N D I N G ?
  • 35.
    B O NF I R E O F R I S K Y S P E N D I N G ? 0 gigawatts 15 gigawatts 30 gigawatts 45 gigawatts 60 gigawatts Planned retirements of nuclear, gas, and coal Planned gas power plant capacity additions Source: Energy Information Administration In the next 4 years…
  • 36.
    S O LA R + S T O R A G E P R E S E N T S S T I F F C O M P E T I T I O N F O R G A S $0 $20 $40 $60 $80 $ per megawatt-hour Sources: Lazard LCOE, November 2017; Utility Dive Gas combined cycle price range Solar+storage bids to Xcel Colorado
  • 37.
    RECENT GAS PEAKERSIN TROUBLE 3262 5 18 40 520 47 129 37 35 87 24 42 79 2 2055 235 20 60 6 147 5 9 Over 5 gigawatts of recently built gas peaking power plants are in states with competitive solar + storage Places where regulators have halted gas peaker deployment States with a similar solar resource CT9 0 MA1 5 564 NJ6 3 CT9 0 Megawatts of recently built gas peakers 16 148 Power plants: http://bit.ly/2DZDm2N (EIA, 2013-18) PV insolation: http://bit.ly/2pwou7C (NREL, 2012) 143 1644 MD1 2 9
  • 38.
    U T IL I T I E S R E S P O N D I N C O N S I S T E N T LY
  • 39.
    DC AK HI Source: The50 States of Solar: Q1 2016, NC Clean Energy Technology - Q1 2016 action - No recent action D I S T R I B U T E D G E N E R AT I O N U N D E R F I R E 1 Lobbying against distributed generation
  • 40.
    Blue Wing SolarProject, San Antonio; Credit: Duke Energy 2 Building utility-scale renewables
  • 41.
    T O TH E O W N E R , T H E S P O I L S $0 $5,000 $10,000 $15,000 $20,000 Tucson Electric Power customer AZ Public Service customer $19,400 $14,900 $5,600 $6,800 Utility-owned Customer-owned 25-year net benefit to the customer of utility-owned v. customer-owned solar $13,800 utility benefit $8,100 utility benefit 3 Building utility-owned distributed generation
  • 42.
    N E ED E D R U L E S
  • 43.
    C A PT U R E T H E S E VA L U E S T R E A M S
  • 44.
    A S AM P L E 4 R U L E S F O R C A P T U R I N G VA L U E O F E N E R G Y D E M O C R A C Y •State regulators: Issue a moratorium on new gas power plants •Regional markets: Lower thresholds for distributed energy resource aggregation •State legislators: Adopt “A” level interconnection rules •Local officials: procure energy storage for public buildings and simplify permitting for distributed energy
  • 45.
    www.ilsr.org C H AN G I N G T H E R U L E S P R O V I D I N G T O O L S 1 0 0 % R E N E WA B L E L O C A L E C O N O M Y H U M A N S C A L E L O C A L O W N E R S H I P D E M O C R AT I C A U T H O R I T Y I L L U S T R AT I N G T H E V I S I O N
  • 46.
    www.ilsr.org R E AD M O R E @johnffarrell F O L L O W S H A R E