Download to read offline


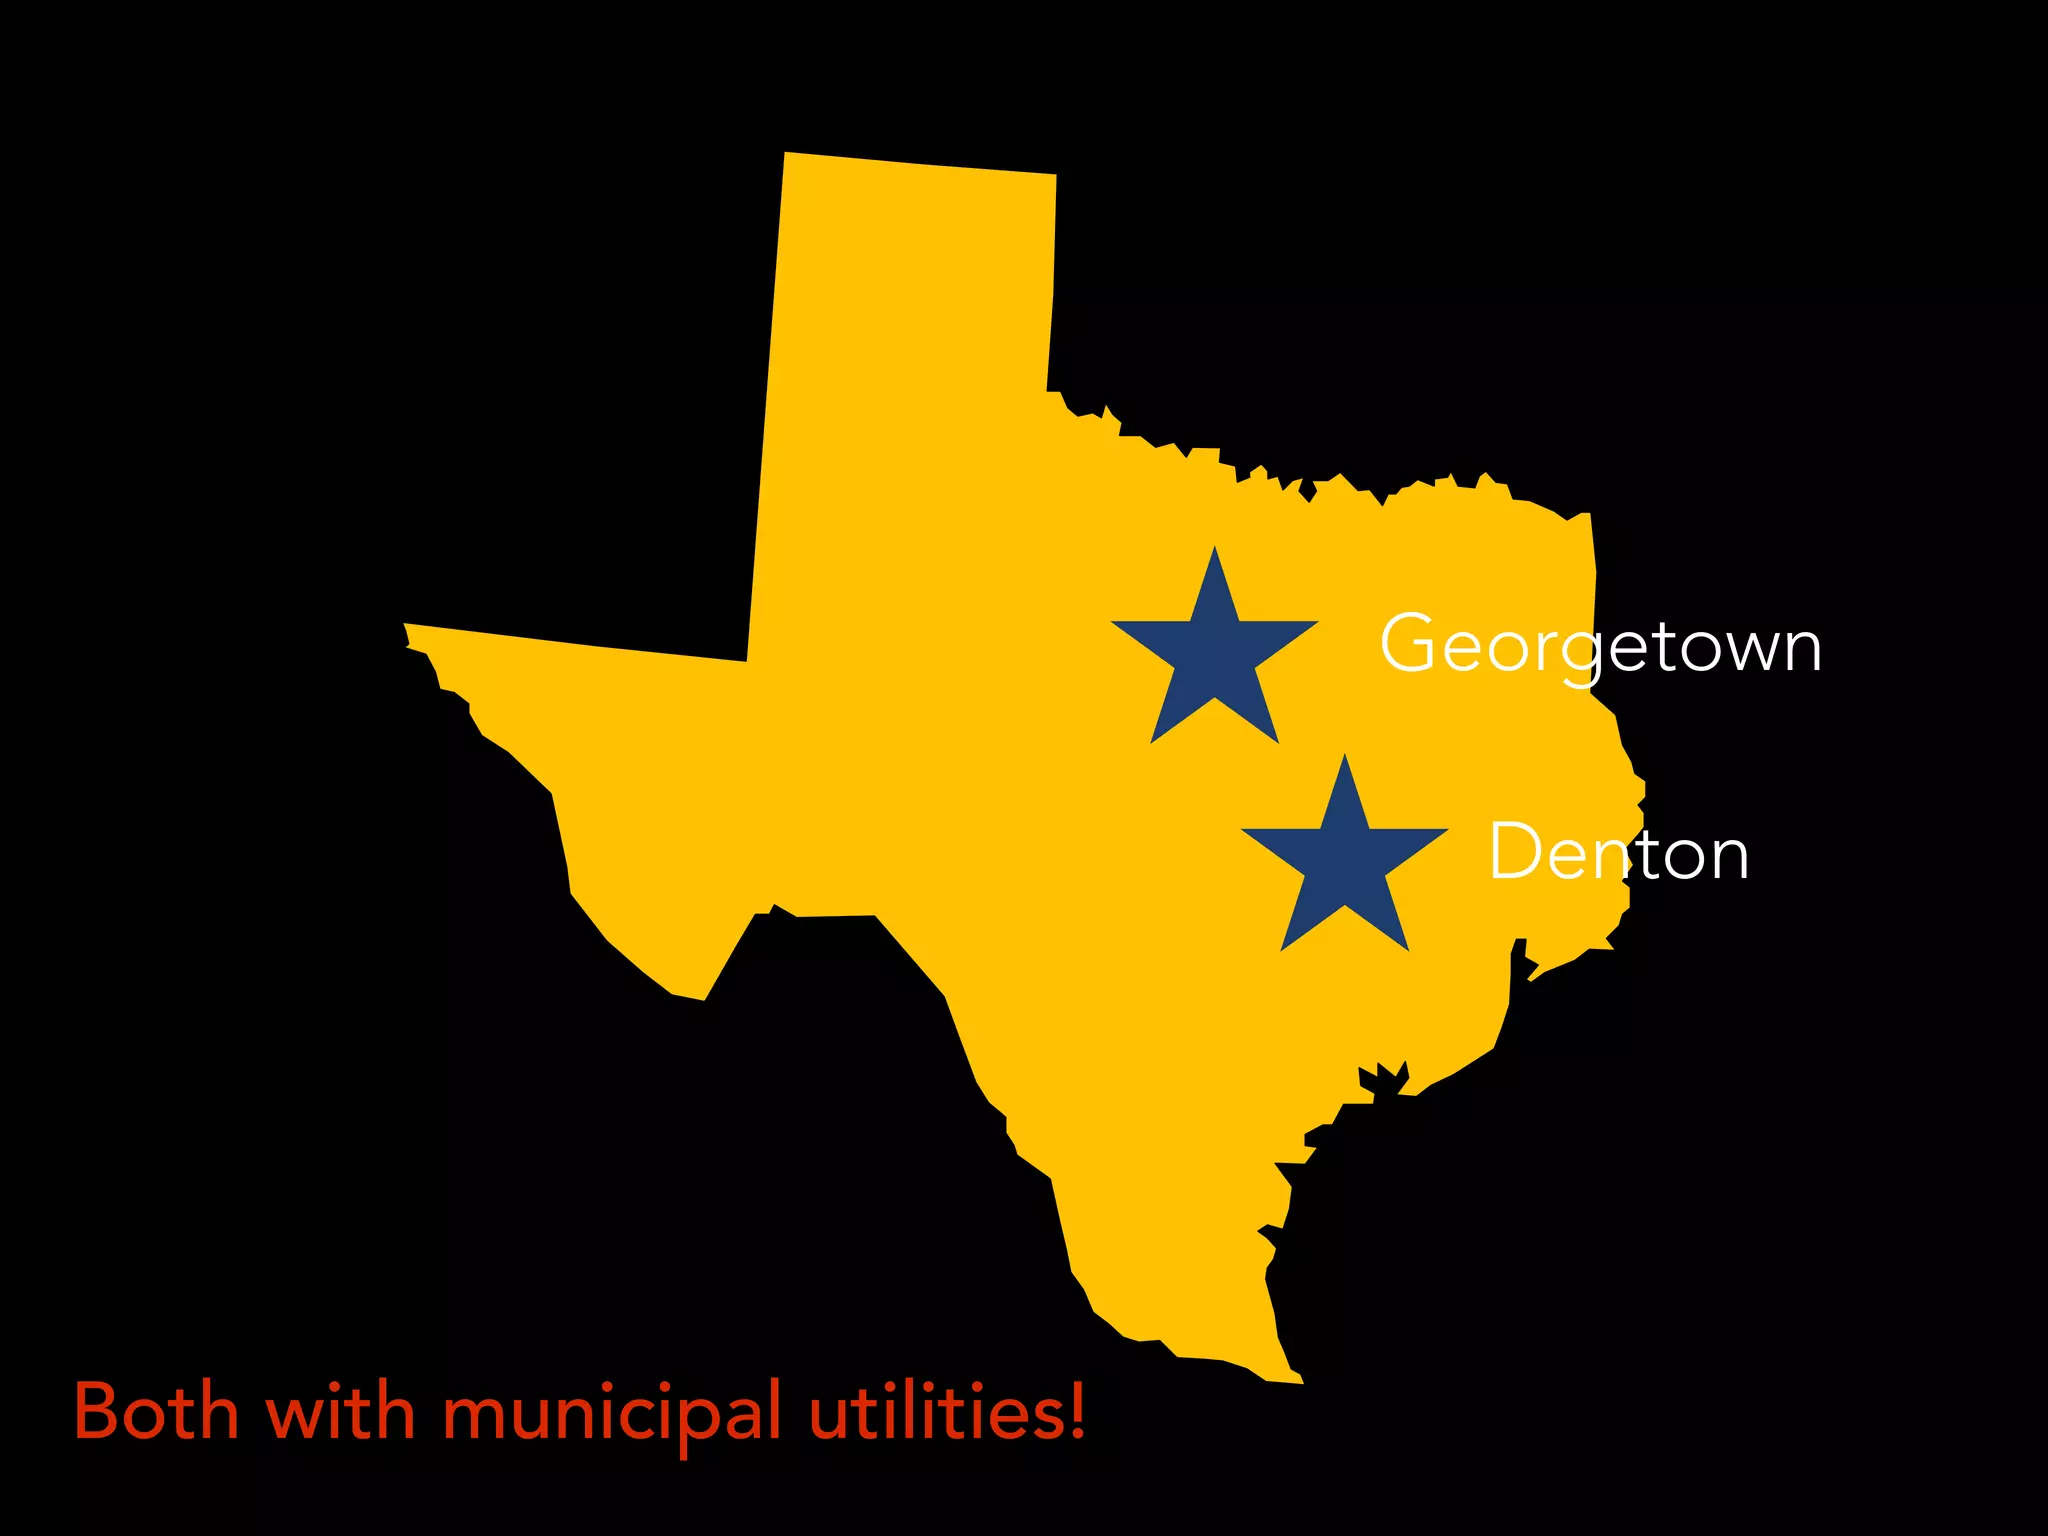


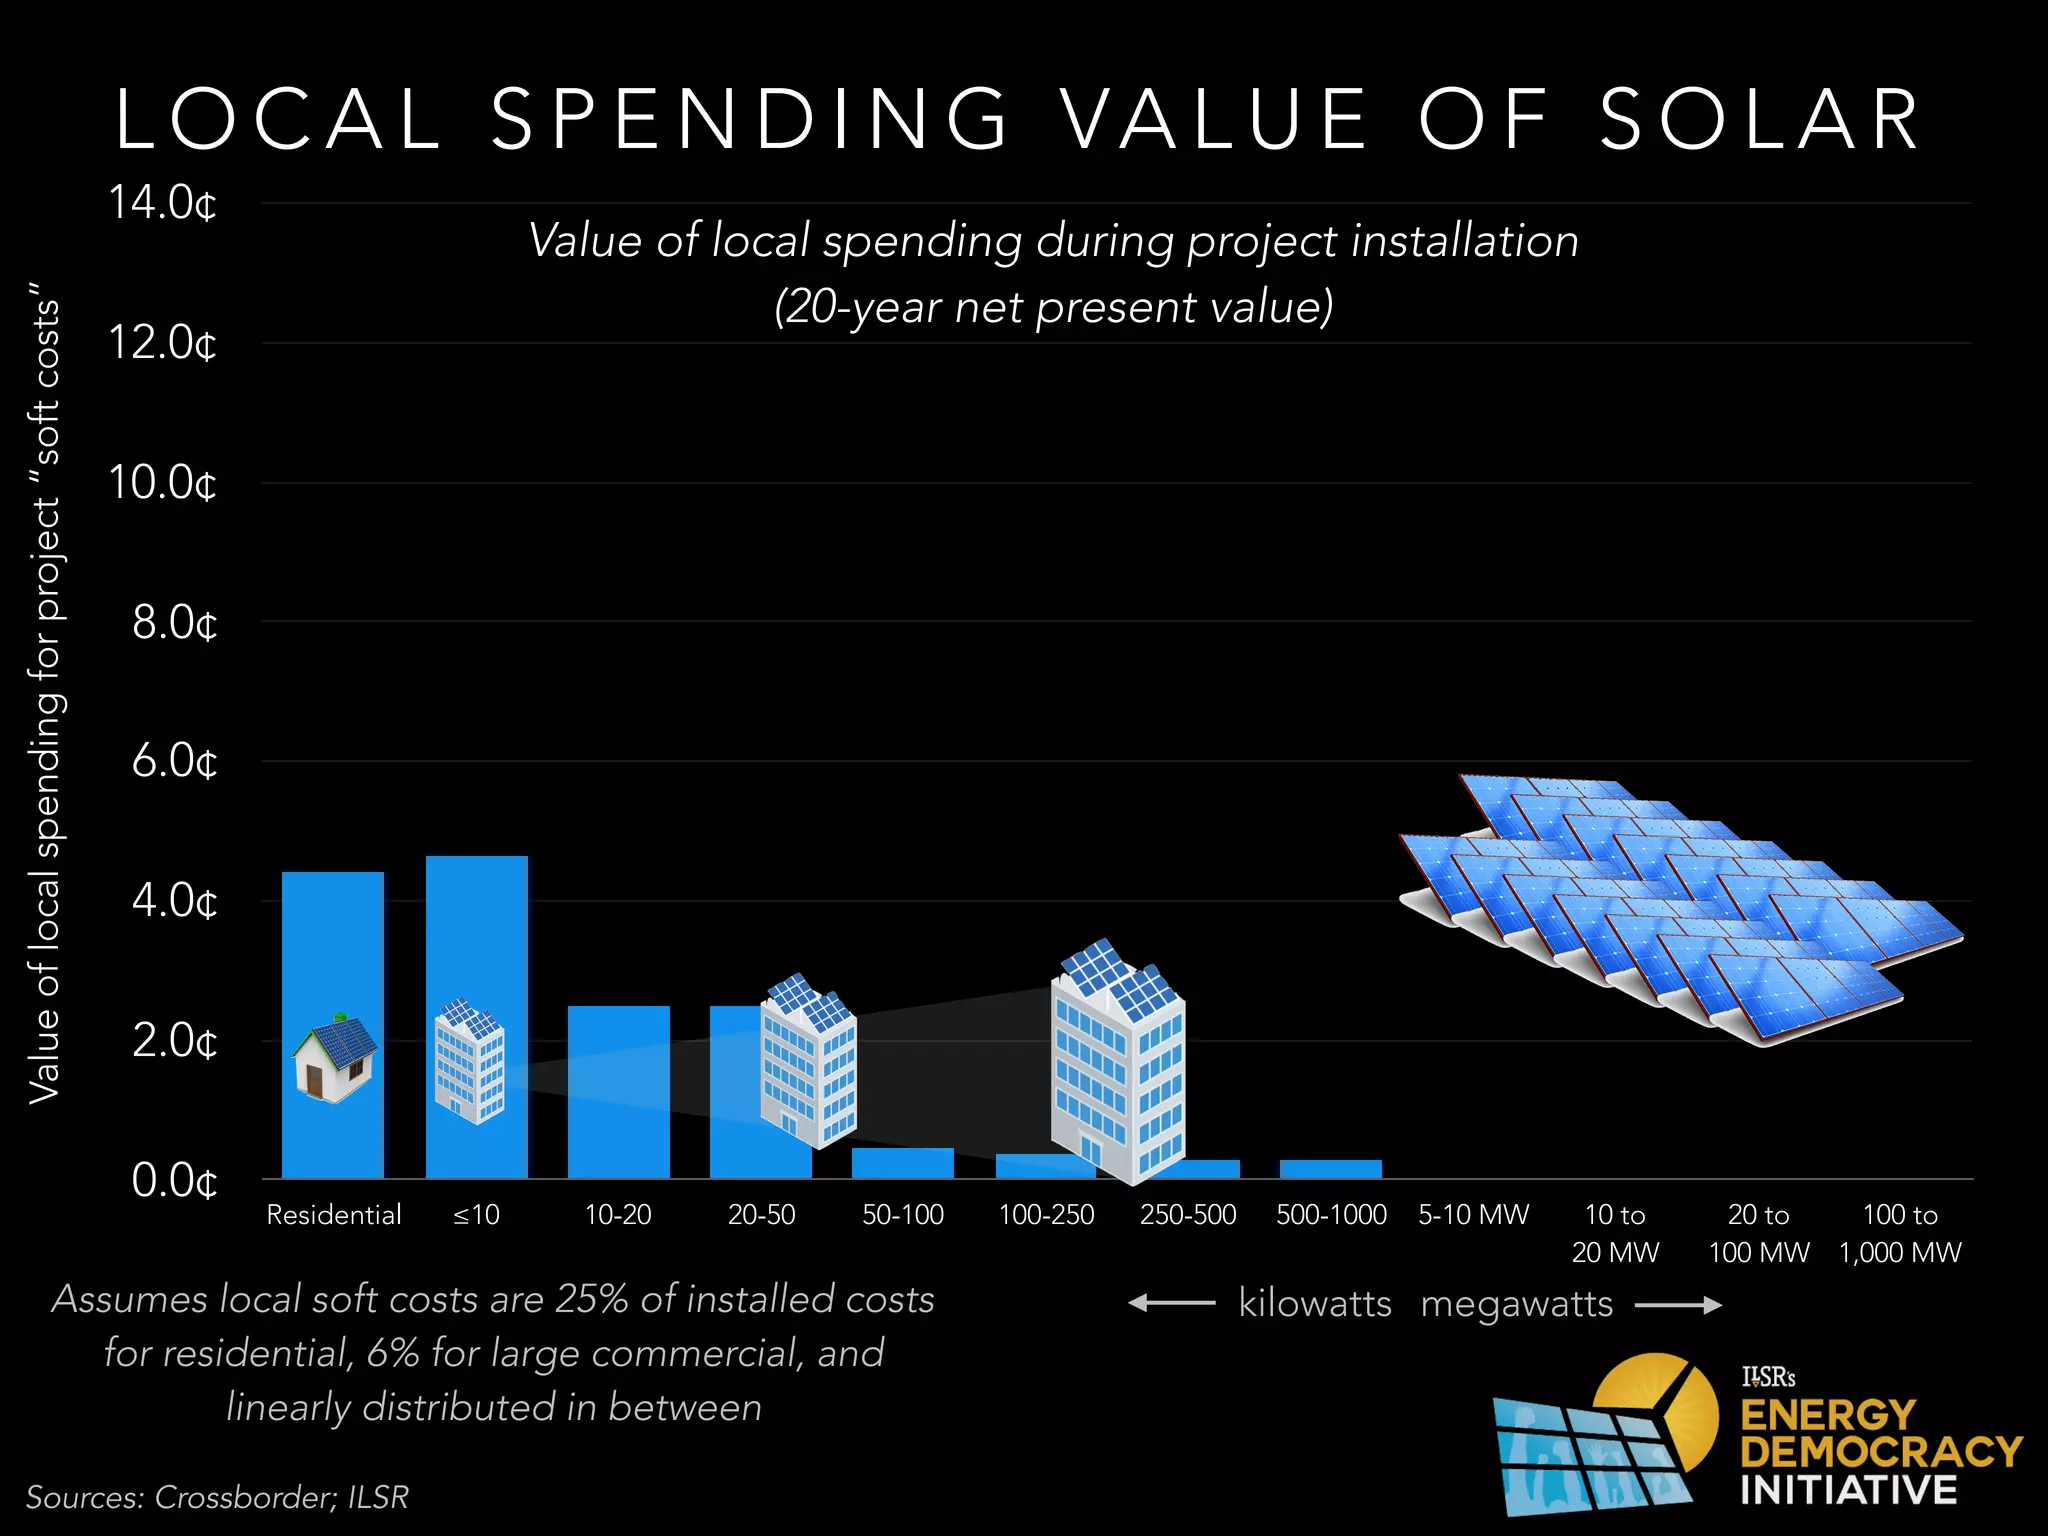


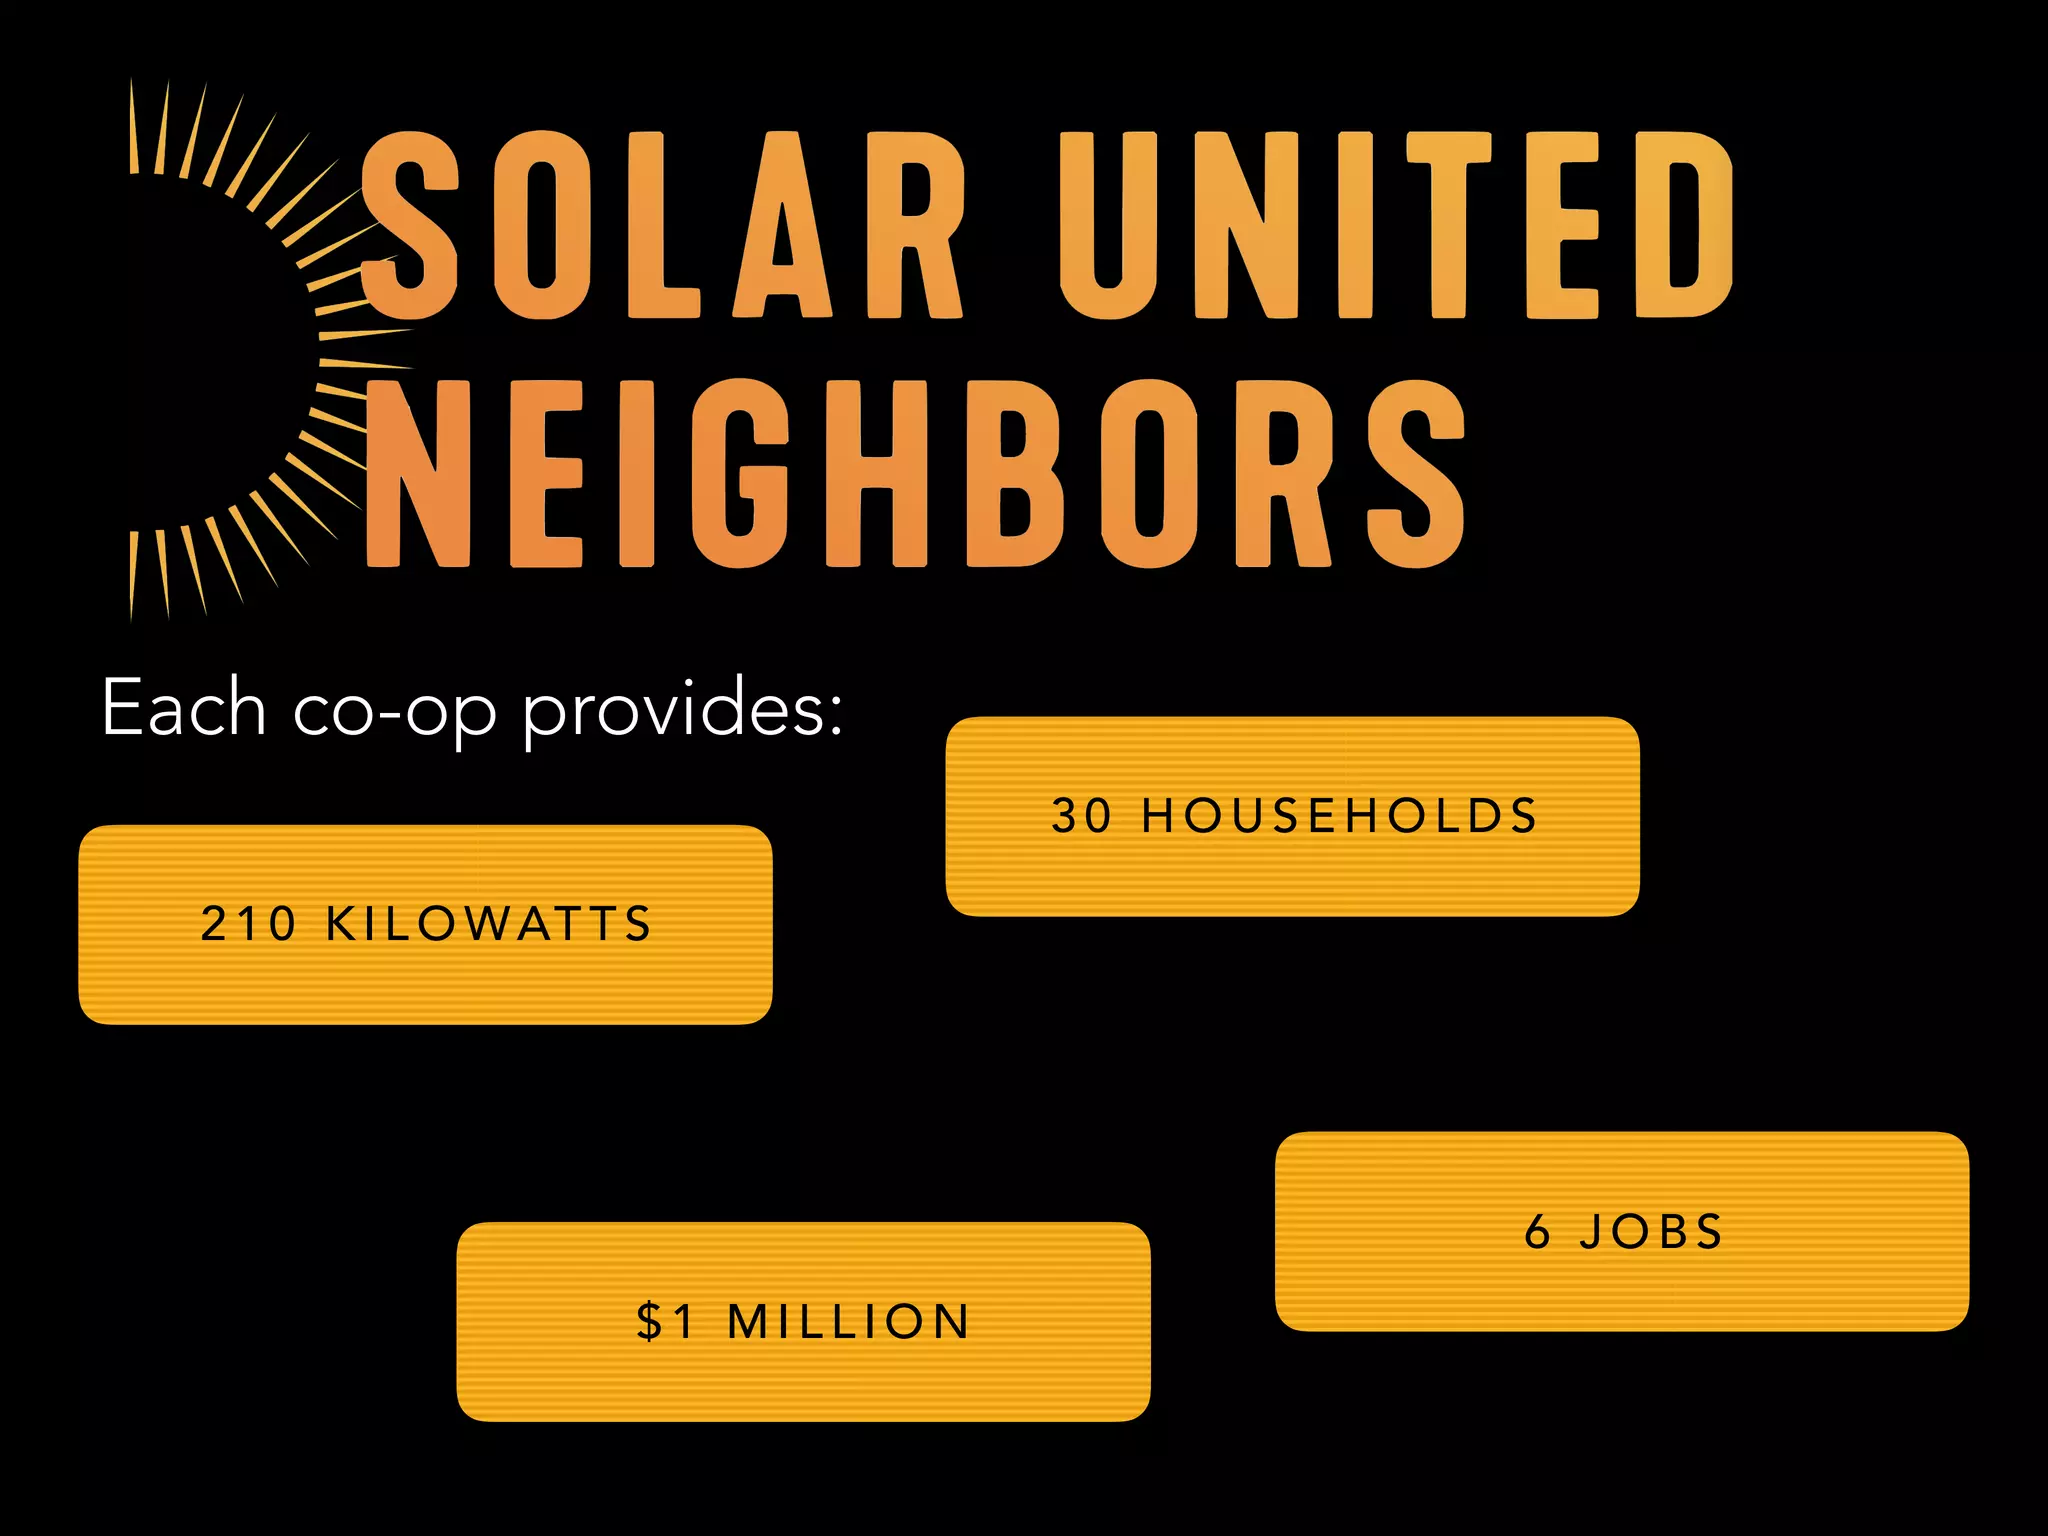


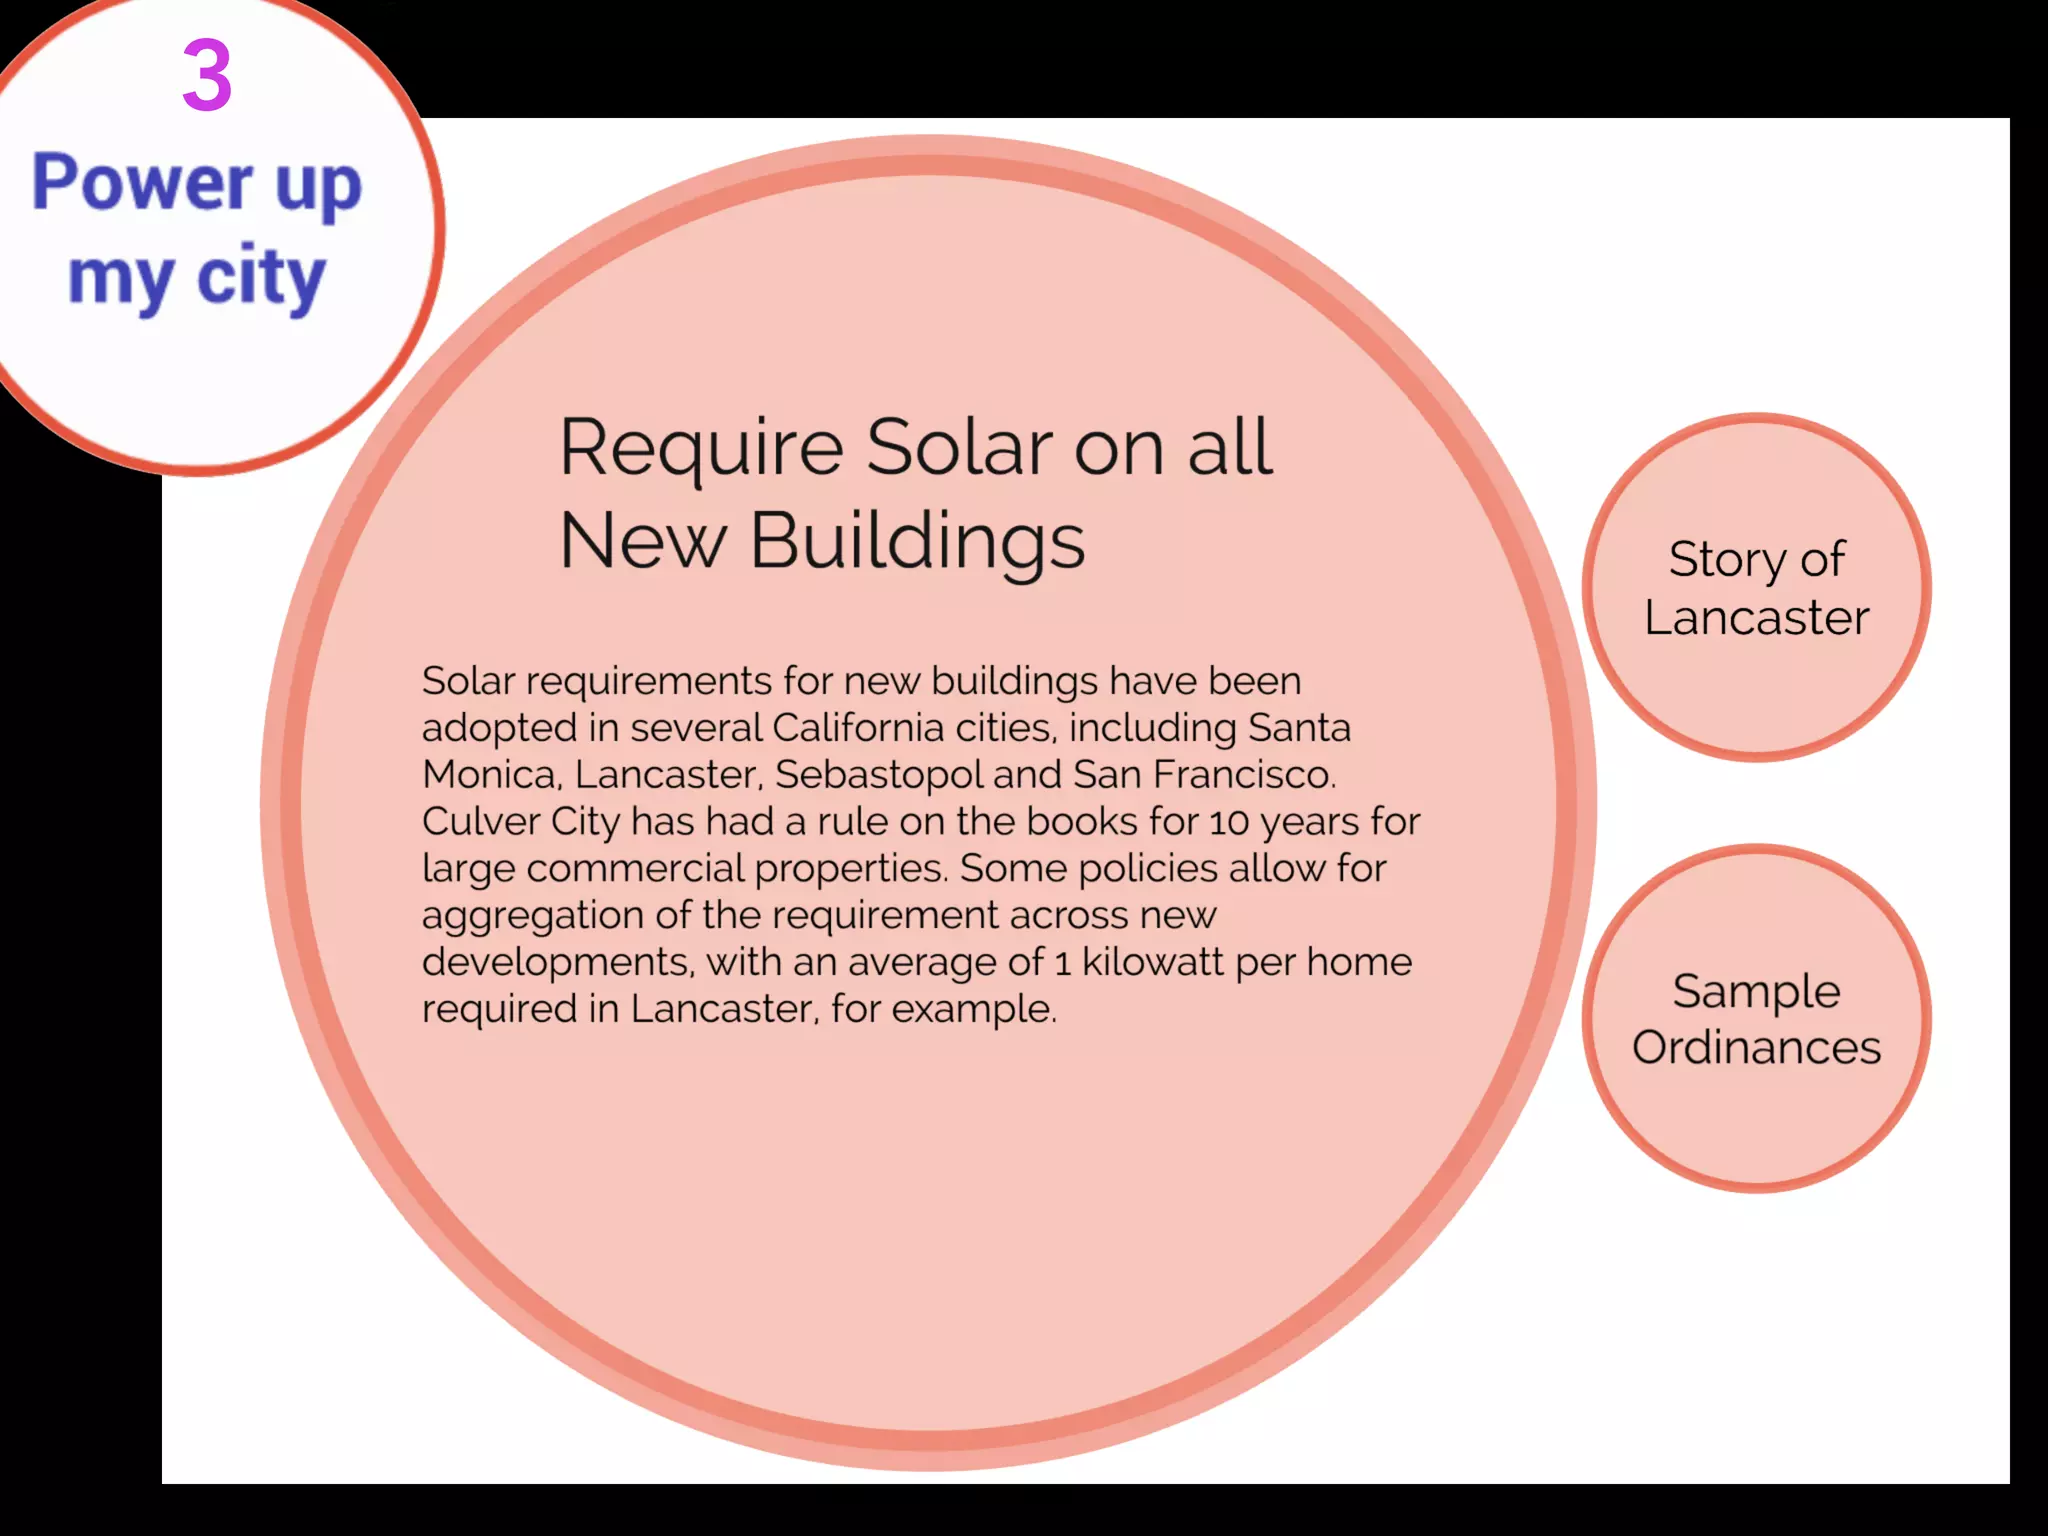
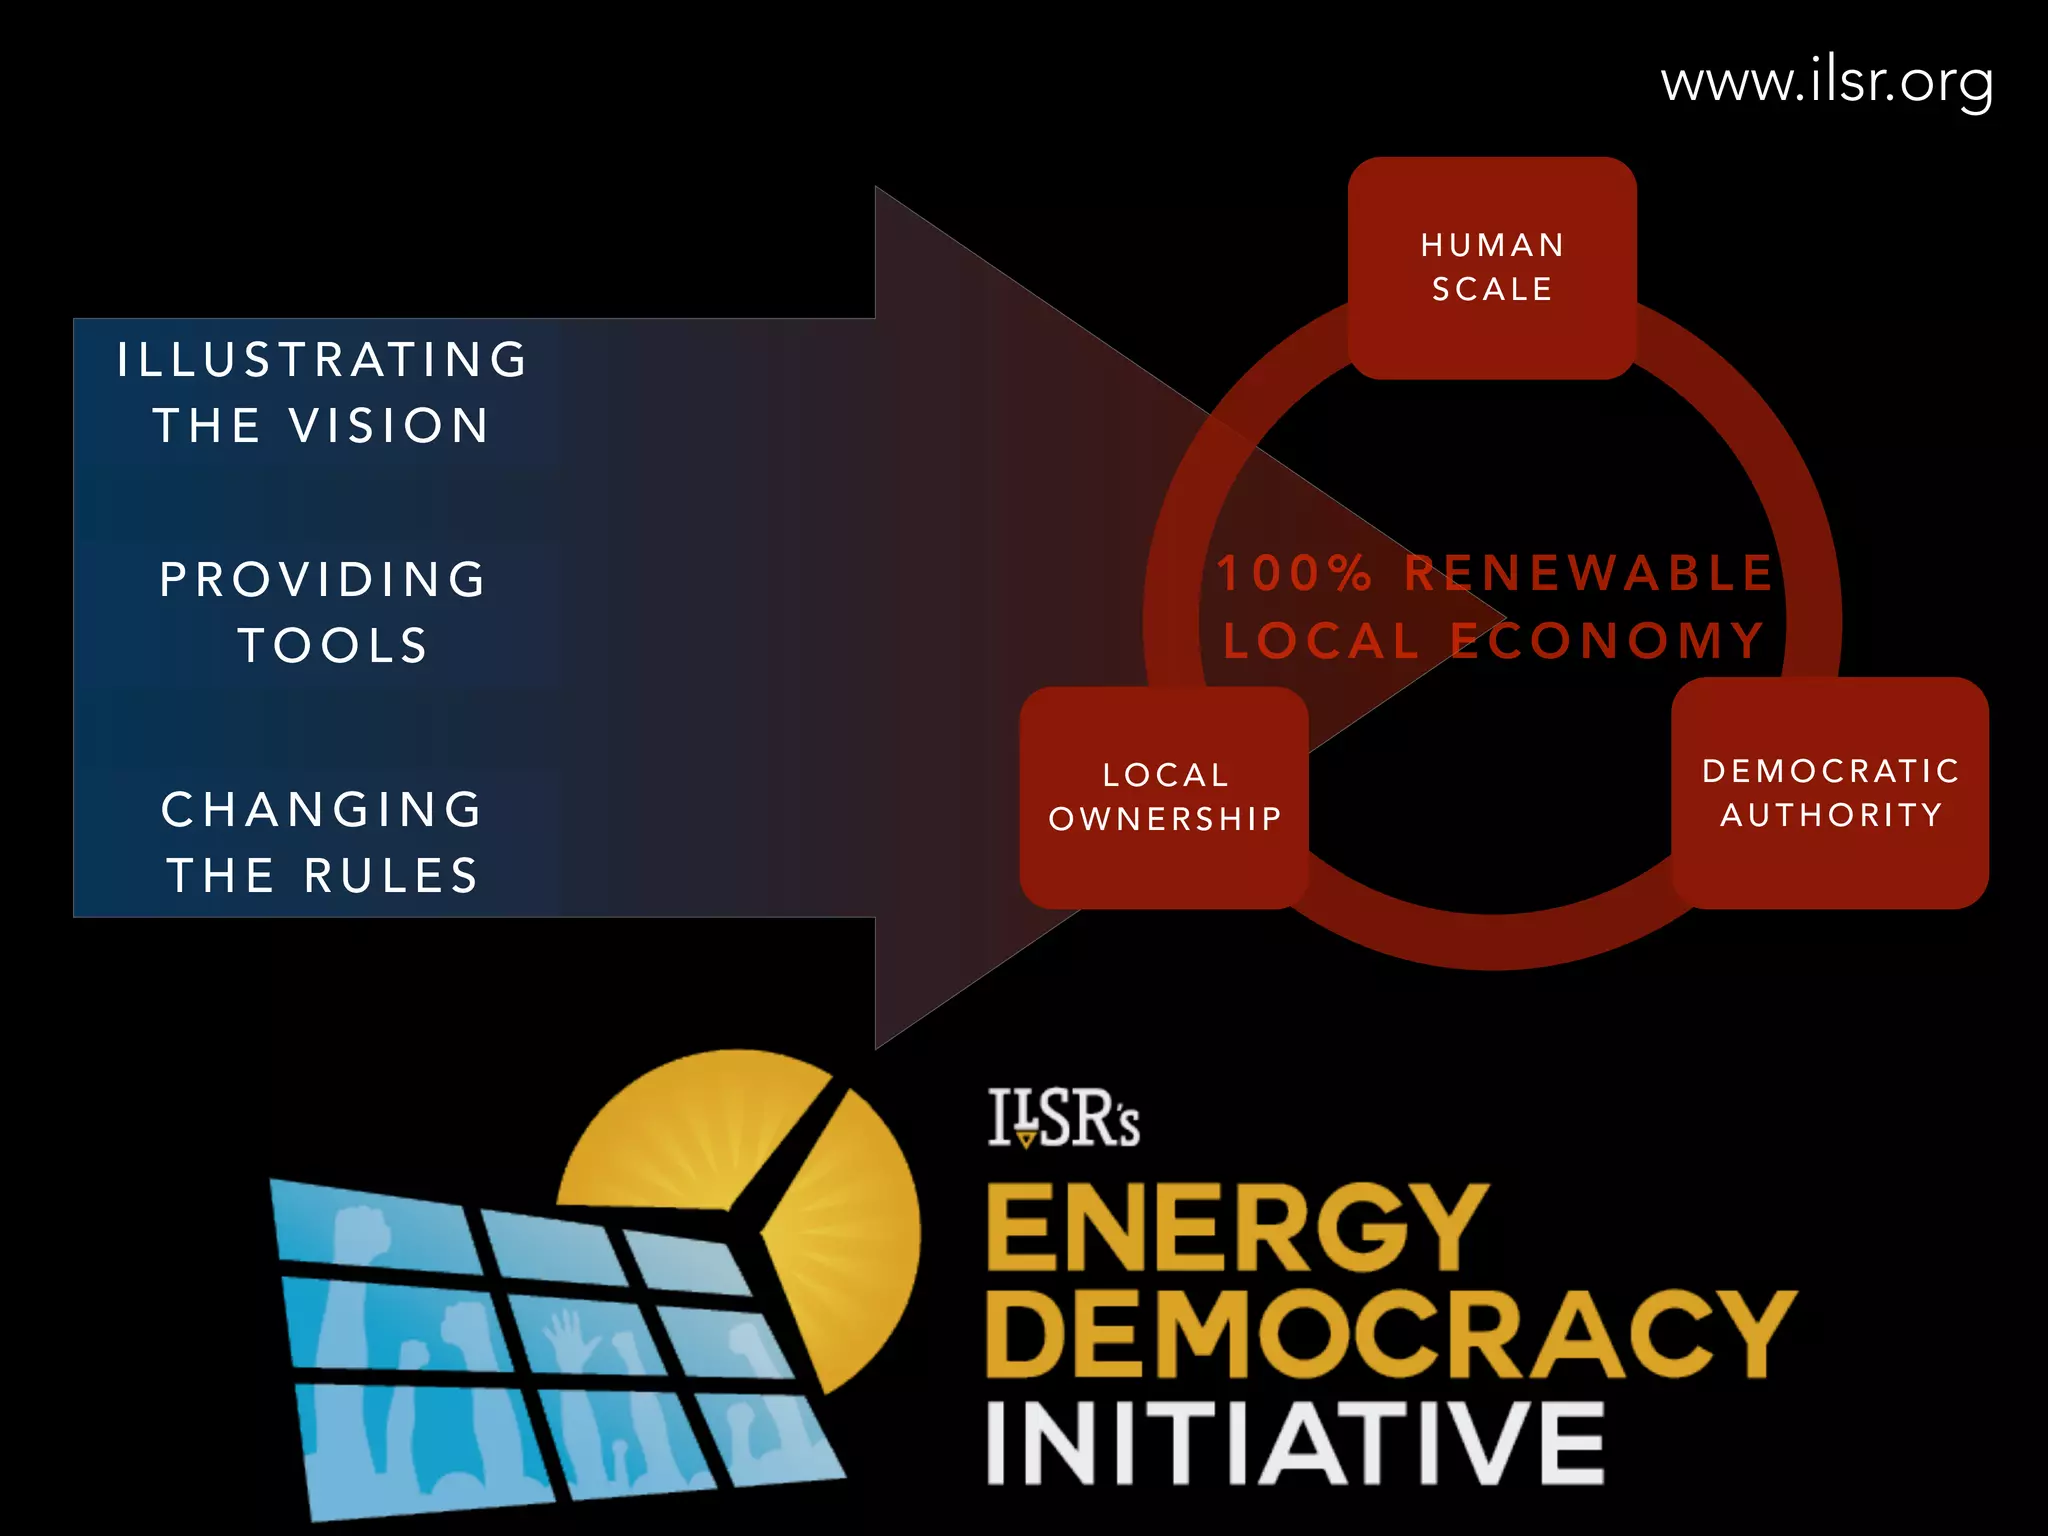

The document presents a case for local energy and renewable commitments, highlighting the potential of wind and rooftop solar power to meet state electricity needs. It emphasizes the economic benefits of local renewable energy investments and discusses various examples of cities and cooperatives achieving 100% renewable energy goals. It advocates for community ownership and democratic control of energy resources to capture the benefits of renewable power locally.


![Pollution.ppt [Autosaved].ppt yogesh kumbhar](https://cdn.slidesharecdn.com/ss_thumbnails/pollution-251205194856-d30cfee8-thumbnail.jpg?width=640&height=640&fit=bounds)


