Download to read offline
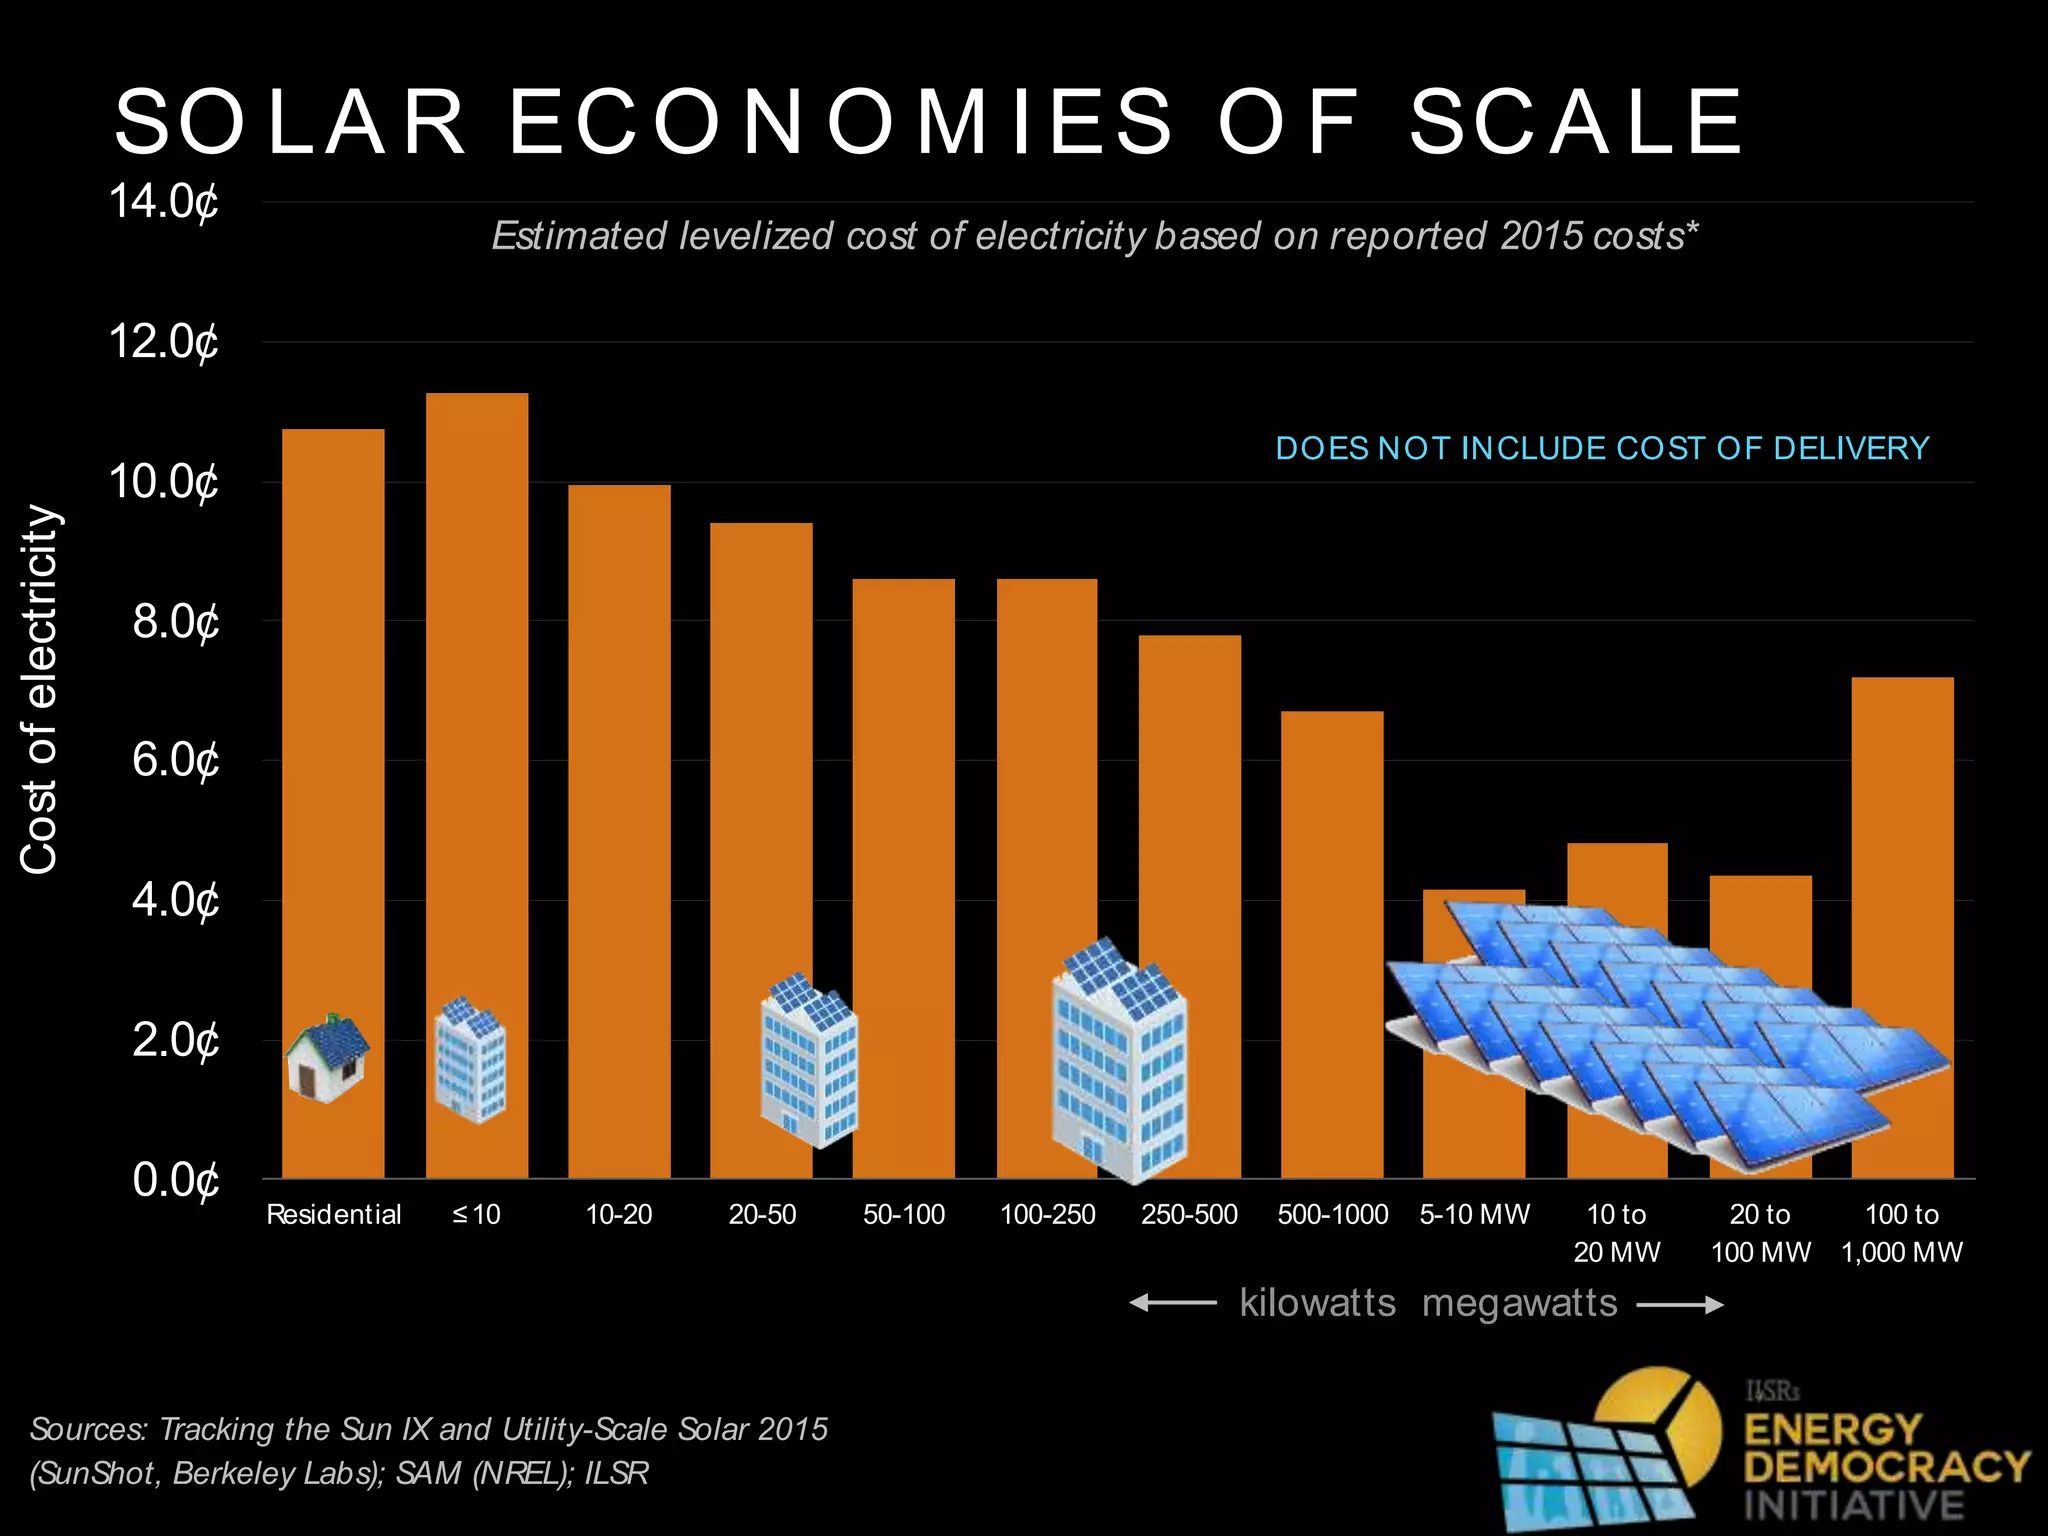
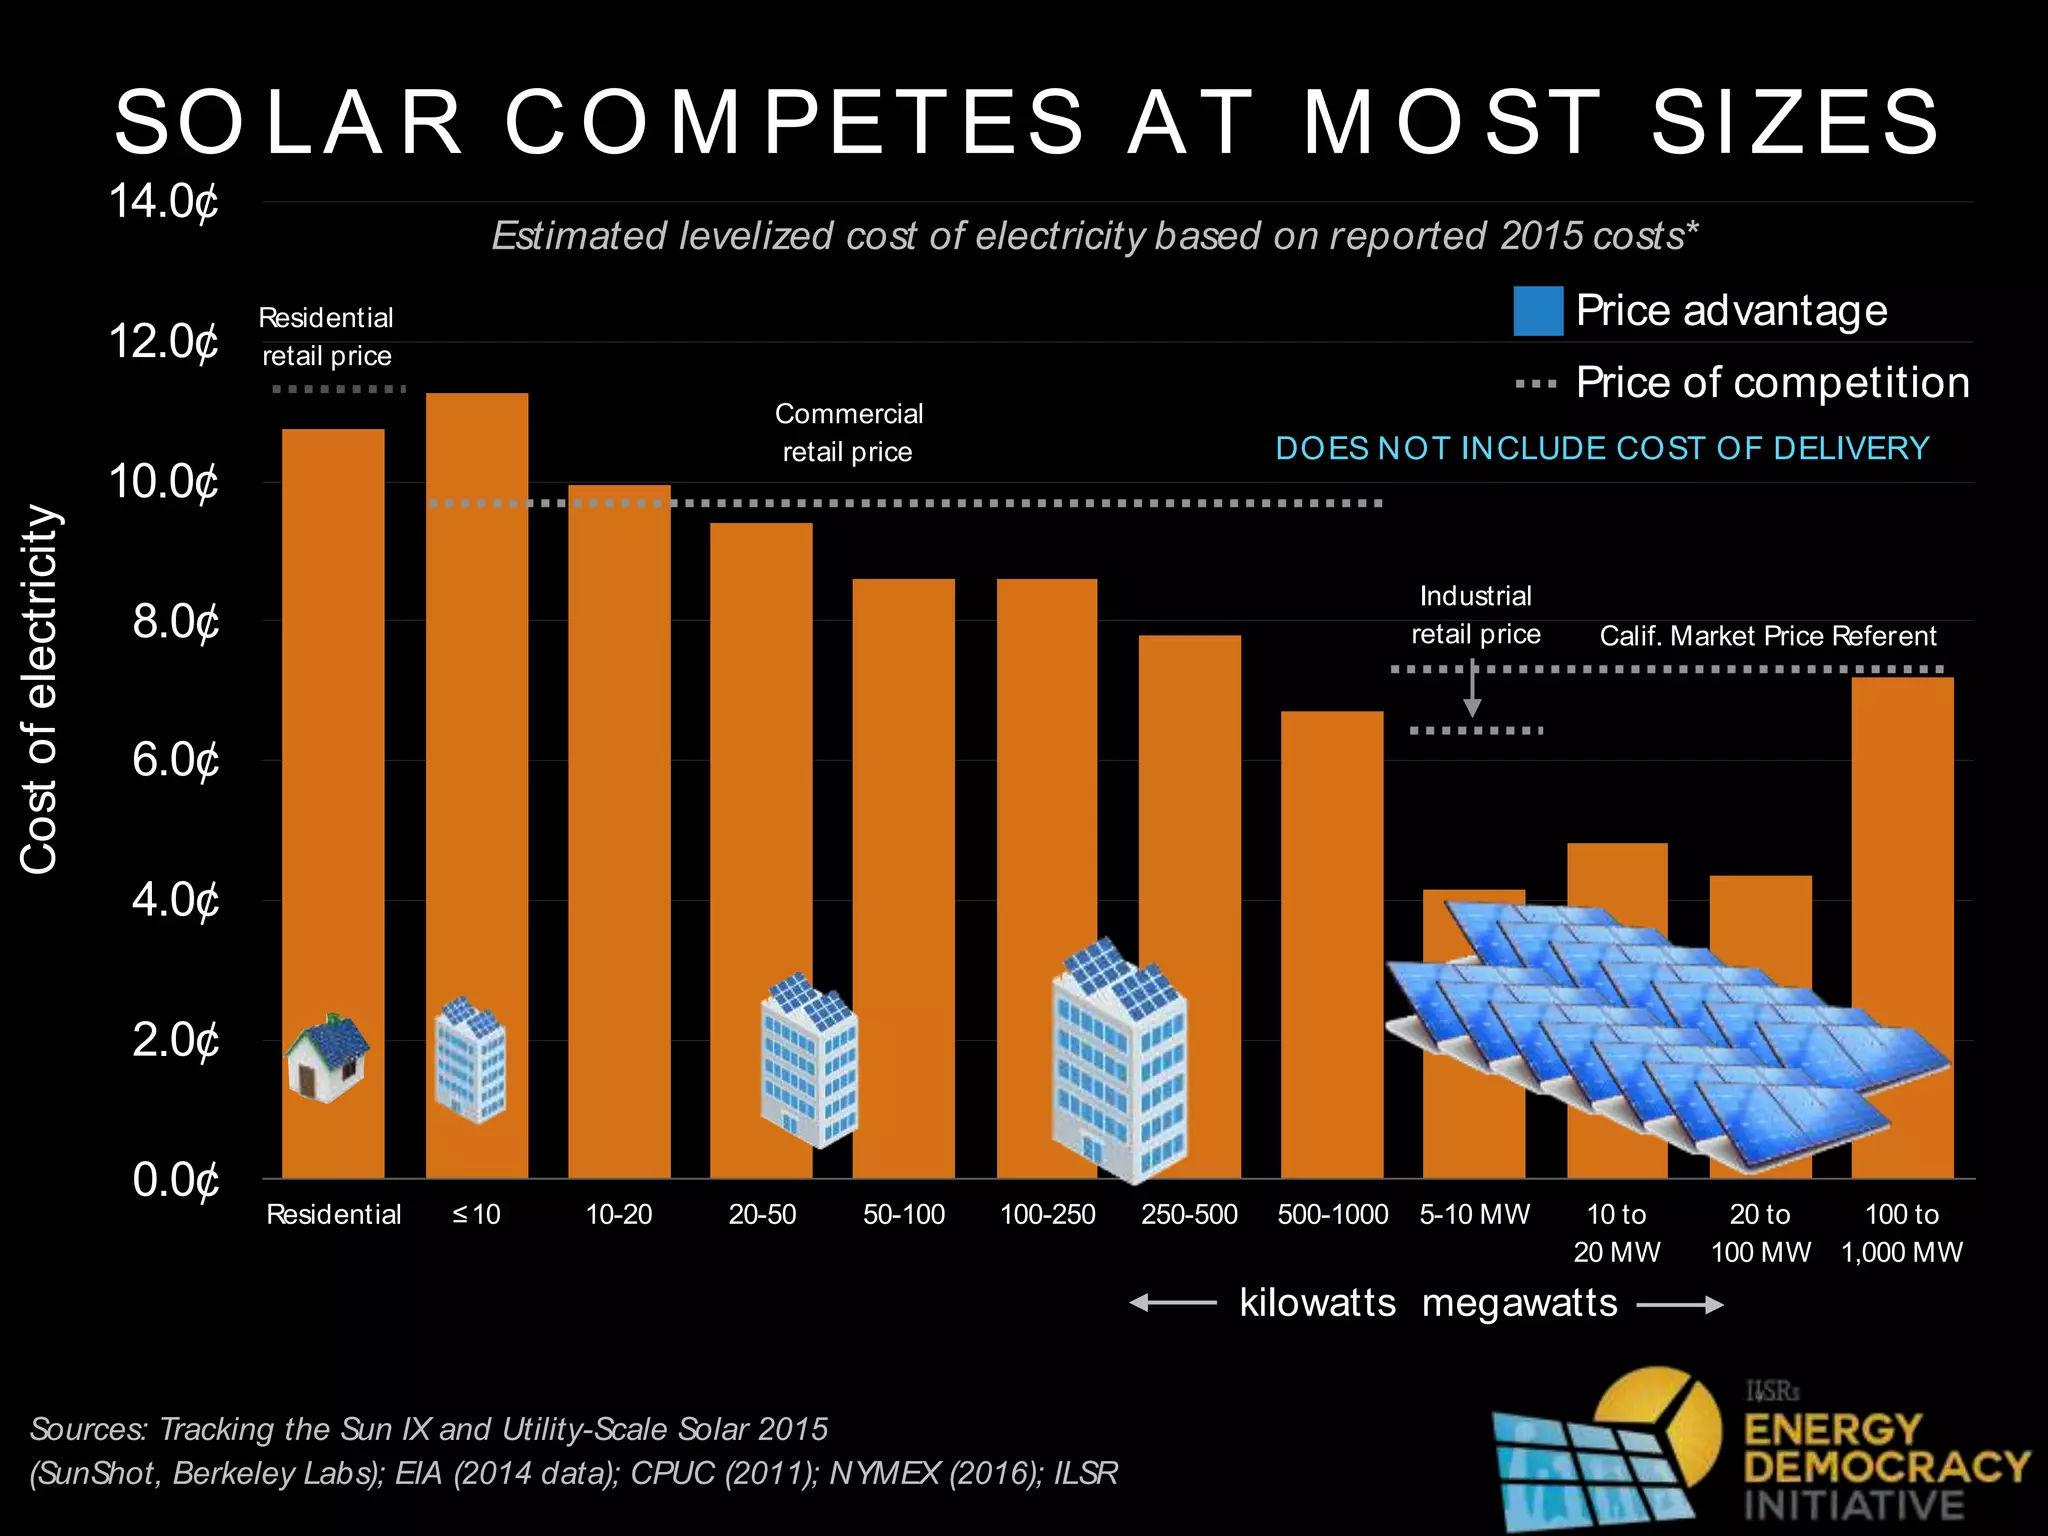
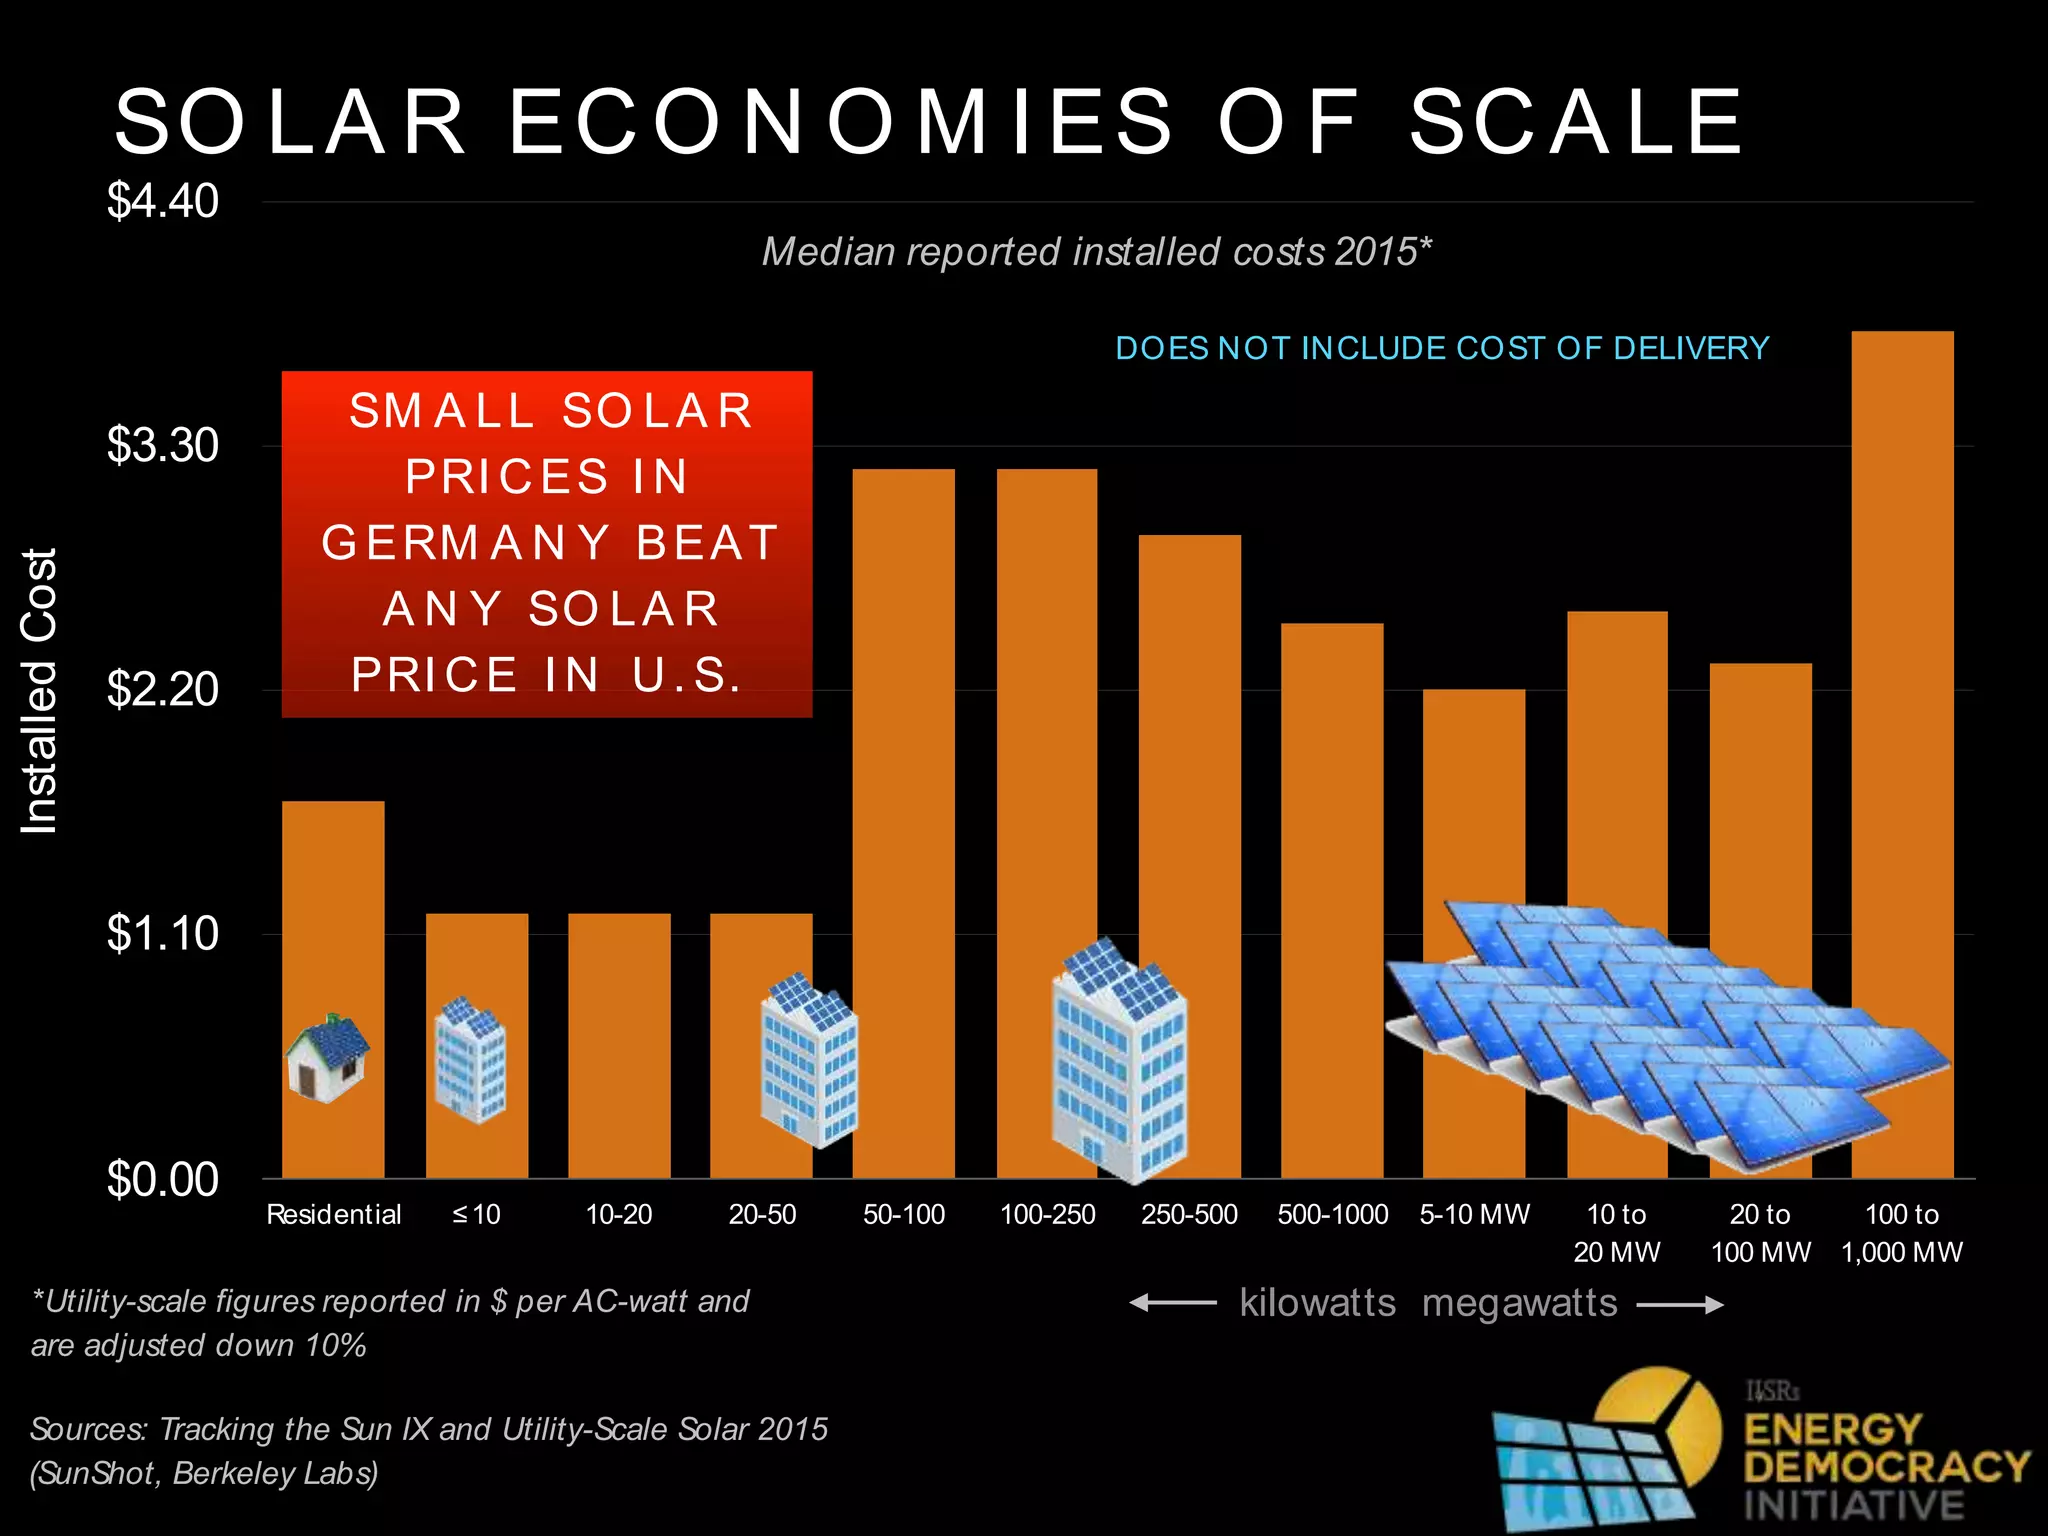
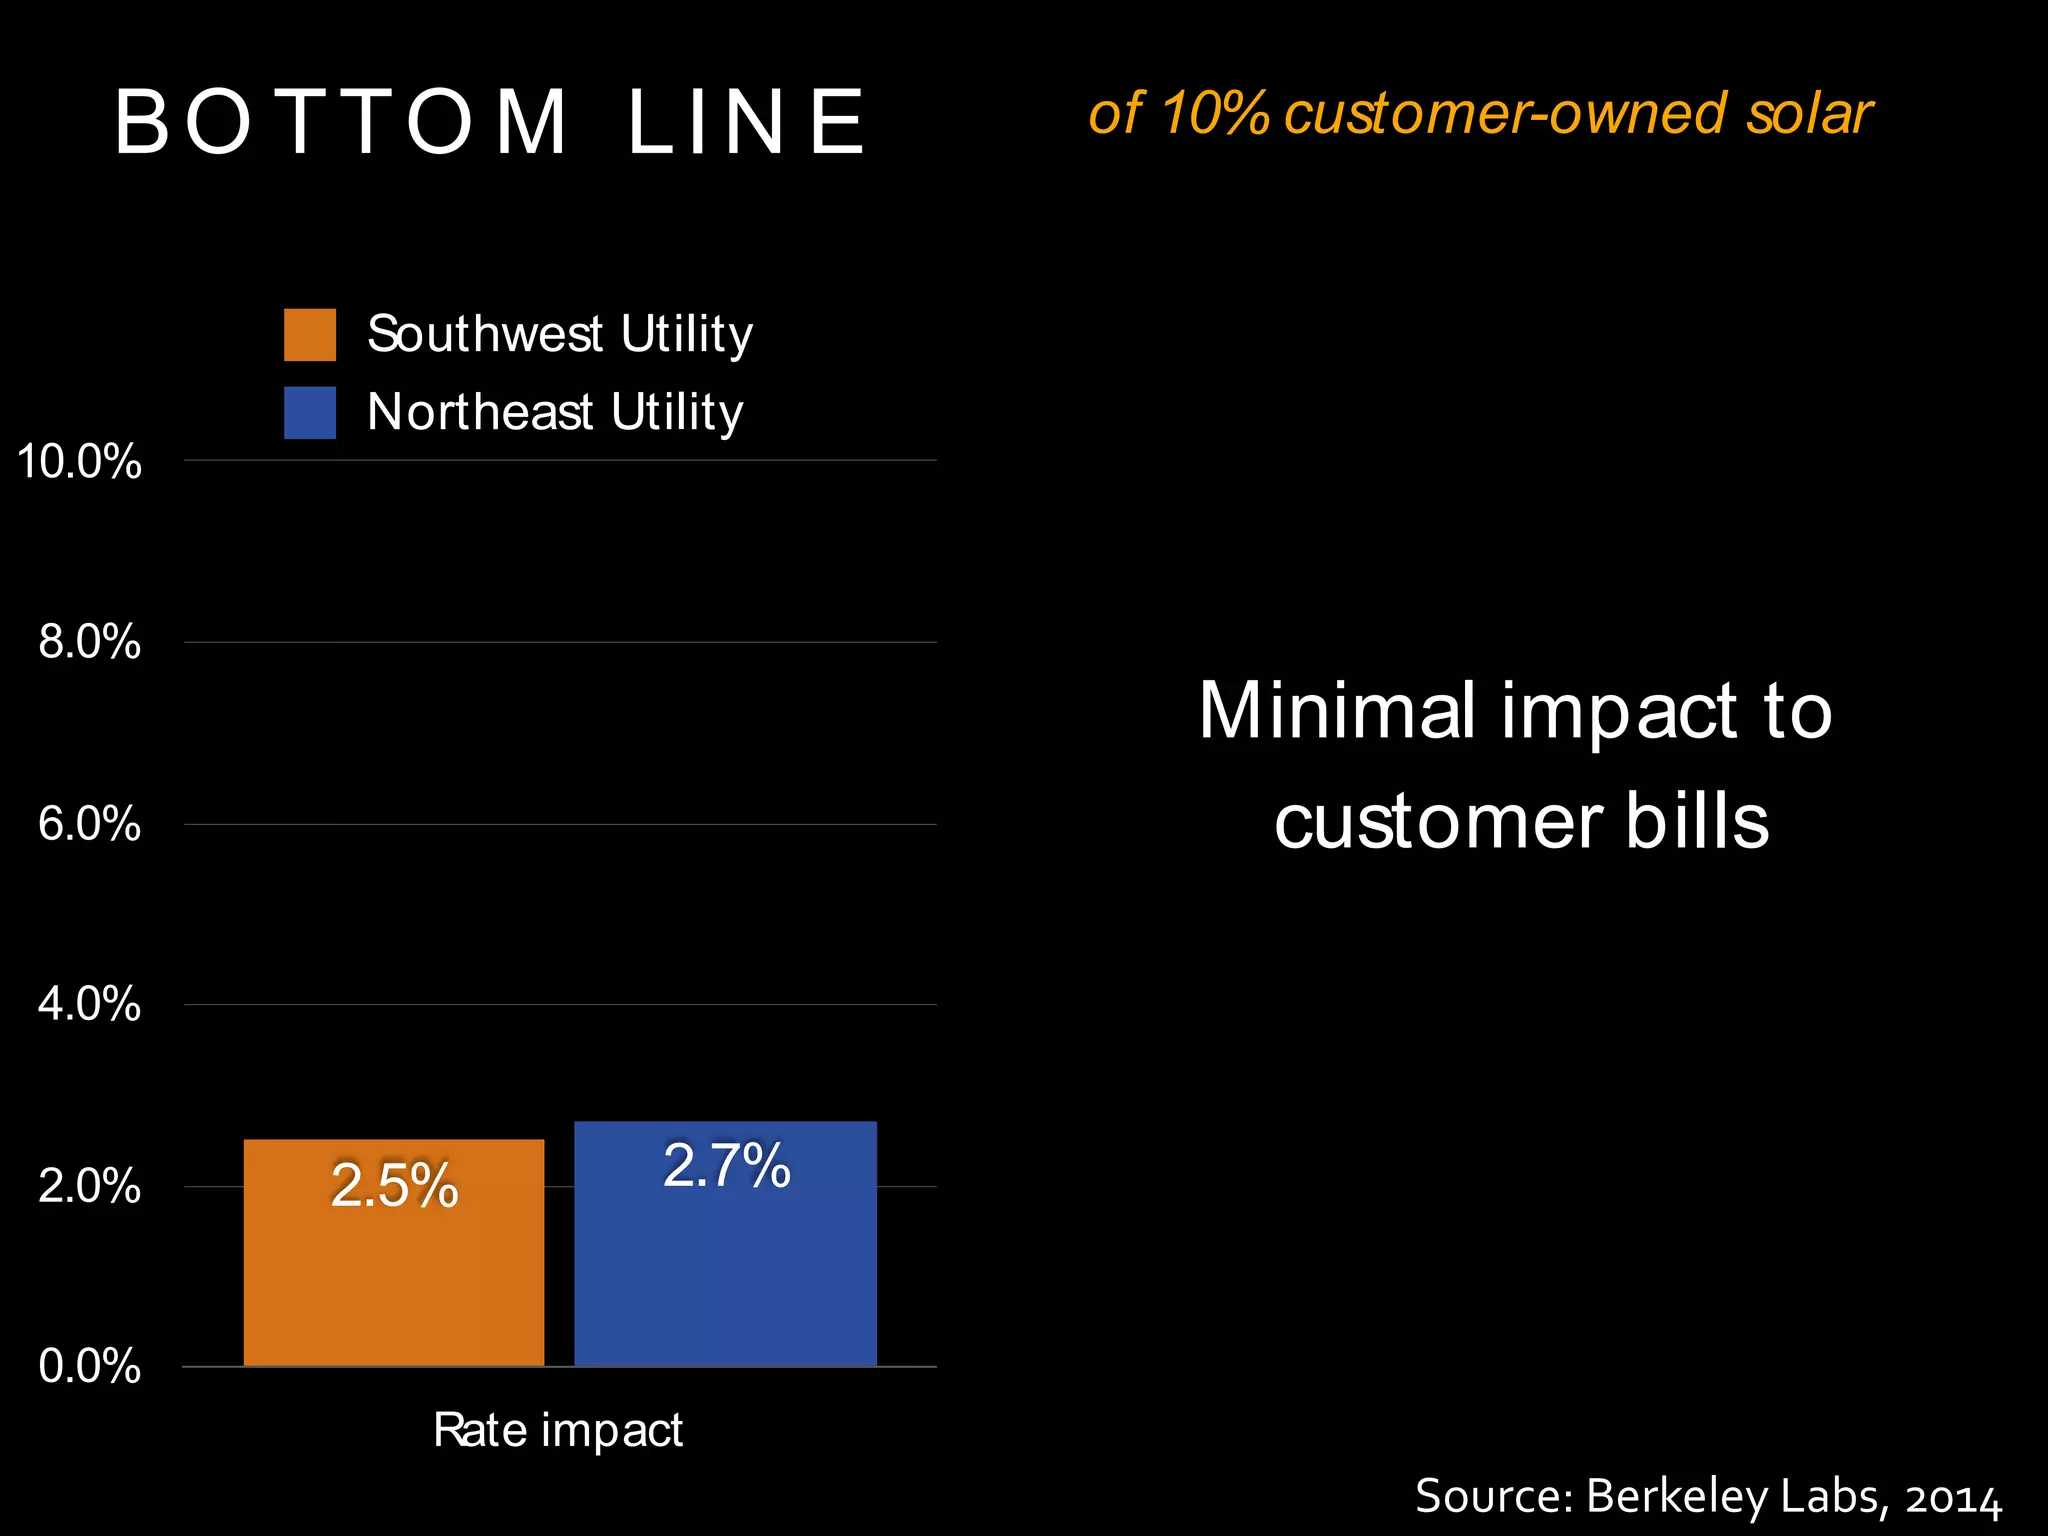
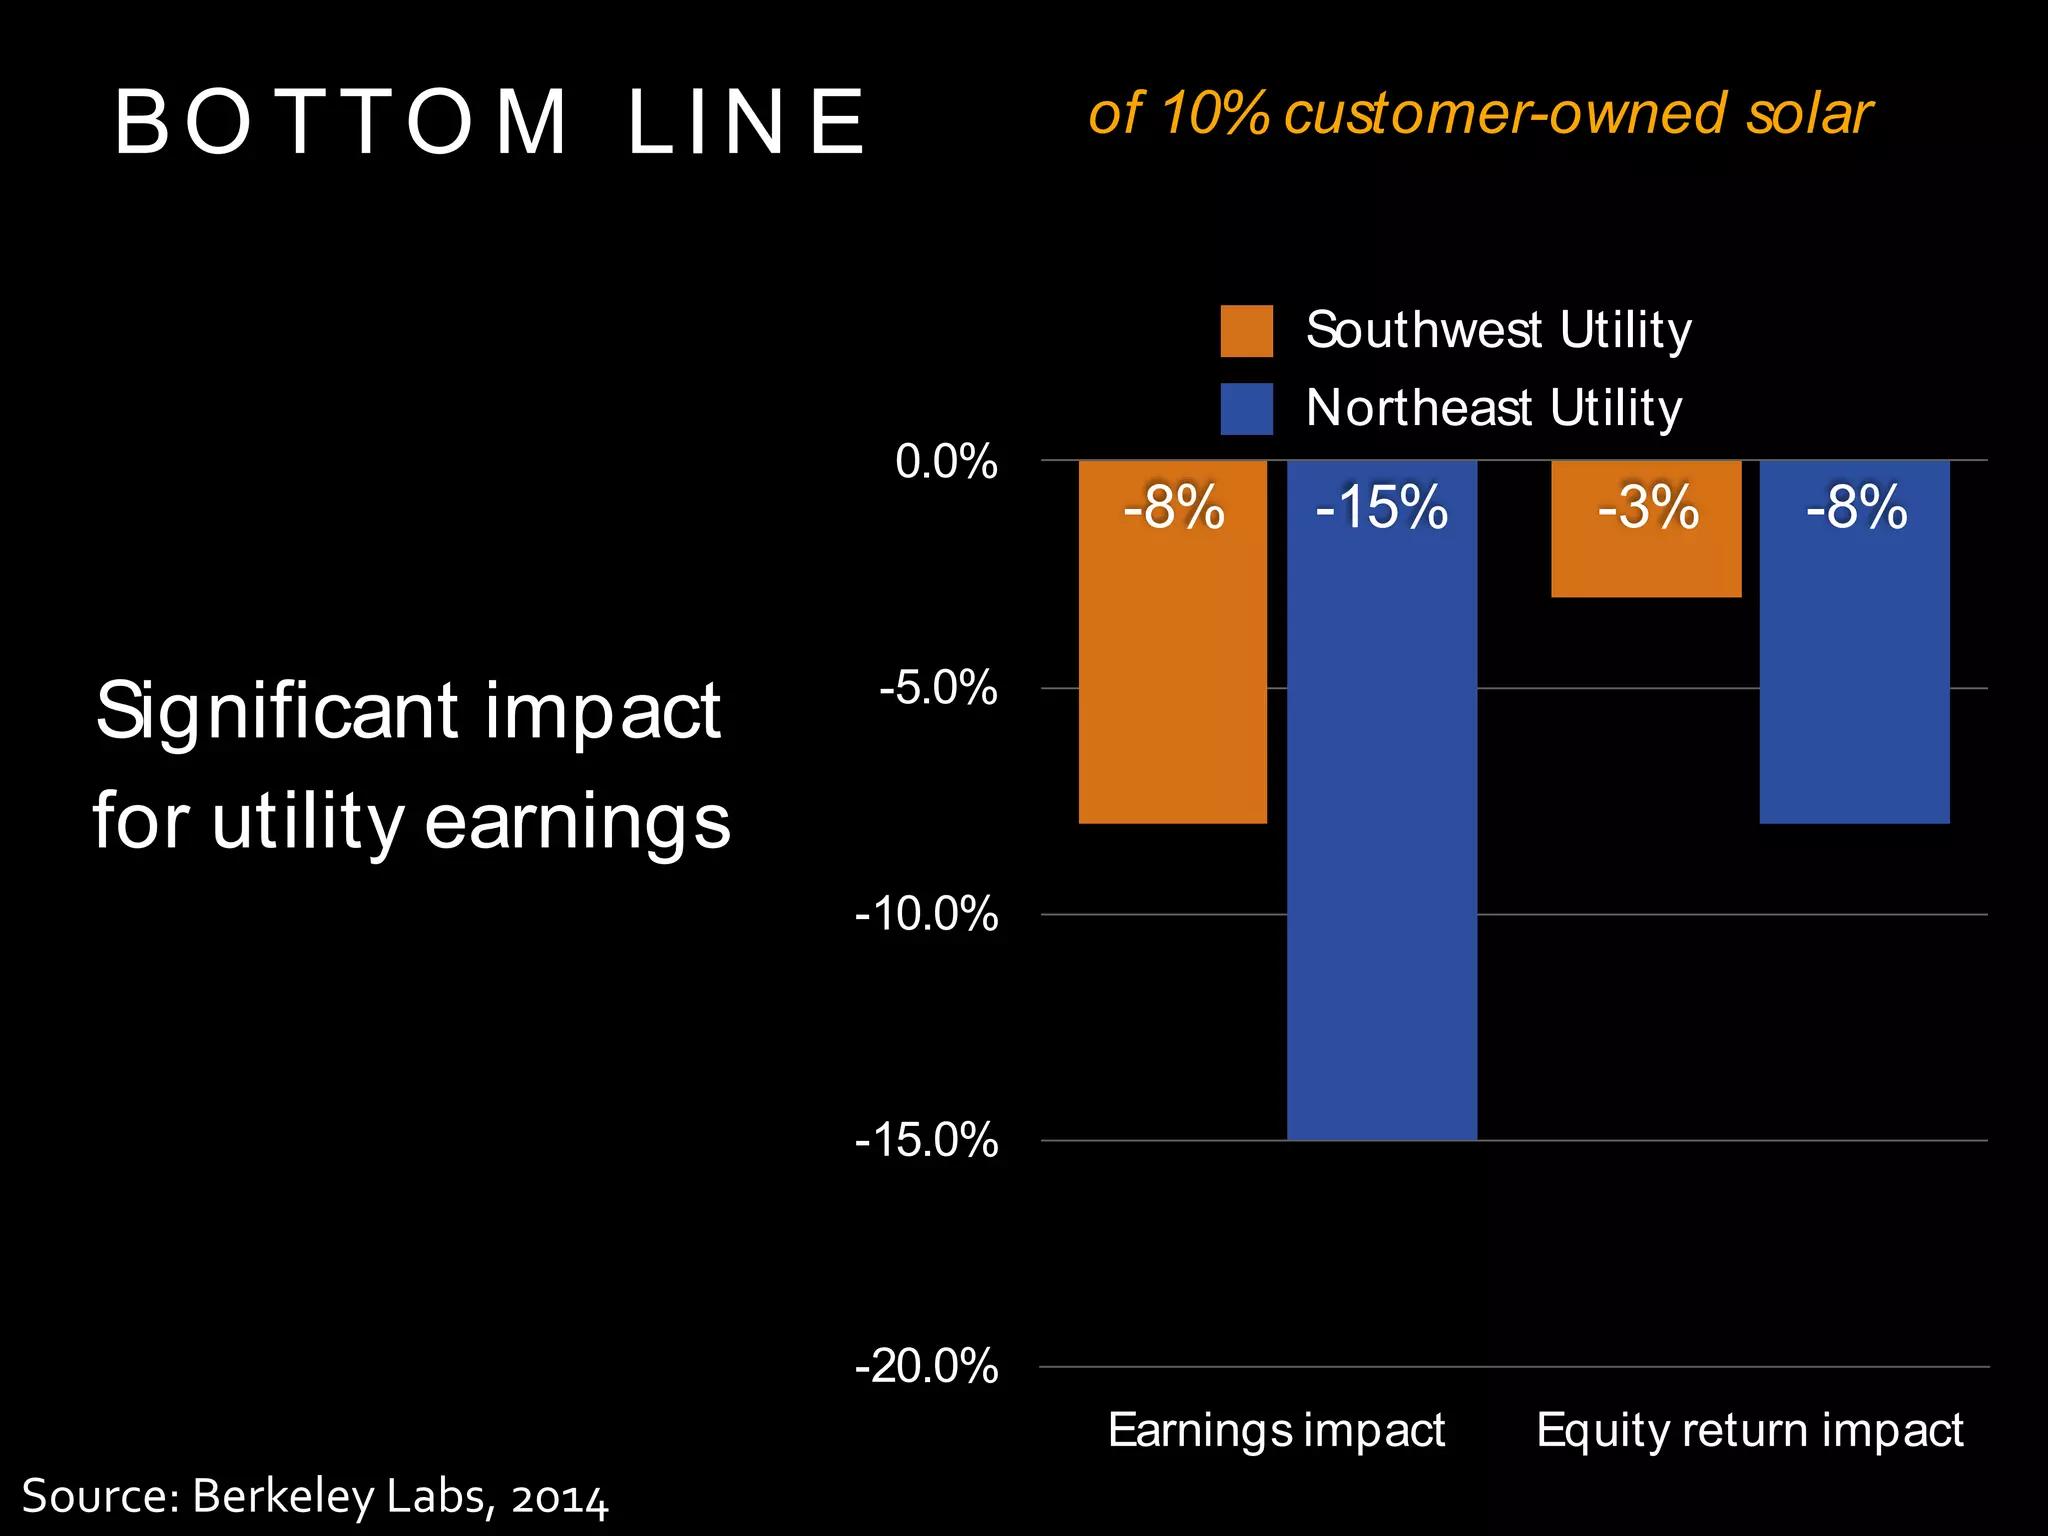


The document investigates the economies of scale for solar energy, revealing that smaller solar installations can compete effectively with larger ones in terms of cost. It compares the estimated levelized cost of electricity for various scales, indicating that solar energy is becoming more affordable and competitive across different sizes. Additionally, it addresses the minimal impact of customer-owned solar on utility bills while highlighting significant implications for utility earnings.


