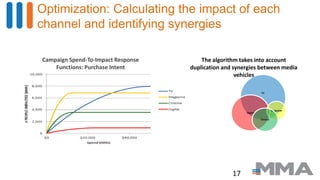
This document describes a study called SMoX.me (Smart Mobile Cross Media Effectiveness) that assessed the effectiveness of mobile marketing. The study found that:
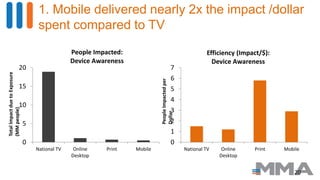
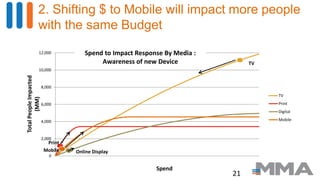
1) Mobile delivered nearly twice the impact per dollar spent compared to television advertising.
2) Reallocating just 5% of the marketing budget from other channels to mobile would result in reaching an additional 2.5 million people.
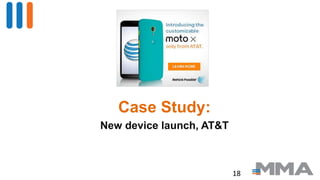
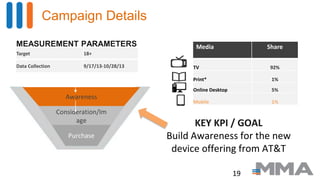
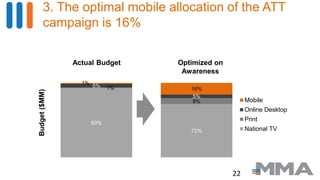
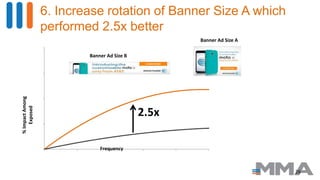
3) The optimized allocation of spending in a campaign by AT&T was 16% to mobile marketing based on increasing awareness.