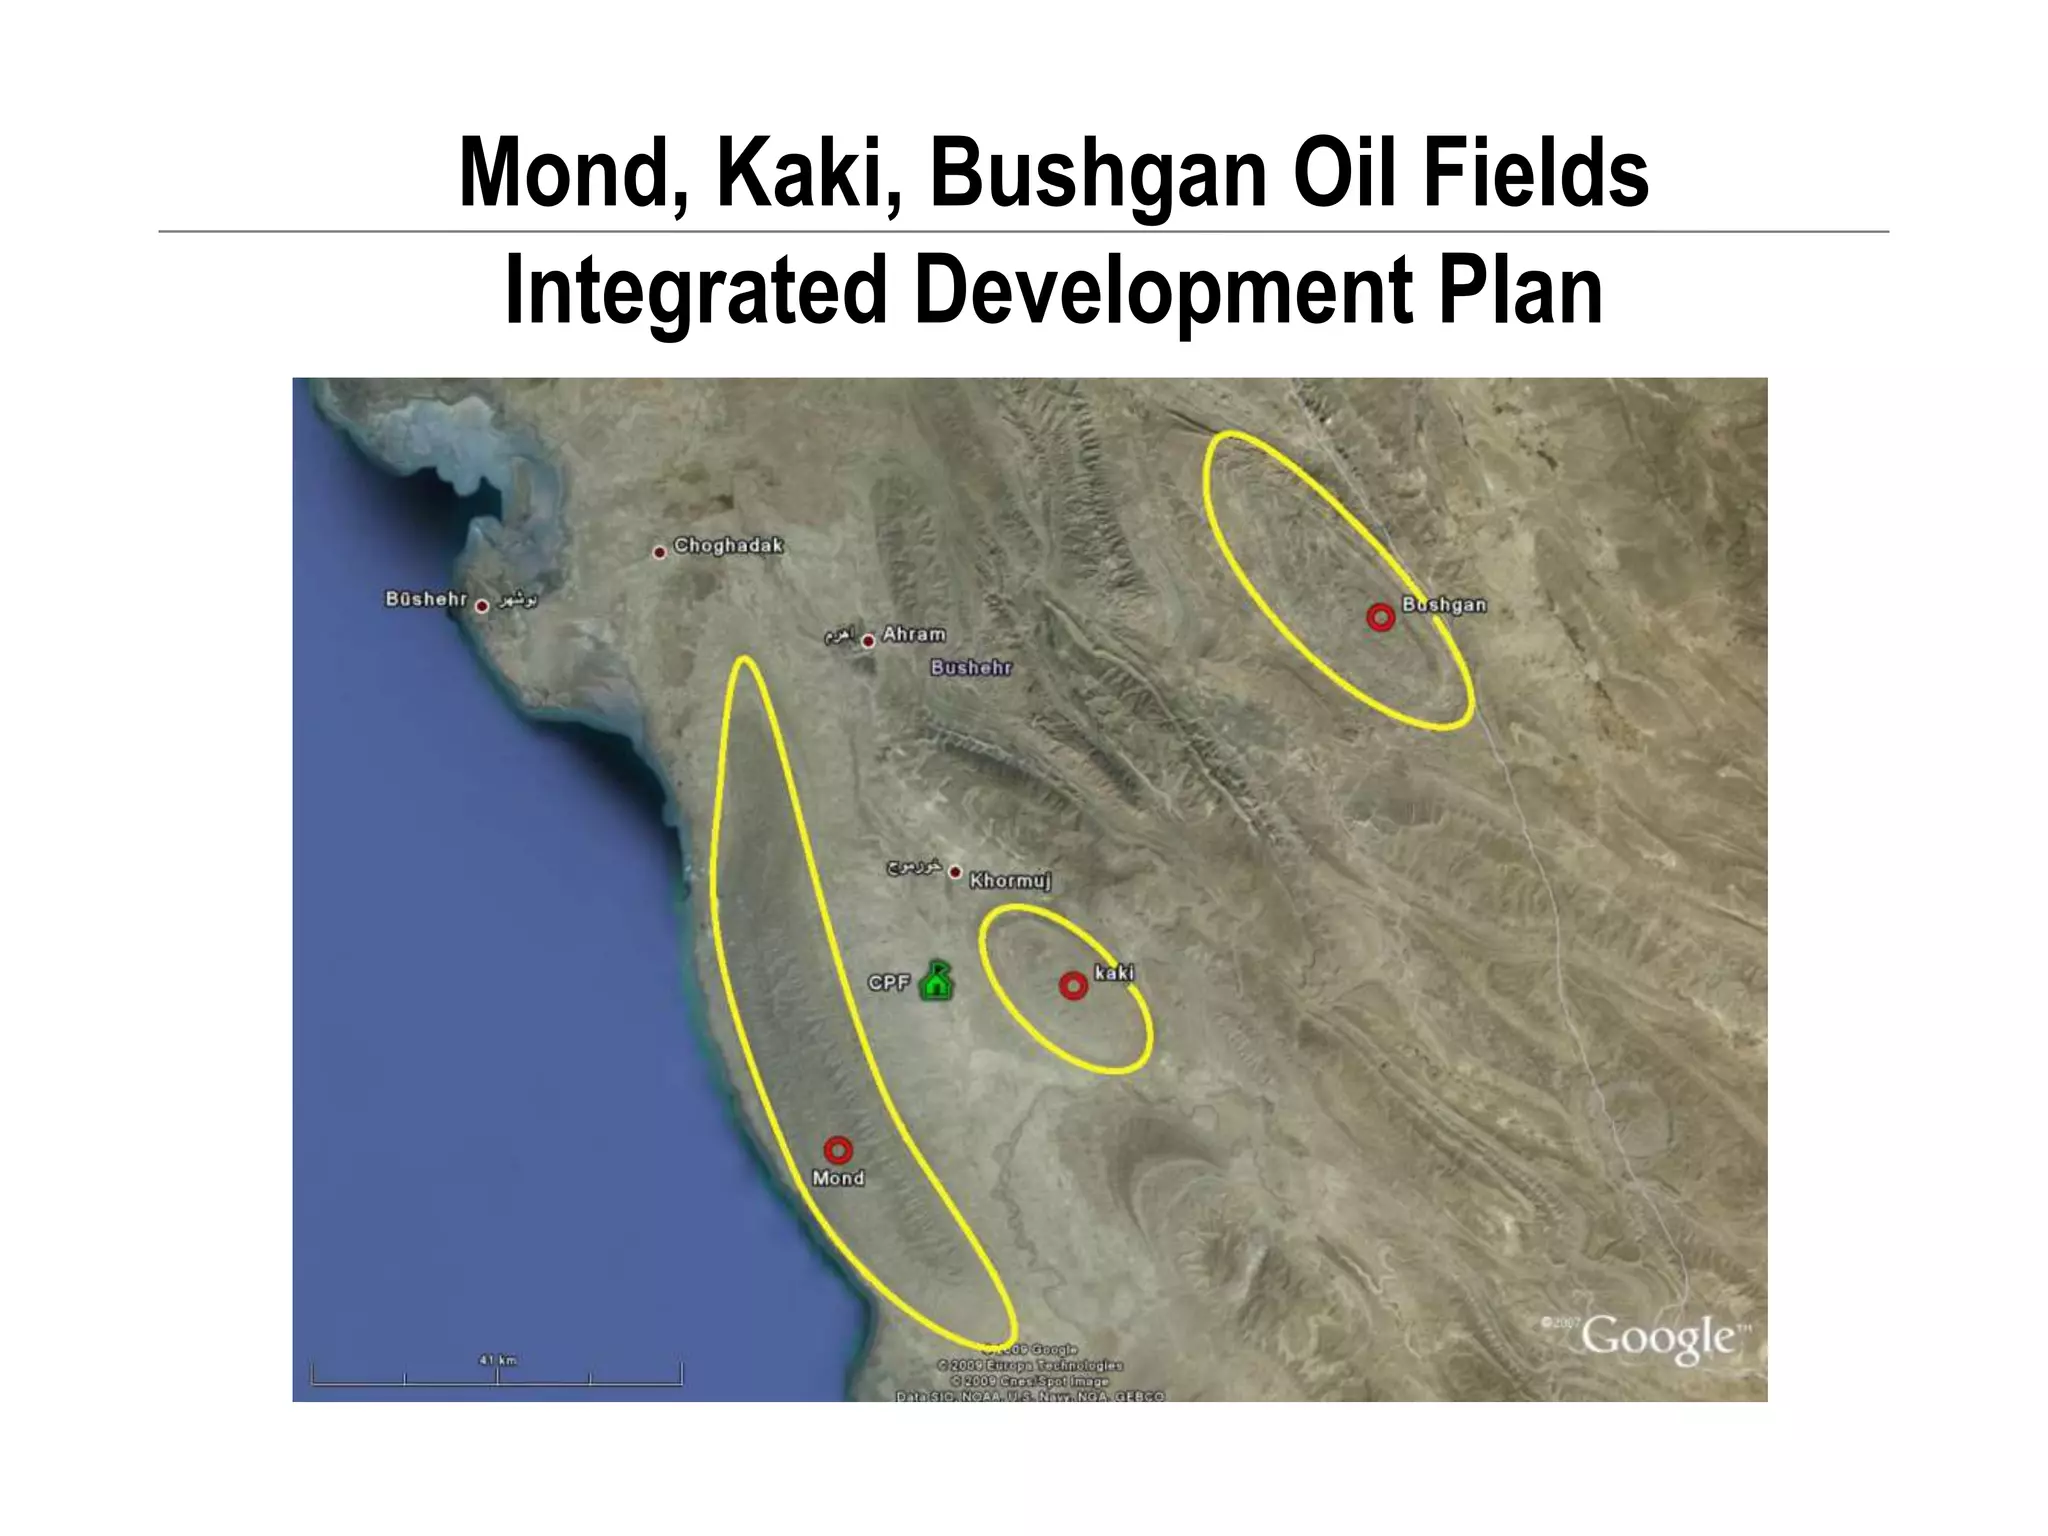
Mond, Kaki, Bushgan Oil Fields
Integrated Development Plan
Mond-Kaki-Bushgan Fields – Development Schedule
TIME-LINE (between now, signing and effective date)
Q1 Q2 Q3 Q4 Q1 Q2 Q3 Q4
Signature of Service Contract
Effective Date - start of project
implementation
Reservoir Committee
Finalisation of Contract
Appendices/
Supplementary Studies
Economic Council/NIOC Board Approval
Background – Kuh-e-Kaki
The Kuh-e-Kaki-1 (“Ku-1”) well was drilled in 1973
Oil was recovered from carbonate reservoirs in the Miocene Asmari Formation, which
flowed 2,000 BOPD during the drilling operations, 5,000 BOPD in 1977 on production test;
and 2,500 BOPD from the Cenomanian Sarvak Formation during the drilling operations
The KU-1 well is the only well on the structure
Digitised wireline logs, drilling, geology and test reports were used to examined the
potential reservoirs in the Ku-1 well
Reservoir Stratigraphy
Asmari - Miocene
Limestones, anhydtite & shales
Fractured & dolomitised
Kaki & Bushgan
Sarvak - Cenomanian
Limestone
Fractured
Kaki & Mond
Mond Field – Overview
Multi-reservoir giant accumulation – 560 km²
2D (650 km) and 3D (150 km2) seismic
8 wells – Two wells (MD-06 and MD-08) produced oil
constrained by pump capacity
MD-08 tested in excess of ~ ... bopd from the Sarvak
formation during an 8-day test
Geological & geophysical, core, well test and PVT
studies
6
Seismic Line datumed and tied to Outcrop Geology
Sarvak
Seismic well tie to Sarvak
MD-08
• 11 Horizons were used to develop the seismic and
structural framework
• Surface Geology
– Aghajari(1), Mishan(2)
• 2D Seismic
– Middle Mishan(3), Asmari(4),
– Jahrum(5), Near Top Ilam(6),
– Sarvak(7), Pabdeh(8),
– Kazhdumi(9), Surmeh(10) & Deep
• 3D Seismic
– Jahrum, Pabdeh, Sarvak
– and Surmeh
Regional Chronostratigraphy
10
1
2
3
6
7
8
9
11
4
5
9
Integrated Surface Geology & 2D/3D Seismic
Aghajari
outcrop
10
DTM Map with Lineaments
Northern Mond
Southern Mond
11
North Mond
Sarvak
12
Top Sarvak Depth map and 3D Amplitudes
amplitude map
13
The Sarvak amplitude map indicates a regular wavelength of
cross-cutting faults/fractures, which could be used as a model for
interpreting the full Mond structure.
Fault Frequency?
MD-7
MD-1MD-4MD-6
MD-5
MD-2
MD-3
14
Sequence Strat Review 2D line 737
Sarvak
SB
Mounds (Basin Floor Fans?)
SB
Asmari
Mishan
15
Kaki : Data
16
• 10 seismic lines
over Kaki
structure
• One well
• A suite of
borehole well
logs
• No checkshot
data.
16
Kaki: Tie to Mond and outcrop geology
17
81055 Version BLine 734Mond
Sarvak
Asmari
Mishan
17
18
Kaki : Cross Faults (Strike line 8150)
Mishan
Asmari
Sarvak
18
Kaki : Perspective View of Asmari Reservoir
1919
Bushgan : Location
20
• 4 seismic lines over
Bushgan Anticline
• More complicated
structure compared
to Kaki
• One well
• No well logs
• No checkshot data.
20
Bushgan : 3D view
2121
Bushgan : Strike line - Cross-Faults.
Asmari
Sarvak
22
Field Area
22
Bushgan: Asmari structural model (ECL)
2323
CF4: Medium-grained Rudist/Echinoderm
wackestone/packstone
CF5: Coarse-grained Rudist floatstone/rudstone
Upper Sarvak Depositional Environments
F1 F2 F3 F4 F5 F6 F7
CF5
CF1
CF4 CF2
CF6 CF3
Fracture Impacts on the Reservoir
Reservoir Facies Correlation
Reservoir Facies Correlation Across the Field
January 24, 2017
30
Pickett Plot Method for Extracting ‘’m’’
• No interval with 100% Water saturation present in the Upper Sarvak.
Therefore “m” cannot be obtained from Pickett plot.
Integrated Study Philosophy
Static and Dynamic Modelling – Upper Sarvak
Dual porosity static model of Upper
Sarvak constructed.
Model was not upscaled for simulation
Simulation model calibrated by history
matching the well test from MD-08
Forecasting and uncertainty analysis
conducted with calibrated simulation
model.
Eclipse Model
Petrel Model
History match of MD-08
Mond Field Development
Phased Development
Phase 1 - 2-well program (Mond-08 reentry
+ 1 new well) providing for simultaneous
appraisal, development and production by
artificial lift.
Phase 2 - 10 development wells and using
2 injection wells for water disposal.
Phase 1 Wells
Phase 2 Wells
MD-08
MD-09
MD-16
MD-15
MD-14
MD-17
MD-10
MD-12
MD-13
MD-11
0
1000
2000
3000
4000
5000
6000
7000
8000
9000
0 2 4 6 8 10 12 14
From Start of First Phase Production (Years)
OilRate(bopd)
0
5
10
15
20
25
30
35
40
45
CumulativeOilProduced(MMStb)
Oil Rate
Cumulative Oil
First Phase
Start of Second Phase
Mond Field – Subsurface Uncertainties (Phase 1)

MKB Integrated Development Plan

  • 1.
    Mond, Kaki, BushganOil Fields Integrated Development Plan
  • 2.
    Mond-Kaki-Bushgan Fields –Development Schedule
  • 3.
    TIME-LINE (between now,signing and effective date) Q1 Q2 Q3 Q4 Q1 Q2 Q3 Q4 Signature of Service Contract Effective Date - start of project implementation Reservoir Committee Finalisation of Contract Appendices/ Supplementary Studies Economic Council/NIOC Board Approval
  • 4.
    Background – Kuh-e-Kaki TheKuh-e-Kaki-1 (“Ku-1”) well was drilled in 1973 Oil was recovered from carbonate reservoirs in the Miocene Asmari Formation, which flowed 2,000 BOPD during the drilling operations, 5,000 BOPD in 1977 on production test; and 2,500 BOPD from the Cenomanian Sarvak Formation during the drilling operations The KU-1 well is the only well on the structure Digitised wireline logs, drilling, geology and test reports were used to examined the potential reservoirs in the Ku-1 well
  • 5.
    Reservoir Stratigraphy Asmari -Miocene Limestones, anhydtite & shales Fractured & dolomitised Kaki & Bushgan Sarvak - Cenomanian Limestone Fractured Kaki & Mond
  • 6.
    Mond Field –Overview Multi-reservoir giant accumulation – 560 km² 2D (650 km) and 3D (150 km2) seismic 8 wells – Two wells (MD-06 and MD-08) produced oil constrained by pump capacity MD-08 tested in excess of ~ ... bopd from the Sarvak formation during an 8-day test Geological & geophysical, core, well test and PVT studies 6
  • 7.
    Seismic Line datumedand tied to Outcrop Geology Sarvak
  • 8.
    Seismic well tieto Sarvak MD-08
  • 9.
    • 11 Horizonswere used to develop the seismic and structural framework • Surface Geology – Aghajari(1), Mishan(2) • 2D Seismic – Middle Mishan(3), Asmari(4), – Jahrum(5), Near Top Ilam(6), – Sarvak(7), Pabdeh(8), – Kazhdumi(9), Surmeh(10) & Deep • 3D Seismic – Jahrum, Pabdeh, Sarvak – and Surmeh Regional Chronostratigraphy 10 1 2 3 6 7 8 9 11 4 5 9
  • 10.
    Integrated Surface Geology& 2D/3D Seismic Aghajari outcrop 10
  • 11.
    DTM Map withLineaments Northern Mond Southern Mond 11
  • 12.
  • 13.
    Top Sarvak Depthmap and 3D Amplitudes amplitude map 13
  • 14.
    The Sarvak amplitudemap indicates a regular wavelength of cross-cutting faults/fractures, which could be used as a model for interpreting the full Mond structure. Fault Frequency? MD-7 MD-1MD-4MD-6 MD-5 MD-2 MD-3 14
  • 15.
    Sequence Strat Review2D line 737 Sarvak SB Mounds (Basin Floor Fans?) SB Asmari Mishan 15
  • 16.
    Kaki : Data 16 •10 seismic lines over Kaki structure • One well • A suite of borehole well logs • No checkshot data. 16
  • 17.
    Kaki: Tie toMond and outcrop geology 17 81055 Version BLine 734Mond Sarvak Asmari Mishan 17
  • 18.
    18 Kaki : CrossFaults (Strike line 8150) Mishan Asmari Sarvak 18
  • 19.
    Kaki : PerspectiveView of Asmari Reservoir 1919
  • 20.
    Bushgan : Location 20 •4 seismic lines over Bushgan Anticline • More complicated structure compared to Kaki • One well • No well logs • No checkshot data. 20
  • 21.
    Bushgan : 3Dview 2121
  • 22.
    Bushgan : Strikeline - Cross-Faults. Asmari Sarvak 22 Field Area 22
  • 23.
  • 24.
  • 25.
    CF5: Coarse-grained Rudistfloatstone/rudstone
  • 26.
    Upper Sarvak DepositionalEnvironments F1 F2 F3 F4 F5 F6 F7
  • 27.
    CF5 CF1 CF4 CF2 CF6 CF3 FractureImpacts on the Reservoir
  • 28.
  • 29.
  • 30.
  • 31.
    Pickett Plot Methodfor Extracting ‘’m’’ • No interval with 100% Water saturation present in the Upper Sarvak. Therefore “m” cannot be obtained from Pickett plot.
  • 32.
  • 33.
    Static and DynamicModelling – Upper Sarvak Dual porosity static model of Upper Sarvak constructed. Model was not upscaled for simulation Simulation model calibrated by history matching the well test from MD-08 Forecasting and uncertainty analysis conducted with calibrated simulation model. Eclipse Model Petrel Model History match of MD-08
  • 34.
    Mond Field Development PhasedDevelopment Phase 1 - 2-well program (Mond-08 reentry + 1 new well) providing for simultaneous appraisal, development and production by artificial lift. Phase 2 - 10 development wells and using 2 injection wells for water disposal. Phase 1 Wells Phase 2 Wells MD-08 MD-09 MD-16 MD-15 MD-14 MD-17 MD-10 MD-12 MD-13 MD-11 0 1000 2000 3000 4000 5000 6000 7000 8000 9000 0 2 4 6 8 10 12 14 From Start of First Phase Production (Years) OilRate(bopd) 0 5 10 15 20 25 30 35 40 45 CumulativeOilProduced(MMStb) Oil Rate Cumulative Oil First Phase Start of Second Phase
  • 35.
    Mond Field –Subsurface Uncertainties (Phase 1)