Download to read offline
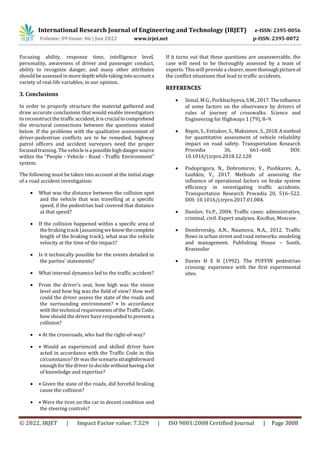

This document examines collisions between pedestrians and vehicles, analyzing data on traffic accidents in Samara, Russia. It finds that 50-60% of collisions are due to pedestrian infractions like crossing outside of designated areas, while 20-27% are due to driver infractions like speeding. The document analyzes common collision points, like intersections and locations where pedestrians walk alongside traffic. It concludes that better training is needed for traffic investigators to properly assess conflicts between drivers and pedestrians.


