“Comprehensive study ofpedestrian crossing behaviour at
unsignalized intersection -A case study at BSF junction-
Yelahanka,560064”
Presented by
Name: Chetan doddamani
SRN: R21TK004
Guide: Sreenatha M
Assistant Professor
School of Civil Engineering
REVA University
2.
CONTENTS
1. Introduction
2. Literaturereview
3. Summary of literature review
4. Research gaps
5. Objectives
6. Methodology
7. Progress till now….
8. References
1
3.
INTRODUCTION
Pedestrian Safety– Still a significant problem in India – due to mixed traffic condtitions
Intersections – hazardous locations for pedestrians
Increased vehicular traffic – decreased pedestrian safety – walking trips should be encouraged with
an assurance to their safety
Need for understanding Pedestrian behavior through characteristics: age, gender, luggage, trip
purpose, environmental characteristics, vehicle characteristics and vehicular flow characteristics,
land use type.
BSF has been considered for present study as it is one of the major Uncontrolled (unsignalized)
intersection around the locality.
Present study focuses on the interactions of two-wheeler, auto rickshaw and cars with pedestrians at
uncontrolled intersection (unsignalized intersections)
Checking out the factors which are influencing vehicles and pedestrian interactions.
2
4.
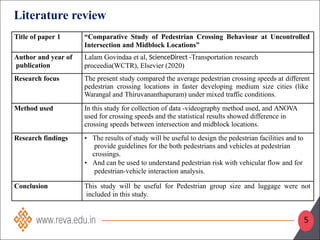
Title of paper1 “Comparative Study of Pedestrian Crossing Behaviour at Uncontrolled
Intersection and Midblock Locations”
Author and year of
publication
Lalam Govindaa et al, ScienceDirect -Transportation research
proceedia(WCTR), Elsevier (2020)
Research focus The present study compared the average pedestrian crossing speeds at different
pedestrian crossing locations in faster developing medium size cities (like
Warangal and Thiruvananthapuram) under mixed traffic conditions.
Method used In this study for collection of data -videography method used, and ANOVA
used for crossing speeds and the statistical results showed difference in
crossing speeds between intersection and midblock locations.
Research findings • The results of study will be useful to design the pedestrian facilities and to
provide guidelines for the both pedestrians and vehicles at pedestrian
crossings.
• And can be used to understand pedestrian risk with vehicular flow and for
pedestrian-vehicle interaction analysis.
Conclusion This study will be useful for Pedestrian group size and luggage were not
included in this study.
Literature review
5
5.
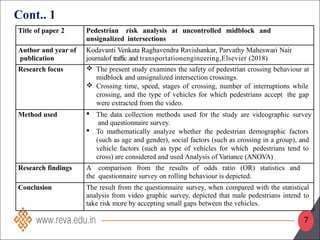
Title of paper2 Pedestrian risk analysis at uncontrolled midblock and
unsignalized intersections
Author and year of
publication
Kodavanti Venkata Raghavendra Ravishankar, Parvathy Maheswari Nair
journalof traffic and transportationengineering,Elsevier (2018)
Research focus The present study examines the safety of pedestrian crossing behaviour at
midblock and unsignalized intersection crossings.
Crossing time, speed, stages of crossing, number of interruptions while
crossing, and the type of vehicles for which pedestrians accept the gap
were extracted from the video.
Method used The data collection methods used for the study are videographic survey
and questionnaire survey.
To mathematically analyze whether the pedestrian demographic factors
(such as age and gender), social factors (such as crossing in a group), and
vehicle factors (such as type of vehicles for which pedestrians tend to
cross) are considered and used Analysis of Variance (ANOVA)
Research findings A comparison from the results of odds ratio (OR) statistics and
the questionnaire survey on rolling behaviour is depicted.
Conclusion The result from the questionnaire survey, when compared with the statistical
analysis from video graphic survey, depicted that male pedestrians intend to
take risk more by accepting small gaps between the vehicles.
Cont.. 1
7
6.
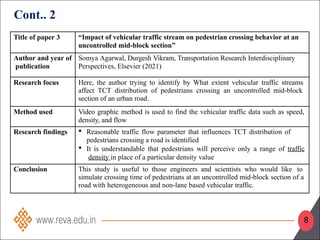
Title of paper3 “Impact of vehicular traffic stream on pedestrian crossing behavior at an
uncontrolled mid-block section”
Author and year of
publication
Somya Agarwal, Durgesh Vikram, Transportation Research Interdisciplinary
Perspectives, Elsevier (2021)
Research focus Here, the author trying to identify by What extent vehicular traffic streams
affect TCT distribution of pedestrians crossing an uncontrolled mid block
‐
section of an urban road.
Method used Video graphic method is used to find the vehicular traffic data such as speed,
density, and flow
Research findings Reasonable traffic flow parameter that influences TCT distribution of
pedestrians crossing a road is identified
It is understandable that pedestrians will perceive only a range of traffic
density in place of a particular density value
Conclusion This study is useful to those engineers and scientists who would like to
simulate crossing time of pedestrians at an uncontrolled mid block section of a
‐
road with heterogeneous and non lane based vehicular
‐ traffic.
Cont.. 2
8
7.
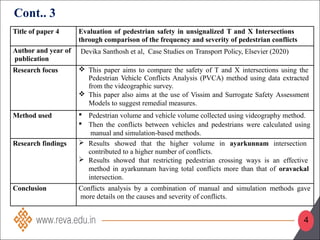
Title of paper4 Evaluation of pedestrian safety in unsignalized T and X Intersections
through comparison of the frequency and severity of pedestrian conflicts
Author and year of
publication
Devika Santhosh et al, Case Studies on Transport Policy, Elsevier (2020)
Research focus This paper aims to compare the safety of T and X intersections using the
Pedestrian Vehicle Conflicts Analysis (PVCA) method using data extracted
from the videographic survey.
This paper also aims at the use of Vissim and Surrogate Safety Assessment
Models to suggest remedial measures.
Method used Pedestrian volume and vehicle volume collected using videography method.
Then the conflicts between vehicles and pedestrians were calculated using
manual and simulation-based methods.
Research findings Results showed that the higher volume in ayarkunnam intersection
contributed to a higher number of conflicts.
Results showed that restricting pedestrian crossing ways is an effective
method in ayarkunnam having total conflicts more than that of oravackal
intersection.
Conclusion Conflicts analysis by a combination of manual and simulation methods gave
more details on the causes and severity of conflicts.
Cont.. 3
4
8.
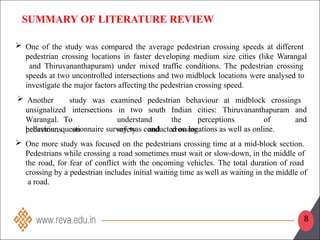
SUMMARY OF LITERATUREREVIEW
One of the study was compared the average pedestrian crossing speeds at different
pedestrian crossing locations in faster developing medium size cities (like Warangal
and Thiruvananthapuram) under mixed traffic conditions. The pedestrian crossing
speeds at two uncontrolled intersections and two midblock locations were analysed to
investigate the major factors affecting the pedestrian crossing speed.
Another study was examined pedestrian behaviour at midblock crossings
and
and
unsignalized intersections in two south Indian cities: Thiruvananthapuram
Warangal. To understand the perceptions of
pedestrians on safety and crossing
behaviour, questionnaire survey was conducted on locations as well as online.
One more study was focused on the pedestrians crossing time at a mid block section.
‐
Pedestrians while crossing a road sometimes must wait or slow down, in the middle
‐ of
the road, for fear of conflict with the oncoming vehicles. The total duration of road
crossing by a pedestrian includes initial waiting time as well as waiting in the middle of
a road.
8
9.
RESEARCH GAPS
Pedestriangroup size and luggage were not included in one of the study on
pedestrian crossing behaviour at Warangal and Thiruvananthapuram.
One of the study says that the regression models thus obtained cannot be directly
used if number of lanes of the road and pedestrians are different than the one studied
here.
One of the study on pedestrian safety suggests that “Study the severity of conflicts by
a simulation-based technique alone.
9
10.
OBJECTIVES
1. Analysis andcomparison of average pedestrian crossing speeds at different
pedestrian crossing locations at BSF Junction.
2. Evaluation of major factors like crossing speed, crossing time, pedestrian volume(w.r.t
age and gender) affecting road crossing behaviour of pedestrians under mixed traffic
conditions
3. Assessment and interpretation of pedestrian movement factors through statistical
analysis methods.
11
1. Identification ofstudy area
2. As per methodology we were continuing the project with different surveys which
are required for analysis
• Traffic Volume study
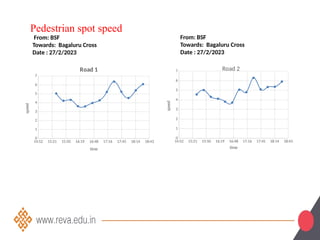
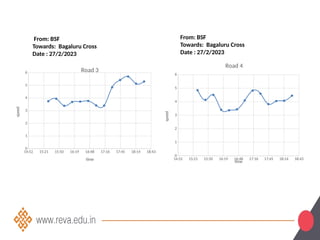
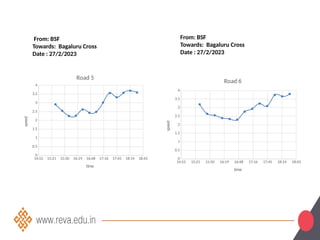
• Pedestrian spot speed
• Pedestrian speed survey
PROGRESS TILL NOW….
13.
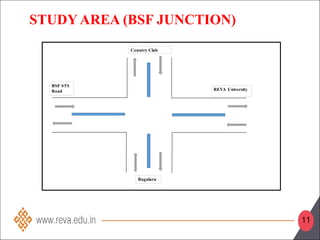
STUDY AREA (BSFJUNCTION)
11
BSF STS
Road REVA University
Country Club
Bagaluru
14.
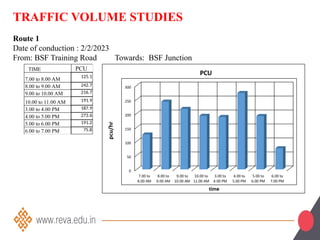
TRAFFIC VOLUME STUDIES
Route1
Date of conduction : 2/2/2023
From: BSF Training Road Towards: BSF Junction
TIME PCU
7.00 to 8.00 AM
125.1
8.00 to 9.00 AM 242.7
9.00 to 10.00 AM 216.7
10.00 to 11.00 AM 191.9
3.00 to 4.00 PM 187.9
4.00 to 5.00 PM 273.6
5.00 to 6.00 PM 191.2
6.00 to 7.00 PM 75.8
15.
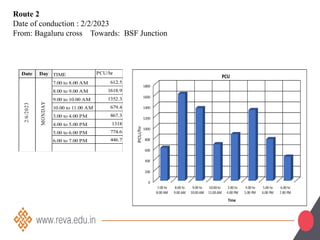
Route 2
Date ofconduction : 2/2/2023
From: Bagaluru cross Towards: BSF Junction
Date Day TIME PCU/hr
7.00 to 8.00 AM 612.5
8.00 to 9.00 AM 1618.9
9.00 to 10.00 AM 1352.3
10.00 to 11.00 AM 679.4
3.00 to 4.00 PM 867.3
4.00 to 5.00 PM 1318
5.00 to 6.00 PM 774.6
6.00 to 7.00 PM 446.7
2/6/2023
MON
DAY
16.
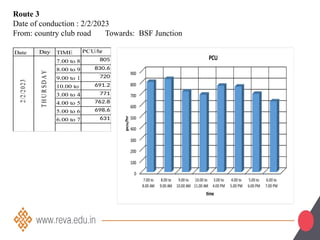
Route 3
Date ofconduction : 2/2/2023
From: country club road Towards: BSF Junction
Date Day TIME PCU/hr
7.00 to 8.00 AM
805
8.00 to 9.00 AM
830.6
9.00 to 10.00 AM
720
10.00 to 11.00 AM
691.2
3.00 to 4.00 PM771
4.00 to 5.00 PM
762.8
5.00 to 6.00 PM
698.6
6.00 to 7.00 PM631
2
/2
/2
0
2
3
T
H
U
R
S
D
A
Y
17.
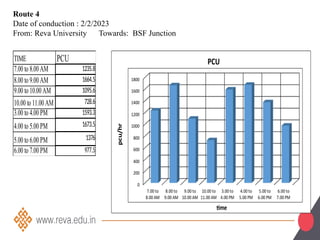
Route 4
Date ofconduction : 2/2/2023
From: Reva University Towards: BSF Junction
TIME PCU
7.00 to 8.00AM 1235.8
8.00 to 9.00AM 1664.5
9.00 to 10.00AM 1095.6
10.00 to 11.00AM 728.6
3.00 to 4.00 PM 1593.3
4.00 to 5.00 PM 1673.5
5.00 to 6.00 PM 1376
6.00 to 7.00 PM 977.5
1. Govinda, L.,Abhigna, D., Nair, P. M., & Shankar, K. R. (2020). Comparative study of pedestrian
crossing behaviour at uncontrolled intersection and midblock locations. Transportation research
procedia, 48, 698-706
2. Ravishankar, K. V. R., & Nair, P. M. (2018). Pedestrian risk analysis at uncontrolled midblock
and unsignalised intersections. Journal of traffic and transportation engineering (English
edition), 5(2), 137-147.
3. Agarwal, S., & Vikram, D. (2021). Impact of vehicular traffic stream on pedestrian crossing
behavior at an uncontrolled mid-block section. Transportation research interdisciplinary
perspectives, 9, 100298.
4. Santhosh, D., Bindhu, B. K., & Koshy, B. I. (2020). Evaluation of pedestrian safety in
unsignalized T and X–Intersections through comparison of the frequency and severity of
pedestrian conflicts. Case studies on transport policy, 8(4), 1352-1359.
REFERENCES


![Rotary_Roundabout_Sams_03.12.14 [Compatibility Mode].pdf](https://cdn.slidesharecdn.com/ss_thumbnails/rotaryroundaboutsams03-250423055821-6dd85e6b-thumbnail.jpg?width=640&height=640&fit=bounds)
![Origin-Destn Survey [Compatibility Mode].pdf](https://cdn.slidesharecdn.com/ss_thumbnails/o-dsurveycompatibilitymode-250423053753-1b143592-thumbnail.jpg?width=640&height=640&fit=bounds)


