Download to read offline
![International Research Journal of Engineering and Technology (IRJET) e-ISSN: 2395-0056
Volume: 06 Issue: 04 | Apr 2019 www.irjet.net p-ISSN: 2395-0072
© 2019, IRJET | Impact Factor value: 7.211 | ISO 9001:2008 Certified Journal | Page 4521
PEDESTRIAN RISK ANALYSIS AT UNCONTROLLED MIDBLOCK
Prof: Bybin Paul1, Mohamed Fayiz2, Naseef Ahamed V3, Sudharsana A4, Archana C5
1Assistant Professor, Dept. of Civil Engineering, Mar Athanasius College of Engineering, Kerala, India
2,3,4,5Student, Dept. of Civil Engineering, Mar Athanasius College of Engineering, Kerala, India
---------------------------------------------------------------------***----------------------------------------------------------------------
Abstract - Traffic controls andspaceallocationsaregenerally
biased towards vehicular trafficandpedestriansrequirements
are not given due consideration. One of the most hazardous
locations for a person to cross is at uncontrolled midblock. In
such locations, pedestrians need to search for adequate
vehicular gaps to cross safely. Pedestrian adopts a different
behaviour pattern than expected in this situation causing
confusion to fatal accidents during theendeavour. Objectiveof
this study is to find out whichever behavioural and
demographic factors influence the risk and adopt the safest
behaviours while crossing at midblock.
Key Words: Pedestrian risk analysis, Road crossing,waiting
time, Risk analysis, Interruption, Rolling gap.
1. INTRODUCTION
Transportation is defined as the transfer of person or goods
from one point to another by a medium which can be a
vehicle or a person. One of the most accessible modes of
transportation is road transportation. Once constructed for
the safe transport of pedestrians, it is currently fully
overtaken by vehicles.Consequently,thisputspedestriansin
a dangerous position of having given the least amount of
consideration during the design of roads.
Pedestrians either move along the road or across the road,
casually known as a road crossing, to get from A to B. The
latter movement is the problematic one, because of its
interference with ongoing traffic. It is also influenced by
several factors and conditions, accordingly, making it a
behavior having a high potential for accidents, as much as
driving.
One of the most hazardous locations for a person to cross is
at uncontrolled midblocks. Uncontrolled mid-block
pedestrian crossings aremarkedcrosswalksplacedbetween
intersections which are not controlled by any traffic police
personnel. The second Global Report on Road safety shared
that, globally, pedestrians constitute 22% of all road deaths
and in some countries; this proportion is as high as two
thirds. Moreover, millions of people are injured in traffic-
related crashes while walking, some of whom become
permanently disabled.
The data show that on an average day 1324 accidents occur
on Indian roads leading to the death of 349 people. This
means 55 accidents and 15 lives lost per hour. In other
words, a life lost every four minutes.
In Kerala; it was found that there is a 20% increase in road
accidents and injuries compared to the year 2015. Although
rash and drunk driving are the leading cause of these
fatalities and non-fatal injuries, lack of pedestrian
infrastructures and poor urban planning also puts
pedestrians at risk.
1.1 Need for Study
With a population of 601,574 as of 2011, the city of
Ernakulam has Kerala's second highest population density
parameter with 6340 people per km. As the population
increases, their need to commute to different locations have
increased many times. The accident rate in the city is
reportedly on the rise. Out of 2451 accident cases registered
in 2018 in the city, 140 caseswere fatal and around2451had
non-fatality injuries. The study aims to identify different
factors which may influencethebehaviourofpedestriansand
their risk and relations. By identifying these factors and
relations, safest behaviour traits that can be adopted during
crossing can be adopted.
1.2 Objectives
• To qualitatively and quantitatively assess the road
crossing conditions.
• To find the effect of gender, age, companions,
vehicles and other external factors on the road
crossing behavior.
• To give pointers to pedestrians and drivers on the
safest behaviors that could be adopted during the
midblock crossing.
2. LITERATURE REVIEW
Public transportation influences pedestriansafety.Crossings
located close to bus stops, or bus way systems, experience
higher pedestrian crash rates[1]. The speedofthepedestrian
was found to be influenced by the age and gender. Male
pedestriansmovefasterthanfemalepedestrians.Pedestrians
in the age group of 10–15 years had the highest speed, 82
m/min. The speed was reduced by about 85% when
pedestrians move with their baggage as friction increases
with weight[2].
Pedestrians preferred safe to short paths and they crossed
second half of the road with significantly higher speed. In
terms of safety, pedestrians who were middle aged; involved
in bigger groups, looked at vehicles more often before
crossing or interacted with buses rather than cars weresafer](https://image.slidesharecdn.com/irjet-v6i4984-190724053104/85/IRJET-Pedestrian-Risk-Analysis-at-Uncontrolled-Midblock-1-320.jpg)
![International Research Journal of Engineering and Technology (IRJET) e-ISSN: 2395-0056
Volume: 06 Issue: 04 | Apr 2019 www.irjet.net p-ISSN: 2395-0072
© 2019, IRJET | Impact Factor value: 7.211 | ISO 9001:2008 Certified Journal | Page 4521
PEDESTRIAN RISK ANALYSIS AT UNCONTROLLED MIDBLOCK
Prof: Bybin Paul1, Mohamed Fayiz2, Naseef Ahamed V3, Sudharsana A4, Archana C5
1Assistant Professor, Dept. of Civil Engineering, Mar Athanasius College of Engineering, Kerala, India
2,3,4,5Student, Dept. of Civil Engineering, Mar Athanasius College of Engineering, Kerala, India
---------------------------------------------------------------------***----------------------------------------------------------------------
Abstract - Traffic controls andspaceallocationsaregenerally
biased towards vehicular trafficandpedestriansrequirements
are not given due consideration. One of the most hazardous
locations for a person to cross is at uncontrolled midblock. In
such locations, pedestrians need to search for adequate
vehicular gaps to cross safely. Pedestrian adopts a different
behaviour pattern than expected in this situation causing
confusion to fatal accidents during theendeavour. Objectiveof
this study is to find out whichever behavioural and
demographic factors influence the risk and adopt the safest
behaviours while crossing at midblock.
Key Words: Pedestrian risk analysis, Road crossing,waiting
time, Risk analysis, Interruption, Rolling gap.
1. INTRODUCTION
Transportation is defined as the transfer of person or goods
from one point to another by a medium which can be a
vehicle or a person. One of the most accessible modes of
transportation is road transportation. Once constructed for
the safe transport of pedestrians, it is currently fully
overtaken by vehicles.Consequently,thisputspedestriansin
a dangerous position of having given the least amount of
consideration during the design of roads.
Pedestrians either move along the road or across the road,
casually known as a road crossing, to get from A to B. The
latter movement is the problematic one, because of its
interference with ongoing traffic. It is also influenced by
several factors and conditions, accordingly, making it a
behavior having a high potential for accidents, as much as
driving.
One of the most hazardous locations for a person to cross is
at uncontrolled midblocks. Uncontrolled mid-block
pedestrian crossings aremarkedcrosswalksplacedbetween
intersections which are not controlled by any traffic police
personnel. The second Global Report on Road safety shared
that, globally, pedestrians constitute 22% of all road deaths
and in some countries; this proportion is as high as two
thirds. Moreover, millions of people are injured in traffic-
related crashes while walking, some of whom become
permanently disabled.
The data show that on an average day 1324 accidents occur
on Indian roads leading to the death of 349 people. This
means 55 accidents and 15 lives lost per hour. In other
words, a life lost every four minutes.
In Kerala; it was found that there is a 20% increase in road
accidents and injuries compared to the year 2015. Although
rash and drunk driving are the leading cause of these
fatalities and non-fatal injuries, lack of pedestrian
infrastructures and poor urban planning also puts
pedestrians at risk.
1.1 Need for Study
With a population of 601,574 as of 2011, the city of
Ernakulam has Kerala's second highest population density
parameter with 6340 people per km. As the population
increases, their need to commute to different locations have
increased many times. The accident rate in the city is
reportedly on the rise. Out of 2451 accident cases registered
in 2018 in the city, 140 caseswere fatal and around2451had
non-fatality injuries. The study aims to identify different
factors which may influencethebehaviourofpedestriansand
their risk and relations. By identifying these factors and
relations, safest behaviour traits that can be adopted during
crossing can be adopted.
1.2 Objectives
• To qualitatively and quantitatively assess the road
crossing conditions.
• To find the effect of gender, age, companions,
vehicles and other external factors on the road
crossing behavior.
• To give pointers to pedestrians and drivers on the
safest behaviors that could be adopted during the
midblock crossing.
2. LITERATURE REVIEW
Public transportation influences pedestriansafety.Crossings
located close to bus stops, or bus way systems, experience
higher pedestrian crash rates[1]. The speedofthepedestrian
was found to be influenced by the age and gender. Male
pedestriansmovefasterthanfemalepedestrians.Pedestrians
in the age group of 10–15 years had the highest speed, 82
m/min. The speed was reduced by about 85% when
pedestrians move with their baggage as friction increases
with weight[2].
Pedestrians preferred safe to short paths and they crossed
second half of the road with significantly higher speed. In
terms of safety, pedestrians who were middle aged; involved
in bigger groups, looked at vehicles more often before
crossing or interacted with buses rather than cars weresafer](https://image.slidesharecdn.com/irjet-v6i4984-190724053104/75/IRJET-Pedestrian-Risk-Analysis-at-Uncontrolled-Midblock-1-2048.jpg)
![International Research Journal of Engineering and Technology (IRJET) e-ISSN: 2395-0056
Volume: 06 Issue: 04 | Apr 2019 www.irjet.net p-ISSN: 2395-0072
© 2019, IRJET | Impact Factor value: 7.211 | ISO 9001:2008 Certified Journal | Page 4522
while those running were more dangerous [3]. 10.6% of
middle aged pedestrians are more likely to have irregular
crossing than youth and older pedestrians. It was also found
out that male pedestrians are 38.6% more likely to show
rolling gap behavior and 75.2% more likely to observe
running behavior. Analysis of behavior based on the size of
vehicles shows that pedestrians accepting gaps of buses are
likely to run in crossing at mid blocks
3. METHODOLOGY
Data for the study were collected in Ernakulam city during
the months ofFebruary and March of 2019. The videography
survey was done at morningand evening peakhoursfroman
elevated position at22selectedlocations.Therecordedvideo
was extracted using VLC Player with frame by frame
playback. In every 30 milliseconds, behaviors of the
pedestrian were analyzed manually.
The data includes different detailsaboutapedestrianand
the crossing behavior, including the age, gender, way of
crossing, vehicle gap acceptance, group effect etc.
Pedestrians were divided into four age groups based on
their visual appearance.
1. Child/Teen
2. Youth
3. Middle-aged
4. Elder
Other data extracted includes
1. Whether or not the pedestrian show running
behavior
2. Whether the pedestrian was in a group
3. The pattern of movement
4. Type of vehicles for which the pedestrians cross
5. Crossing time
6. Waiting time
7. Whetherornotthepedestriansfullycrossedthrough
the marked crosswalks.
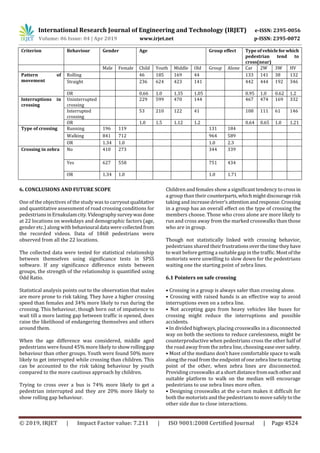
The crossing speeds of the pedestrians were found out from
the road widthand the crossing timefrom the timeline of the
media player. Collected data is shown in Table-1.
OBSERVED DATA NUMBER OF PEDESTRIANS OBSERVED PERCENTAGE (%)
GENDER
1.Male
2.Female
1037
831
55.52
44.48
AGE GROUP
1.Child
2.Youth
3.Middle aged
4.Elder
303
859
616
191
15.4
43.6
31.4
9.7
BEHAVIOUR
1.Walk
2.Run
1553
315
83.1
16.9
GROUP OR NOT
1.Alone
2.Group
773
315
41.4
58.6
PATTERN OF MOVEMENT
1.Straight
2.Rolling
1424
444
76.2
23.8
INTERRUPTIONS IN CROSSING
1.Interrupted
2.Uninterrupted
426
1442
22.8
77.2
TYPE OF VEHICLE FOR WHICH
PEDESTRIANS CROSS
1. Car
2. Two Wheeler
3. Three Wheeler
4. Heavy Vehicles/ Bus
575
583
230
478
30.8
31.2
12.3
25.7
CROSSING IN ZEBRA
1.Yes
2.No
1185
683
63.4
36.6](https://image.slidesharecdn.com/irjet-v6i4984-190724053104/85/IRJET-Pedestrian-Risk-Analysis-at-Uncontrolled-Midblock-2-320.jpg)
![International Research Journal of Engineering and Technology (IRJET) e-ISSN: 2395-0056
Volume: 06 Issue: 04 | Apr 2019 www.irjet.net p-ISSN: 2395-0072
© 2019, IRJET | Impact Factor value: 7.211 | ISO 9001:2008 Certified Journal | Page 4525
REFERENCES
[1] Mara Chagas Diogenes and Luis Antonio Linda, 2010 -
Evaluation of pedestrian safety at midblock crossings.
[2] KotkarKishorLaxman, RajatRastogi,andSatish, 2010 -
Pedestrian Flow Characteristics in Mixed Traffic
Conditions.
[3] ZhuangX, 2011- Safety margin and perceived safety of
pedestrians at unmarked roadway.
[4] KodavantiVenkataRaghavendraRavishankar,ParvathyM
aheswari Nair, the 2017-pedestrian risk atuncontrolled
midblock and unsignalized intersections.](https://image.slidesharecdn.com/irjet-v6i4984-190724053104/85/IRJET-Pedestrian-Risk-Analysis-at-Uncontrolled-Midblock-5-320.jpg)

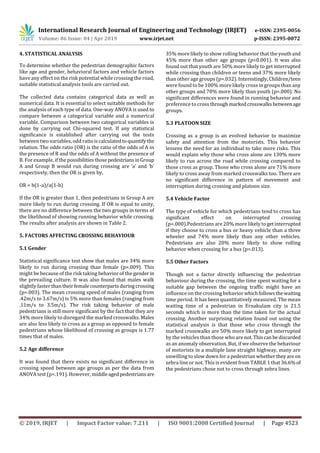
This study analyzed pedestrian behavior and risk factors at uncontrolled midblock crossings in Ernakulam, India. Over 1,800 pedestrian crossings were observed and data was collected on demographics, behaviors, waiting times, and other factors. Statistical analysis found that males and middle-aged pedestrians engaged in riskier behaviors like running across streets. Pedestrians waiting for buses or crossing alone also showed riskier behaviors. The study concluded with recommendations for safer crossing behaviors like crossing in groups or not accepting gaps from buses. Future studies could explore improving pedestrian infrastructure and driver yielding behavior.


