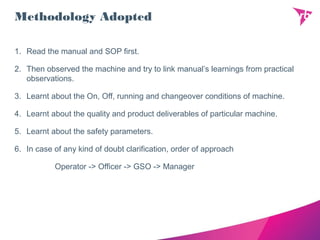
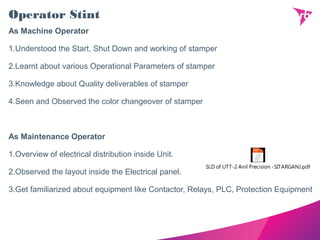
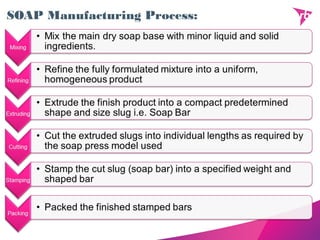
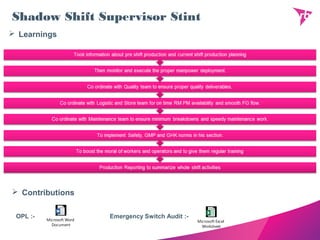
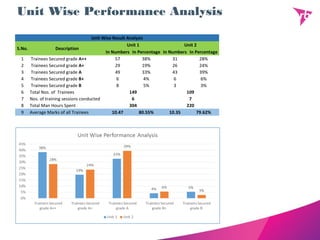
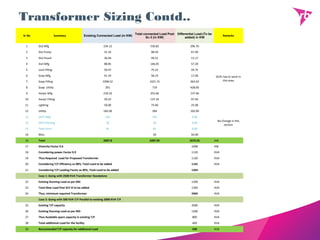
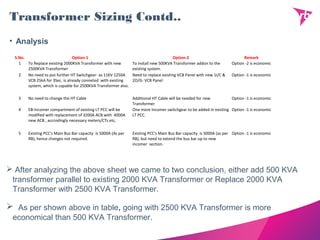
Amritanshu Kumar
(GET)
Training Guide: Anupam Sharma & Mahip Srivastava
Plant : Sitarganj
Mid-Year Review
Methodology Adopted
1. Read the manual and SOP first.
2. Then observed the machine and try to link manual’s learnings from practical
observations.
3. Learnt about the On, Off, running and changeover conditions of machine.
4. Learnt about the quality and product deliverables of particular machine.
5. Learnt about the safety parameters.
6. In case of any kind of doubt clarification, order of approach
Operator -> Officer -> GSO -> Manager
Operator Stint
As Machine Operator
1.Understood the Start, Shut Down and working of stamper
2.Learnt about various Operational Parameters of stamper
3.Knowledge about Quality deliverables of stamper
4.Seen and Observed the color changeover of stamper
As Maintenance Operator
1.Overview of electrical distribution inside Unit.
2.Observed the layout inside the Electrical panel.
3.Get familiarized about equipment like Contactor, Relays, PLC, Protection Equipment
SLD of UTT-2 Anil Precision -SITARGANJ.pdf
SOAP Manufacturing Process:
Shadow Shift Supervisor Stint
Microsoft Word
Document
Microsoft Excel
Worksheet
 Learnings
 Contributions
OPL :- Emergency Switch Audit :-
LOTO Training Board (In Unit 2)
Physical demonstration of various types of LOTO to increase safety
awareness among operators and unskilled manpower.
Amritanshu Kumar
(GET)
Mentor: K.N. Jha
Guide: Mahip Srivastava
Glimpse Of LOTO Training
About Training
• Training consist of interactive session on LOTO System followed by examination
on that session.
• About Interactive Session
 To share information about importance of LOTO, How to do LOTO in correct
way, Types of LOTO through interactive videos and pictures.
 To make them realize to make safety behavioral (BBS) and linked safety to day
to day activities.
•About Examination
 Interactive session was followed by descriptive examination to test level of
understanding of all trainees.
On the basis of examination analysis was done which is shown in further slides.
Training Analysis
Rating Remarks
A++ Excellent (91-100%)
A+ Very Good (81-90%)
A Good (61-80%)
B+ Fair (51-60%)
B Req. Improvement (< 50%)
Overall Site Result Analysis
S.No. Description In Numbers In Percentage
1 Trainees Secured grade A++ 88 34%
2 Trainees Secured grade A+ 55 21%
3 Trainees Secured grade A 92 36%
4 Trainees Secured grade B+ 12 5%
5 Trainees Secured grade B 11 4%
6 Total Nos of Trainees (Distinct) 258
7 Total Man Hours Spent (Distinct) 516
8 Total Man Hours Spent 524
9 Average Marks of all Trainees 10.42 80.16%
Microsoft Excel
Worksheet
Unit Wise Performance Analysis
Unit Wise Result Analysis
S.No. Description
Unit 1 Unit 2
In Numbers In Percentage In Numbers In Percentage
1 Trainees Secured grade A++ 57 38% 31 28%
2 Trainees Secured grade A+ 29 19% 26 24%
3 Trainees Secured grade A 49 33% 43 39%
4 Trainees Secured grade B+ 6 4% 6 6%
5 Trainees Secured grade B 8 5% 3 3%
6 Total Nos. of Trainees 149 109
7 Nos. of training sessions conducted 6 7
8 Total Man Hours Spent 304 220
9 Average Marks of all Trainees 10.47 80.55% 10.35 79.62%
Training Visuals
Interactive
Session
Examination
Session
Operator Response to Training
Feedback from Operators (In Percentage)
Very Good Good Average Poor Very Poor
63.3% 35.8% 0.9% 0.0% 0.0%
• Learnings
Planning along with GSO’s regarding organization of training at such a mass scale.
Direct interaction with Operators and to know their views on safety.
Great platform to nourish your leadership quality.
Outcomes Of Training
• Issues raised by Operators
 Fork Lift operations to be stopped during shift change.
To provide safety shoes to all skilled contractual operators and hand trolley
handling manpower.
Ambiguity in Operator’s mind about SBO Card analysis.
To take adequate safety measures during housekeeping activities like putting
caution board.
•Positive Outcomes
 Group LOTO Box implementation in both the units.
 Increased safety and LOTO awareness among operators.
 Operators getting more than 90% marks should be made Safety Champs
section wise and they should encourage safety in their sections.
Shadow Quality Supervisor Stint
 Sampling Process of RM & PM.
 Knowledge about AR No. Generation.
 Bulk Manufacturing Check analysis
 Importance of IPQC Check
 Finished good KPI check analysis.
 AQL of RM-PM and FG
Shadow General Supervisor Stint
 Learnings
 Brief Understanding of Production Planning.
 RM & PM stock optimization.
 Finished Goods cost optimization.
 Machine Management
 Contribution
 Have Made Electrical Log Book to smoothen the existing process.
Electrical Log Book
 Merge the three log books into one.
 All major electrical and Utilities under one Log Book.
 Easy to fill, analyze and check the data.
 Easier for Maintenance Officer to monitor and track down the maintenance
activities.
Microsoft Excel
97-2003 Worksheet
SCE III-Projects
Project Mentor : Mahip Srivastava
Project Guide : Venus Dhuria
UPS Sizing
Transformer Re-Sizing
Normalization and preparing Techno-Commercial Sheets
like of Super Chiller, Process Chiller
UPS Sizing
• Benefits of UPS Installation
 Regulated Constant Power Supply to critical equipment like PLC, HMI.
 Frequency of Breakdowns get decreased.
 Average life of critical equipment get increased.
 Convenient and Early Start UP of equipment like HMI, Ink Jet Printers.
• Current Status of UPS Supply inside plant
 16 UPS and Inverter in total of 48 KVA providing supply to Emergency Lights,
Soap's Stamper, Veet’s interlock door, Ink Jet Printer, etc..
 Control Supply of entire Liquid Section & some section of Soap & Veet is not
under UPS Supply.
UPS Sizing Cont.…
• Processes Involved
• Techno Commercial Sheet Preparation :-
 Keeping in mind about further expansion of unit and to ensure better UPS life, we
decided to go for 2 UPS of 40 KVA each.
 We selected APC Schneider, Emerson Network & Riello PCI as our vendors and
after normalization prepared the Techno Commercial Sheet.
Single phase apparent power 29.2 KVA
Three phase apparent power 53.9 KVA
Total apparent Power 83.1 KVA
Considering Diversity Factor as 0.6,Min Capacity of UPS 49.9 KVA
Proposed UPS 60.0 KVA
Microsoft Excel
97-2003 Worksheet
Microsoft Excel
Worksheet
UPS Sizing Cont.…
• Learnings
 Knowledge about Electrical Distribution inside Plant.
 Knowledge about URS and its benefits.
 Normalization and Techno Commercial Sheet Making process.
• Outcomes
 Finally after negotiation from NPS team, we go with Riello PCI.
 Learnings from this project & Basic knowledge regarding Normalization help me in
finalizing vendors & making Techno Commercial Sheet of Soap’s Super Chiller and
Process Chiller.
Microsoft Excel
97-2003 Worksheet
Microsoft Excel
97-2003 Worksheet
Transformer Sizing
• Need for Resizing Transformer
 Because of SCE-3, New Lines like Ronchi Line, one line in Soap, Three lines in
DLS and one high speed line in Lizol are to be installed.
 Thus, Load of Unit 2 will increase Substantially. Hence, Transformer Resizing of
our Unit was necessary.
• Methodology Adopted
 Studied the existing load of Unit 2 and estimated the total load post SCE III.
 On that basis find out the net differential load to be added after SCE III which
help us in resizing of transformer.
Microsoft Excel
Worksheet
Transformer Sizing Contd..
Sr No Summary Existing Connected Load (in KW)
Total connected Load Post
Sc-3 (in KW)
Differential Load-(To be
added) in KW
Remarks
1 DLS Mfg 234.12 530.82 296.70
DCPL has to work in
this area
2 DLS Pump 31.19 98.59 67.40
3 DLS Pouch 36.04 49.21 13.17
4 lizol Mfg 88.85 146.05 57.20
5 Lizol Filling 50.47 75.22 24.75
6 Soap Mfg 41.19 58.19 17.00
7 Soap Filling 1058.52 1421.15 362.63
8 Soap Utility 291 719 428.00
9 Harpic Mfg 218.20 355.66 137.46
10 Harpic Filling 39.22 137.16 97.94
11 Lighting 50.00 75.00 25.00
12 Utility 182.00 284 102.00
13 VEET Mfg 156 156 0.00
No Change in this
section
14 VEET Packing 50 50 0.00
15 Tank Farm 81 81 0.00
16 Misc. 50 50.00
16 Total 2607.8 4287.05 1679.25 KW
17 Diversity Factor 0.6 1008 KW
18 Considering power Factor 0.9 1120 KVA
19 Thus Required Load for Proposed Transformer 1120 KVA
20 Considering T/F Efficiency as 98%, Total Load to be added 1142 KVA
21 Considering T/F Loading Factor as 90%, Total Load to be added 1269
Case 1: Going with 2500 KVA Transformer Standalone
22 Existing Running Load as per MD 1200 KVA
23 Total New Load Post SCE III to be added 1269 KVA
24 Thus, minimum required Transformer 2469 KVA
Case 2: Going with 500 KVA T/F Parallel to existing 2000 KVA T/F
25 Existing T/F capacity 2000 KVA
26 Existing Running Load as per MD 1200 KVA
27 Thus Available spare capacity in existing T/F 800 KVA
28 Total additional Load for the facility 469 KVA
29 Reccomended T/F capacity for additional Load 500 KVA
Transformer Sizing Contd..
• Analysis
S.No. Option-1 Option-2 Remark
1 To Replace existing 2000KVA Transformer with new
2500KVA Transformer
To install new 500KVA Transformer addon to the
existing system.
Option -2 is economic
2 No need to put further HT Switchgear- as 11KV 1250A
VCB 25kA for 3Sec. is already conneted with existing
system, which is capable for 2500KVA Transformer also.
Need to replace existing VCB Panel with new 1I/C &
2O/G- VCB Panel
Option -1 is economic
3 No need to change the HT Cable Additional HT Cable will be needed for new
Transformer
Option -1 is economic
4 EB-Incomer compartment of existing LT PCC will be
modified with replacement of 3200A ACB with 4000A
new ACB , accrodingly necessary meters/CTs etc,
One more Incomer switchgear to be added in existing
LT PCC.
Option -1 is economic
5 Existing PCC's Main Bus Bar capacity is 5000A (As per
RB), hence changes not required.
Existing PCC's Main Bus Bar capacity is 5000A (as per
RB), but need to extend the bus bar up to new
incomer section.
Option -1 is economic
 After analyzing the above sheet we came to two conclusion, either add 500 KVA
transformer parallel to existing 2000 KVA Transformer or Replace 2000 KVA
Transformer with 2500 KVA Transformer.
 As per shown above in table, going with 2500 KVA Transformer is more
economical than 500 KVA Transformer.
Transformer Sizing Contd..
• Outcomes
 After all analysis, we decided to go with 2500 KVA Transformer.
 PCC Modification work need to be executed and work on it have been started.
• Learnings
 Knowledge about existing connected load in Unit 2.
 Knowledge about new loads to be connected post SCE III
Energy Saving’s Project
Project Mentor : Mahip Srivastava
Project Guide : Varun Rai
Training on Energy Conservation
 Audit on Energy Conservation
 Load Factor Analysis to reduce Electricity Bill
 Automation of Auto Carton machine: An example of Energy
Conservation
Energy Conservation
• Awareness among employees
 Training related energy conservation must be organized in planned manner.
 Just like safety, emphasis on making energy conservation behavioral
 To boost moral of operators energy conservation related posters, banners and
reward policy must be adopted.
• Energy Conservation Audit
 To know our loop holes and various front where we are lagging energy
conservation audit is a must done activity.
 All necessary activities like finding vendors, filling forms, preparing comparing
sheet have been completed and we are going with CII for energy audit.
 Only formalities like vendor registration and raising PO is left and we are planning
to conduct audit very soon.
Microsoft Excel
Worksheet
Load Factor Analysis
• Current Scenario
 RB both units receive 11 KV power from UPCL.
 Contract load of UTT 1 & 2 is 1500 KVA & 1000 KVA respectively. Steps have
taken to increase contract load of UTT 1 to 1500 KVA.
 At present, electricity bill of each unit is about Rs 20-22 lakhs per month.
• Understanding the Electricity Bill
 UPCL tariffs consist of fixed demand charges, energy consumption charges and
electricity duty.
 Fixed demand charge is calculated on billed demand. Billed demand would be
actual maximum demand or 80 % of contract demand which ever is higher.
Fixed Demand Charges for Unit-1 & Unit-2 is Rs. 210 / KVAH & Rs. 270 / KVAH
respectively.
 Electricity duty is 25 paisa/ KVAH.
Load Factor Analysis Contd..
 Energy consumption charges on KVAH depend on load factor which deemed to
be calculated as :-
Load Factor (%) =
 UPCL Tariff schedule and TOD is as follows :-
Energy Consumption during the billing period X 100
Max Demand X No. of hours in this billing period
Load Factor %
Morning Peak
Hours (Rs./
KVAH)
Normal Hours
(Rs./ KVAH
Evening Hours
(Rs./ KVAH)
Off-Peak Hours
(Rs./ KVAH)
Upto 33 % 5.40 3.00 5.40 2.73
Above 33 %
and Upto 50 %
5.40 3.30 5.40 2.99
Above 50 % 5.40 3.60 5.40 3.24
Season/ Time
Of Day
Morning Peak
Hours (Rs./
KVAH)
Normal Hours
(Rs./ KVAH
Evening Peak
Hours (Rs./
KVAH
OFF Peak Hours
(Rs./ KVAH
Winter 01.10 to
31.03
06:00-09:30 09:30-17:30 17:30-22:00 22:00-06:00
Summer 01.4
to 30.09
---- 07:00-18:00 18:00-23:00 23:00-07:00
Load Factor Analysis Contd..
Sample Electricity Bill of Nov. 2014 of Unit 2 :-
Comparison of Units rates of Jan 2012 & Feb 2012 Electricity Bills
of Unit 2 :-
Sample Electricity Bill.pdf
Comparison bw jan_12 & feb_12 elec bill.pdf
Load Factor Analysis Contd..
• Methodology
 Now to bring Load Factor below 50% any of following three methods can be
implemented:
1.By Increasing the Maximum Demand to desired level
2.By decreasing the energy consumption during the billing period to desired level.
3.Using combination of above two methods.
Method 1. ( Increasing MD )
 Net Savings by getting Load Factor below 50% through increasing MD is as
follows:
Yearly Net Cost Savings in Rs.-UTT 1 1124944.75
Yearly Net Cost Savings in Rs.-UTT 2 1041023.77
Total Saving in Rs. of Whole Site 2165968.52
Monthly Cost Savings in Rs.-UTT 1 93745.40
Monthly Cost Savings in Rs.-UTT 2 86751.98
Monthly Total Saving in Rs. of Whole Site 180497.38
Microsoft Excel
Worksheet
Load Factor Analysis Contd..
 Load Factor Analysis and Desired MD of past three years was analyzed.
 Maximum Demand is noted by Energy Meter in every 20 minutes and MD’s
sample having largest value in month is printed on electricity bill.
Load Factor Analysis Contd..
 Method 2 & 3. ( By Decreasing Energy Consumption or Combination of
Method 1 & 2)
 After Energy Audit and Energy Conservation Awareness Program we are hoping
that our energy consumption will get reduced by 10%.
 So net savings due to Load Factor Rebate + Savings from less energy
consumption is as follows :-
Yearly Net Cost Savings in Rs.-UTT 1 3198035.71
Yearly Net Cost Savings in Rs.-UTT 2 2966066.60
Total Saving in Rs. of Whole Site 6164102.31
Monthly Cost Savings in Rs.-UTT 1 266502.98
Monthly Cost Savings in Rs.-UTT 2 247172.22
Monthly Total Saving in Rs. of Whole Site 513675.19
Microsoft Excel
Worksheet
Load Factor Analysis Contd..
• Way Of Implementations
load factor.jpg
Execution
Load Factor Analysis Contd..
• Benefits of LF Rebate
 Payback period immediate as well as cost of implementation is too low or nil.
 Horizontal Replication in other RB’s Plant as well.
• Way Forward
 To lay more emphasis on use of renewable source of energy like instead of
using HSD in HWG and Steam Boiler use of Biomass.
 Use of solar panels for street lighting and Admin Block Lighting.(Sustainable &
CSR Activity)
 Effort towards maximizing automation and minimizing energy wastage on line.
Automation of Auto Carton Machine
 Earlier both conveyors of Auto Carton Machines were continuously running which
led to unnecessary wastage of electricity.
 So Automation was done on DLS Pouch Line in UTT 2.
Proximity
Sensor
Control box with
Start & Emergency
Button
Upper &
Lower
Conveyor
Automation of Auto Carton Machine
Contd..
• Working Principle
 As carton come in front of proximity sensor, proximity sensor sends signal to
timer.
 We have set delay time of 4 sec in timer which keep conveyor’s motor ON for
that much time.
Automation of Auto Carton Machine
Contd..
• Status of Implementation
 Successfully installed in DLS Pouch Line.
• Scope of Implementation
 All Soap and Veet lines, all Lizol Lines, DLS Pouch Line, Harpic Auto & Semi
Auto Lines.
• Payback Time : Immediate
• Cost of Implementation : Rs. 3000
Microsoft Excel
Worksheet
Motor Rating of Auto Cartnor Machine(2 in Nos.,0.25 Kw each) 0.5 Kw
Total Nos. of Auto Carton Machine 12 Nos.
Yearly energy consumption of all 12 Auto Carton Machines without automation 32460.16 KWH
Yearly energy consumption of all 12 Auto Carton Machines after automation 240.63 KWH
Yearly Energy Savings in terms of energy units 32219.53 KWH
Cost of 1 unit or 1 Kwh of energy 5 Rs
Yearly Total Savings in Rs. 161097.7 Rs
Independent Supervisor Stint
• Automation of Auto Carton Machine.
• Part of team working in Ronchi Machine Stabilization.
• Automation of Level Indicator in Harpic Mfg.(part of Ronchi Stabilization).
• Have imparted LOTO Safety training to operators of Unit 1 & Unit 2.
Level Indicator’s Automation In Harpic
Mfg.
 Need for LI Automation
 Ronchi Machine runs at constant pressure and thus Storage Tank can’t be
emptied completely.
 Takes around 30 minutes to Re Set the PID if air enters inside the Product Line
Pipe.
 Methodology Adopted
 Metal Proximity Sensor has been fitted on three storage tanks while level switch
on one.
 Separate visual indication for each tank along with common siren.
 PLC programing to control the automation.
Level Indicator’s Automation In Harpic
Mfg.
Thanks

Mid Year Review

  • 1.
    Amritanshu Kumar (GET) Training Guide:Anupam Sharma & Mahip Srivastava Plant : Sitarganj Mid-Year Review
  • 2.
    Methodology Adopted 1. Readthe manual and SOP first. 2. Then observed the machine and try to link manual’s learnings from practical observations. 3. Learnt about the On, Off, running and changeover conditions of machine. 4. Learnt about the quality and product deliverables of particular machine. 5. Learnt about the safety parameters. 6. In case of any kind of doubt clarification, order of approach Operator -> Officer -> GSO -> Manager
  • 3.
    Operator Stint As MachineOperator 1.Understood the Start, Shut Down and working of stamper 2.Learnt about various Operational Parameters of stamper 3.Knowledge about Quality deliverables of stamper 4.Seen and Observed the color changeover of stamper As Maintenance Operator 1.Overview of electrical distribution inside Unit. 2.Observed the layout inside the Electrical panel. 3.Get familiarized about equipment like Contactor, Relays, PLC, Protection Equipment SLD of UTT-2 Anil Precision -SITARGANJ.pdf
  • 4.
  • 5.
    Shadow Shift SupervisorStint Microsoft Word Document Microsoft Excel Worksheet  Learnings  Contributions OPL :- Emergency Switch Audit :-
  • 6.
    LOTO Training Board(In Unit 2) Physical demonstration of various types of LOTO to increase safety awareness among operators and unskilled manpower.
  • 7.
    Amritanshu Kumar (GET) Mentor: K.N.Jha Guide: Mahip Srivastava Glimpse Of LOTO Training
  • 8.
    About Training • Trainingconsist of interactive session on LOTO System followed by examination on that session. • About Interactive Session  To share information about importance of LOTO, How to do LOTO in correct way, Types of LOTO through interactive videos and pictures.  To make them realize to make safety behavioral (BBS) and linked safety to day to day activities. •About Examination  Interactive session was followed by descriptive examination to test level of understanding of all trainees. On the basis of examination analysis was done which is shown in further slides.
  • 9.
    Training Analysis Rating Remarks A++Excellent (91-100%) A+ Very Good (81-90%) A Good (61-80%) B+ Fair (51-60%) B Req. Improvement (< 50%) Overall Site Result Analysis S.No. Description In Numbers In Percentage 1 Trainees Secured grade A++ 88 34% 2 Trainees Secured grade A+ 55 21% 3 Trainees Secured grade A 92 36% 4 Trainees Secured grade B+ 12 5% 5 Trainees Secured grade B 11 4% 6 Total Nos of Trainees (Distinct) 258 7 Total Man Hours Spent (Distinct) 516 8 Total Man Hours Spent 524 9 Average Marks of all Trainees 10.42 80.16% Microsoft Excel Worksheet
  • 10.
    Unit Wise PerformanceAnalysis Unit Wise Result Analysis S.No. Description Unit 1 Unit 2 In Numbers In Percentage In Numbers In Percentage 1 Trainees Secured grade A++ 57 38% 31 28% 2 Trainees Secured grade A+ 29 19% 26 24% 3 Trainees Secured grade A 49 33% 43 39% 4 Trainees Secured grade B+ 6 4% 6 6% 5 Trainees Secured grade B 8 5% 3 3% 6 Total Nos. of Trainees 149 109 7 Nos. of training sessions conducted 6 7 8 Total Man Hours Spent 304 220 9 Average Marks of all Trainees 10.47 80.55% 10.35 79.62%
  • 11.
  • 12.
    Operator Response toTraining Feedback from Operators (In Percentage) Very Good Good Average Poor Very Poor 63.3% 35.8% 0.9% 0.0% 0.0% • Learnings Planning along with GSO’s regarding organization of training at such a mass scale. Direct interaction with Operators and to know their views on safety. Great platform to nourish your leadership quality.
  • 13.
    Outcomes Of Training •Issues raised by Operators  Fork Lift operations to be stopped during shift change. To provide safety shoes to all skilled contractual operators and hand trolley handling manpower. Ambiguity in Operator’s mind about SBO Card analysis. To take adequate safety measures during housekeeping activities like putting caution board. •Positive Outcomes  Group LOTO Box implementation in both the units.  Increased safety and LOTO awareness among operators.  Operators getting more than 90% marks should be made Safety Champs section wise and they should encourage safety in their sections.
  • 14.
    Shadow Quality SupervisorStint  Sampling Process of RM & PM.  Knowledge about AR No. Generation.  Bulk Manufacturing Check analysis  Importance of IPQC Check  Finished good KPI check analysis.  AQL of RM-PM and FG
  • 15.
    Shadow General SupervisorStint  Learnings  Brief Understanding of Production Planning.  RM & PM stock optimization.  Finished Goods cost optimization.  Machine Management  Contribution  Have Made Electrical Log Book to smoothen the existing process.
  • 16.
    Electrical Log Book Merge the three log books into one.  All major electrical and Utilities under one Log Book.  Easy to fill, analyze and check the data.  Easier for Maintenance Officer to monitor and track down the maintenance activities. Microsoft Excel 97-2003 Worksheet
  • 17.
    SCE III-Projects Project Mentor: Mahip Srivastava Project Guide : Venus Dhuria UPS Sizing Transformer Re-Sizing Normalization and preparing Techno-Commercial Sheets like of Super Chiller, Process Chiller
  • 18.
    UPS Sizing • Benefitsof UPS Installation  Regulated Constant Power Supply to critical equipment like PLC, HMI.  Frequency of Breakdowns get decreased.  Average life of critical equipment get increased.  Convenient and Early Start UP of equipment like HMI, Ink Jet Printers. • Current Status of UPS Supply inside plant  16 UPS and Inverter in total of 48 KVA providing supply to Emergency Lights, Soap's Stamper, Veet’s interlock door, Ink Jet Printer, etc..  Control Supply of entire Liquid Section & some section of Soap & Veet is not under UPS Supply.
  • 19.
    UPS Sizing Cont.… •Processes Involved • Techno Commercial Sheet Preparation :-  Keeping in mind about further expansion of unit and to ensure better UPS life, we decided to go for 2 UPS of 40 KVA each.  We selected APC Schneider, Emerson Network & Riello PCI as our vendors and after normalization prepared the Techno Commercial Sheet. Single phase apparent power 29.2 KVA Three phase apparent power 53.9 KVA Total apparent Power 83.1 KVA Considering Diversity Factor as 0.6,Min Capacity of UPS 49.9 KVA Proposed UPS 60.0 KVA Microsoft Excel 97-2003 Worksheet Microsoft Excel Worksheet
  • 20.
    UPS Sizing Cont.… •Learnings  Knowledge about Electrical Distribution inside Plant.  Knowledge about URS and its benefits.  Normalization and Techno Commercial Sheet Making process. • Outcomes  Finally after negotiation from NPS team, we go with Riello PCI.  Learnings from this project & Basic knowledge regarding Normalization help me in finalizing vendors & making Techno Commercial Sheet of Soap’s Super Chiller and Process Chiller. Microsoft Excel 97-2003 Worksheet Microsoft Excel 97-2003 Worksheet
  • 21.
    Transformer Sizing • Needfor Resizing Transformer  Because of SCE-3, New Lines like Ronchi Line, one line in Soap, Three lines in DLS and one high speed line in Lizol are to be installed.  Thus, Load of Unit 2 will increase Substantially. Hence, Transformer Resizing of our Unit was necessary. • Methodology Adopted  Studied the existing load of Unit 2 and estimated the total load post SCE III.  On that basis find out the net differential load to be added after SCE III which help us in resizing of transformer. Microsoft Excel Worksheet
  • 22.
    Transformer Sizing Contd.. SrNo Summary Existing Connected Load (in KW) Total connected Load Post Sc-3 (in KW) Differential Load-(To be added) in KW Remarks 1 DLS Mfg 234.12 530.82 296.70 DCPL has to work in this area 2 DLS Pump 31.19 98.59 67.40 3 DLS Pouch 36.04 49.21 13.17 4 lizol Mfg 88.85 146.05 57.20 5 Lizol Filling 50.47 75.22 24.75 6 Soap Mfg 41.19 58.19 17.00 7 Soap Filling 1058.52 1421.15 362.63 8 Soap Utility 291 719 428.00 9 Harpic Mfg 218.20 355.66 137.46 10 Harpic Filling 39.22 137.16 97.94 11 Lighting 50.00 75.00 25.00 12 Utility 182.00 284 102.00 13 VEET Mfg 156 156 0.00 No Change in this section 14 VEET Packing 50 50 0.00 15 Tank Farm 81 81 0.00 16 Misc. 50 50.00 16 Total 2607.8 4287.05 1679.25 KW 17 Diversity Factor 0.6 1008 KW 18 Considering power Factor 0.9 1120 KVA 19 Thus Required Load for Proposed Transformer 1120 KVA 20 Considering T/F Efficiency as 98%, Total Load to be added 1142 KVA 21 Considering T/F Loading Factor as 90%, Total Load to be added 1269 Case 1: Going with 2500 KVA Transformer Standalone 22 Existing Running Load as per MD 1200 KVA 23 Total New Load Post SCE III to be added 1269 KVA 24 Thus, minimum required Transformer 2469 KVA Case 2: Going with 500 KVA T/F Parallel to existing 2000 KVA T/F 25 Existing T/F capacity 2000 KVA 26 Existing Running Load as per MD 1200 KVA 27 Thus Available spare capacity in existing T/F 800 KVA 28 Total additional Load for the facility 469 KVA 29 Reccomended T/F capacity for additional Load 500 KVA
  • 23.
    Transformer Sizing Contd.. •Analysis S.No. Option-1 Option-2 Remark 1 To Replace existing 2000KVA Transformer with new 2500KVA Transformer To install new 500KVA Transformer addon to the existing system. Option -2 is economic 2 No need to put further HT Switchgear- as 11KV 1250A VCB 25kA for 3Sec. is already conneted with existing system, which is capable for 2500KVA Transformer also. Need to replace existing VCB Panel with new 1I/C & 2O/G- VCB Panel Option -1 is economic 3 No need to change the HT Cable Additional HT Cable will be needed for new Transformer Option -1 is economic 4 EB-Incomer compartment of existing LT PCC will be modified with replacement of 3200A ACB with 4000A new ACB , accrodingly necessary meters/CTs etc, One more Incomer switchgear to be added in existing LT PCC. Option -1 is economic 5 Existing PCC's Main Bus Bar capacity is 5000A (As per RB), hence changes not required. Existing PCC's Main Bus Bar capacity is 5000A (as per RB), but need to extend the bus bar up to new incomer section. Option -1 is economic  After analyzing the above sheet we came to two conclusion, either add 500 KVA transformer parallel to existing 2000 KVA Transformer or Replace 2000 KVA Transformer with 2500 KVA Transformer.  As per shown above in table, going with 2500 KVA Transformer is more economical than 500 KVA Transformer.
  • 24.
    Transformer Sizing Contd.. •Outcomes  After all analysis, we decided to go with 2500 KVA Transformer.  PCC Modification work need to be executed and work on it have been started. • Learnings  Knowledge about existing connected load in Unit 2.  Knowledge about new loads to be connected post SCE III
  • 25.
    Energy Saving’s Project ProjectMentor : Mahip Srivastava Project Guide : Varun Rai Training on Energy Conservation  Audit on Energy Conservation  Load Factor Analysis to reduce Electricity Bill  Automation of Auto Carton machine: An example of Energy Conservation
  • 26.
    Energy Conservation • Awarenessamong employees  Training related energy conservation must be organized in planned manner.  Just like safety, emphasis on making energy conservation behavioral  To boost moral of operators energy conservation related posters, banners and reward policy must be adopted. • Energy Conservation Audit  To know our loop holes and various front where we are lagging energy conservation audit is a must done activity.  All necessary activities like finding vendors, filling forms, preparing comparing sheet have been completed and we are going with CII for energy audit.  Only formalities like vendor registration and raising PO is left and we are planning to conduct audit very soon. Microsoft Excel Worksheet
  • 27.
    Load Factor Analysis •Current Scenario  RB both units receive 11 KV power from UPCL.  Contract load of UTT 1 & 2 is 1500 KVA & 1000 KVA respectively. Steps have taken to increase contract load of UTT 1 to 1500 KVA.  At present, electricity bill of each unit is about Rs 20-22 lakhs per month. • Understanding the Electricity Bill  UPCL tariffs consist of fixed demand charges, energy consumption charges and electricity duty.  Fixed demand charge is calculated on billed demand. Billed demand would be actual maximum demand or 80 % of contract demand which ever is higher. Fixed Demand Charges for Unit-1 & Unit-2 is Rs. 210 / KVAH & Rs. 270 / KVAH respectively.  Electricity duty is 25 paisa/ KVAH.
  • 28.
    Load Factor AnalysisContd..  Energy consumption charges on KVAH depend on load factor which deemed to be calculated as :- Load Factor (%) =  UPCL Tariff schedule and TOD is as follows :- Energy Consumption during the billing period X 100 Max Demand X No. of hours in this billing period Load Factor % Morning Peak Hours (Rs./ KVAH) Normal Hours (Rs./ KVAH Evening Hours (Rs./ KVAH) Off-Peak Hours (Rs./ KVAH) Upto 33 % 5.40 3.00 5.40 2.73 Above 33 % and Upto 50 % 5.40 3.30 5.40 2.99 Above 50 % 5.40 3.60 5.40 3.24 Season/ Time Of Day Morning Peak Hours (Rs./ KVAH) Normal Hours (Rs./ KVAH Evening Peak Hours (Rs./ KVAH OFF Peak Hours (Rs./ KVAH Winter 01.10 to 31.03 06:00-09:30 09:30-17:30 17:30-22:00 22:00-06:00 Summer 01.4 to 30.09 ---- 07:00-18:00 18:00-23:00 23:00-07:00
  • 29.
    Load Factor AnalysisContd.. Sample Electricity Bill of Nov. 2014 of Unit 2 :- Comparison of Units rates of Jan 2012 & Feb 2012 Electricity Bills of Unit 2 :- Sample Electricity Bill.pdf Comparison bw jan_12 & feb_12 elec bill.pdf
  • 30.
    Load Factor AnalysisContd.. • Methodology  Now to bring Load Factor below 50% any of following three methods can be implemented: 1.By Increasing the Maximum Demand to desired level 2.By decreasing the energy consumption during the billing period to desired level. 3.Using combination of above two methods. Method 1. ( Increasing MD )  Net Savings by getting Load Factor below 50% through increasing MD is as follows: Yearly Net Cost Savings in Rs.-UTT 1 1124944.75 Yearly Net Cost Savings in Rs.-UTT 2 1041023.77 Total Saving in Rs. of Whole Site 2165968.52 Monthly Cost Savings in Rs.-UTT 1 93745.40 Monthly Cost Savings in Rs.-UTT 2 86751.98 Monthly Total Saving in Rs. of Whole Site 180497.38 Microsoft Excel Worksheet
  • 31.
    Load Factor AnalysisContd..  Load Factor Analysis and Desired MD of past three years was analyzed.  Maximum Demand is noted by Energy Meter in every 20 minutes and MD’s sample having largest value in month is printed on electricity bill.
  • 32.
    Load Factor AnalysisContd..  Method 2 & 3. ( By Decreasing Energy Consumption or Combination of Method 1 & 2)  After Energy Audit and Energy Conservation Awareness Program we are hoping that our energy consumption will get reduced by 10%.  So net savings due to Load Factor Rebate + Savings from less energy consumption is as follows :- Yearly Net Cost Savings in Rs.-UTT 1 3198035.71 Yearly Net Cost Savings in Rs.-UTT 2 2966066.60 Total Saving in Rs. of Whole Site 6164102.31 Monthly Cost Savings in Rs.-UTT 1 266502.98 Monthly Cost Savings in Rs.-UTT 2 247172.22 Monthly Total Saving in Rs. of Whole Site 513675.19 Microsoft Excel Worksheet
  • 33.
    Load Factor AnalysisContd.. • Way Of Implementations load factor.jpg Execution
  • 34.
    Load Factor AnalysisContd.. • Benefits of LF Rebate  Payback period immediate as well as cost of implementation is too low or nil.  Horizontal Replication in other RB’s Plant as well. • Way Forward  To lay more emphasis on use of renewable source of energy like instead of using HSD in HWG and Steam Boiler use of Biomass.  Use of solar panels for street lighting and Admin Block Lighting.(Sustainable & CSR Activity)  Effort towards maximizing automation and minimizing energy wastage on line.
  • 35.
    Automation of AutoCarton Machine  Earlier both conveyors of Auto Carton Machines were continuously running which led to unnecessary wastage of electricity.  So Automation was done on DLS Pouch Line in UTT 2. Proximity Sensor Control box with Start & Emergency Button Upper & Lower Conveyor
  • 36.
    Automation of AutoCarton Machine Contd.. • Working Principle  As carton come in front of proximity sensor, proximity sensor sends signal to timer.  We have set delay time of 4 sec in timer which keep conveyor’s motor ON for that much time.
  • 37.
    Automation of AutoCarton Machine Contd.. • Status of Implementation  Successfully installed in DLS Pouch Line. • Scope of Implementation  All Soap and Veet lines, all Lizol Lines, DLS Pouch Line, Harpic Auto & Semi Auto Lines. • Payback Time : Immediate • Cost of Implementation : Rs. 3000 Microsoft Excel Worksheet Motor Rating of Auto Cartnor Machine(2 in Nos.,0.25 Kw each) 0.5 Kw Total Nos. of Auto Carton Machine 12 Nos. Yearly energy consumption of all 12 Auto Carton Machines without automation 32460.16 KWH Yearly energy consumption of all 12 Auto Carton Machines after automation 240.63 KWH Yearly Energy Savings in terms of energy units 32219.53 KWH Cost of 1 unit or 1 Kwh of energy 5 Rs Yearly Total Savings in Rs. 161097.7 Rs
  • 38.
    Independent Supervisor Stint •Automation of Auto Carton Machine. • Part of team working in Ronchi Machine Stabilization. • Automation of Level Indicator in Harpic Mfg.(part of Ronchi Stabilization). • Have imparted LOTO Safety training to operators of Unit 1 & Unit 2.
  • 39.
    Level Indicator’s AutomationIn Harpic Mfg.  Need for LI Automation  Ronchi Machine runs at constant pressure and thus Storage Tank can’t be emptied completely.  Takes around 30 minutes to Re Set the PID if air enters inside the Product Line Pipe.  Methodology Adopted  Metal Proximity Sensor has been fitted on three storage tanks while level switch on one.  Separate visual indication for each tank along with common siren.  PLC programing to control the automation.
  • 40.
  • 41.