Manish Engineering Works conducted a TPM review meeting on July 17, 2013. The summary discusses:
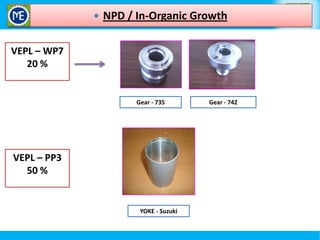
1) Organic and inorganic growth strategies including new product development plans.
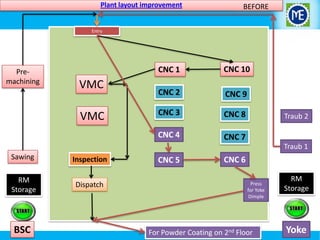
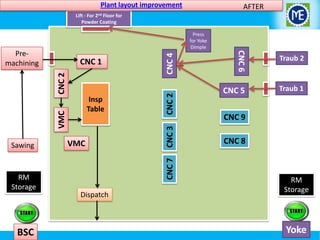
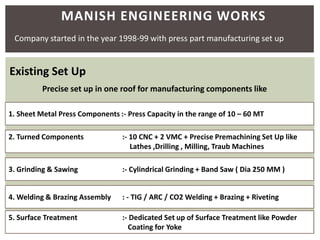
2) An overview of Manish Engineering's manufacturing capabilities across various processes like sheet metal components, CNC machining, grinding, welding and surface treatment.
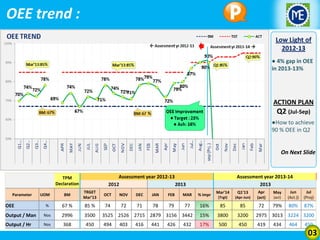
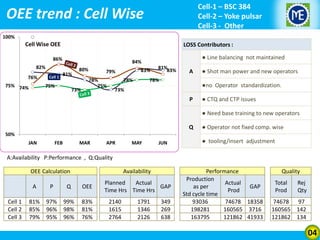
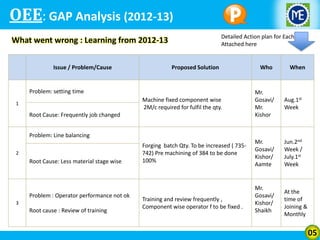
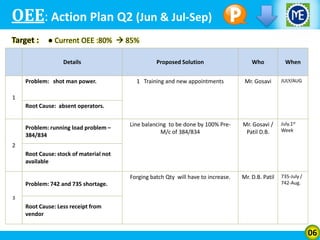
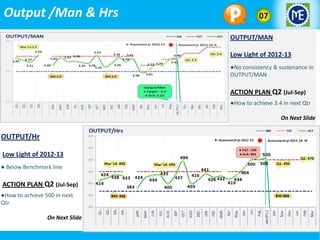
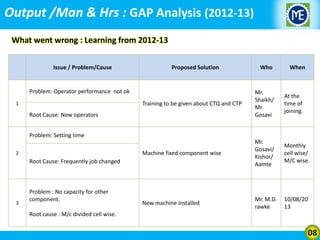
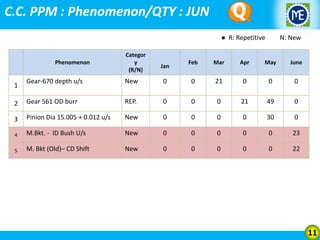
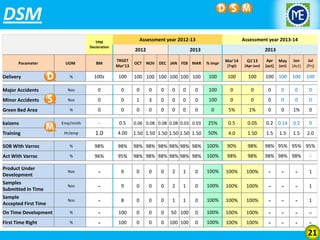
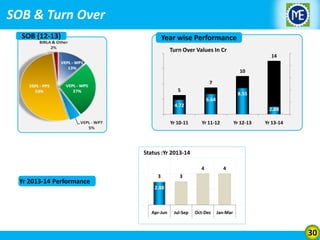
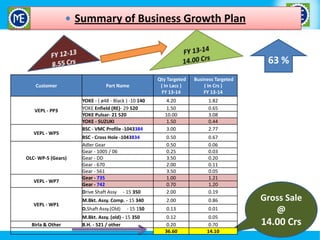
3) TPM implementation progress covering activities in areas like 5S, quality, delivery performance, defect reduction and policy deployment. Targets and plans are discussed for further improving overall equipment effectiveness.


![TPM PROGRESS EXECUTION
Parameter
Activities
Activities
A] TPM declaration with TPM policy.
29.11.11
B] Education to all employees.
1S- 2S Training Completed.
A] No unwanted material.
Done.
B] Prefix location, Prefix quantity.
Done.
A] Handling as per agreed norms in
container/Trolley
Plastic Bins
B] Elimination of quantity shortages
container should have visual countability.
Plastic Bins with partition & Part
wise Qty.
A] Study of fitment, Aesthetic & Functional
Parameters & implementation of perfect inspection
system for all parts.
All components fitment and
functional parameters known to all
section heads and resp.operators.
B] Cause side Kaizens & Poka-Yokes implementation
& sustenance.
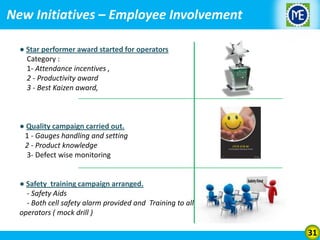
Training given to all & examples
shown.
In-house
Defects
A] Defect stratification by ABC way.
-
B] Implementation of countermeasures/Kaizens
following PM analysis way.
Activity in continuations
Delivery
Performance
A] No line stoppages at customer end.
No line stoppages
B] Daily/Weekly/Monthly delivery adherence.
Daily
TPM Policy
1S~2S
Material
Handling
Customer
Complaints](https://image.slidesharecdn.com/manishprogressreview-aug20131-131019072746-phpapp02/85/Manish-Engineering-Works-7-320.jpg)