4 slide overview of Microsoft BI & analytics architecture and how it would work with your current environment. See the PointDrive for more information - https://ptdrv.linkedin.com/5fj1ey0
ESPC15 Power BI - The New Way to Quickly Build Powerful Dashboards (Level 300)Knut Relbe-Moe [MVP, MCT]
Learn how to use the new Power BI Designer to create powerful reports and dashboards, and how to use the new features of Power BI; Power BI dashboards; Connect live to on-premises Analysis Services models, live connectors to for instance Dynamics or SalesForce, and how to use the Power BI Designer to utilize this. Power BI Designer is a standalone Windows Desktop application that can be downloaded from the Power BI site. This application combines Power Query, Power Pivot Data Model and Power View into a seamless experience that will allow customers to build their Power BI elements in an offline fashion and then upload to the Power BI Service.
In this session you will:
- Learn about Power BI Designer
- Learn how to set up Power BI dashboards
- Learn about Power Query, Power Pivot and Power View
Power BI Overview, Deployment and GovernanceJames Serra
Deploying Power BI in a large enterprise is a complex task, and one that requires a lot of thought and planning. The purpose of this presentation is to help you make your Power BI deployment a success. After a quick Power BI overview, I’ll discuss deployment strategies, common usage scenarios, how to store and refresh data, prototyping options, how to share externally, and then finish with how to administer and secure Power BI. I’ll outline considerations and best practices for achieving an optimal, well-performing, enterprise level Power BI deployment.
Dynamics Day 2014: Microsoft Dynamics AX - Business Insight Leveraging AnalyticsIntergen
A close-up look at how to leverage analytics functionality in Microsoft Dynamics AX, covering traditional BI, modifying role centres and Power BI.
Dynamics Day is Australasia's leading event for users of Microsoft Dynamics. For those of you who couldn't make it along to the event, we have made all session content available online.
Power BI has become a product with a ton of exciting features. This presentation will give an overview of some of them, including Power BI Desktop, Power BI service, what’s new, integration with other services, Power BI premium, and administration.
The presentation discusses the different aspects of Power BI like Power BI for O365, Data Discovery, Data Analysis, Data Visualization & Power Maps, Natural Language Search etc.
Its a business analytics solution presented by Netwoven at the Microsoft Power BI workshop held on Oct 30th at SVC Microsoft, Mountain View.
Power BI for Office 365: Using SharePoint to Deliver Self-ServicePerficient, Inc.
Power BI is a compelling new offering with advanced collaborative BI capabilities for Office 365 SharePoint Online users. It includes mobile cross-platform reporting, on the fly dash-boarding and natural language querying, but that's not all. Power BI also encompasses new tools in Excel 2013 that support streamlined self-service reporting and analytics. Find out how you can leverage the advanced new self-service BI features coming soon via Office 365 and SharePoint Online!
In this slideshare, we explore:
Excel Power BI tools: PowerPivot/PowerView/Power Map/Power Query
SharePoint Online Power BI Sites: Data Management Gateway (for connecting to on-premises data sources), uploading Excel content
Power BI apps: Windows 8, Windows Phone
Leveraging Microsoft Power BI To Support Enterprise Business IntelligenceRightpoint
Take control over your data. View our presentation of end-to-end enterprise business intelligence leveraging Microsoft solutions including SQL Server, Power Pivot, and Power BI.
Demonstration includes:
• How to build a Tabular model by importing a Power Pivot workbook
• Connecting a Tabular model to Power BI
• Developing Power BI dashboards/reports connected to an on-premise Tabular model
• Refreshing Power BI dashboards/reports
Power BI provides advanced data technology for transforming, storing, and presenting data. This technology can support advanced Excel users and data scientists. This presentation provides basics for Excel 2010 and 2013 users and information about O365 and SharePoint Online supporting shared use cases.
Best practices to deliver data analytics to the business with power biSatya Shyam K Jayanty
Get your data to life with Power BI visualization and insights!
With the changing landscape of Power BI features it is essential to get hold of configuration and deployment practices within your data platform that will ensure you are on-par with compliance & security practices. In this session we will overview from the basics leading into advanced tricks on this landscape:
How to deploy Power BI?
How to implement configuration parameters and package BI features as a part of Office 365 roll out in your organisation?
What are newest features and enhancements on this Power BI landscape?
How to manage on-premise vs on-cloud connectivity?
How can you help and support the Power BI community as well?
Having said that within the objectives of this session, cloud computing is another aspect of this technology made is possible to get data within few clicks and ticks to the end-user. Let us review how to manage & connect on-premise data to cloud capabilities that can offer full advantage of data catalogue capabilities by keeping data secure as per Information Governance standards. Not just with nuts and bolts, performance is another aspect that every Admin is keeping up, let us look into few settings on how to maximize performance to optimize access to data as required. Gain understanding and insight into number of tools that are available for your Business Intelligence needs. There will be a showcase of events to demonstrate where to begin and how to proceed in BI world.
- D BI A Consulting
consulting@dbia.uk
Introduction to Power BI a Business Intelligence Tool by Apurva RamtekeApurva Ramteke
Power BI is a tool which provides users with very intelligent statistical analysis of raw data and to derive beautiful reports out of it using hundreds of power Visualization. Not just it Power BI provides a build in advantage of Power Views and Power Queries derived from Excel as a base with a very easy process learning. I personally call it very Intelligently dumb tool, because its so easy for normal user to use it and make highly interactive reporting and Dashboards. The Dashboard which are created can be shared with multiple users with specific permission levels to access the reports.
SqlSaturday#699 Power BI - Create a dashboard from zero to heroVishal Pawar
Every data has meaning, but we had limitation to use data through big long running process Extraction, Transformation and Representation, but now Power BI solves your problem to kick start having Data extraction in Power Query, Data Modelling and Transformation in Power Pivot and reach data representation using power view and power map on demand any nearby device on your fingertips.
Learn how to create Power BI Dashboard from scratch.
This slide deck explains in a comprehensive way what Power BI is, how the Power BI architecture looks like and what the usage scenarios are for using Power BI and related tools
Afternoons with Azure - Power BI and Azure Analysis ServicesCCG
See how Microsoft Power BI and Azure Analysis Services are influencing the BI and analytics market. Journey through data structures and fundamentals for setting up your next dashboard initiative.
Interested in learning more? Click ccganalytics.com/resources for more or call (813) 265-3239.
BI in the Cloud - Microsoft Power BI Overview and DemoChristopher Foot
RDX Insights Series Presentation focusing on Microsoft Power BI in the cloud. We begin with a high-level overview of the Microsoft BI product suite and discuss the SSIS/SSAS/SSRS tech stack and Power BI. The webinar continues with a deep dive into Power BI and includes instructions on how to use the product to capture, model, analyze and visualize business data. We end the webinar with a Power BI demo highlighting some of its most beneficial and interesting features.
Operational dashboarding and reporting with Microsoft Business IntelligenceJohn White
A great looking, relevant, informative dashboard for the executive is the ultimate end goal for most Business Intelligence projects. Microsoft has all of the tools that are necessary to get data from your transactional systems into an effective dashboard. What is less clear is to how to go about achieving it. Which tools should you use? As with most things, we have different tools for different requirements, and it isn't always clear as to how they match up.
This session will focus on what the various reporting and dashboarding tools from Microsoft can do for you, where you should use them, and how to get them working for you. Both on premises and cloud based scenarios will be discussed. At the conclusion of this session, you should have a fundamental understanding of the Microsoft products in this space fit together, including Excel, Reporting Services, SharePoint, Power View, and PerformancePoint.
Cortana Analytics Workshop: Developing for Power BIMSAdvAnalytics
Faisal Mohamood. Power BI is leading a market change to SaaS BI. Come learn how Power BI's APIs and Developers will transform how Enterprises and ISVs will go to market in the coming year. You'll get to see great demos showing what's possible, and you'll get a sneak peak of all of our upcoming capabilities. Go to https://channel9.msdn.com/ to find the recording of this session.
In this presentation we cover the main features of BI Dashboard with SQL Server 2008 R2.
Regards,
Eduardo Castro Martinez
Microsoft SQL Server MVP
http://ecastrom.blogspot.com
Wer heutzutage in Big Data Projekten involviert ist, kommt an Hadoop-Tools, wie beispielsweise Hive, Spark oder Storm kaum noch vorbei.
Doch wie sieht es mit den Microsoft Bordmittel, genauer gesagt Visual Studio, C# und SQL, aus? Dieser Frage geht Sascha Dittmann in dieser Session nach.
Er zeigt anhand von Codebeispielen, und den Azure Data Lake Diensten, wie eine Umsetzung auch mit reinen Microsoft Tools möglich ist.
Groupby -Power bi dashboard in hour by vishal pawar-Presentation Vishal Pawar
Power BI Dashboard in an hour with Various Slides.
Target Audience:
Useful for Develops and DBA those who want to know what is Power BI and How we can utilize various features.
Also session will be useful for anyone who wants learn Power BI from basic.
Abstract:
In this session, We will walk through various features of Power BI, How Power BI can transform your company’s data into rich visuals and Easy yet powerful Analytics solutions for your whole organization.
At end of session with following Power BI Dashboard example
sp_Blitz in Dashboard
SQL Server Info Dashboard
Twitter Dashboard
World Dashboard
Most important takeaways from session –
You will be learning basics of Power BI with the additional perk of analyzing sp_Blitz in Power BI.
Various features of Power BI making you from ZERO to HERO
After this session, you will be able to analyze data into Power BI
Power BI Create lightning fast dashboard with power bi & Its Components Vishal Pawar
Every data has meaning, but we had limitation to use data through big long running process Extraction, Transformation and Representation, but now Power BI solves your problem to kick start having Data extraction in Power Query, Data Modelling and Transformation in Power Pivot and reach data representation using power view and power map on demand any nearby device on your fingertips, You will learn all latest and greatest features of Power BI.
Starting in May 2010, with SQL Server 2008 R2, Microsoft began talking more and more about "Personal BI". The focus of this discussion was a paradigm shift moving business intelligence from being something a few BI professionals do with a data warehouse to a practice done by Information Workers every day in familiar tools like Microsoft Excel and SharePoint. Over the course of this session we will show you the improvements that Microsoft has made in the 2013 stack to take this new focus from being a “nice idea” to a truly powerful reality. We will explore the improvements made to Excel, PowerPivot & Power View, & Reporting Services. We will explain the underlying technology that makes the new features possible and walk through demos of some of the shinier toys. At the end of the session you will walk away with a better understanding of what is new in 2013 for business intelligence and an extreme desire to build reusable data model that will undoubtedly bring real value to your business.
Explain about power BI Overview from Power BI Desktop, Power BI Service, Power BI Report Server and Power BI Mobile that consume all BI Data from Dataset and datamodel
Your company is not-yet- ready for the cloud ?
How to refresh your BI solution by providing the beauty of Power BI reports on premises and the ability from the same place to consume your legacy reports or to share efficiently your data model through a unique place. Demo based session with an architecture introduction and a "from the field" real project feedback.
This checklist explores some fundamental aspects of the data architecture necessary for IoT success. It will examine what is required to enable an environment that can rapidly adapt to the dynamic nature of massive numbers of connected sensors and other end-point devices, communication and data streaming, ingestion and analysis, and deployment of developed analytics models for automated decision making.
Differences between Enterprise contract levels. Articulation of benefits for moving to an E5.
(Note: This document is visible only for those with the link.)
Essentials of Automations: The Art of Triggers and Actions in FMESafe Software
In this second installment of our Essentials of Automations webinar series, we’ll explore the landscape of triggers and actions, guiding you through the nuances of authoring and adapting workspaces for seamless automations. Gain an understanding of the full spectrum of triggers and actions available in FME, empowering you to enhance your workspaces for efficient automation.
We’ll kick things off by showcasing the most commonly used event-based triggers, introducing you to various automation workflows like manual triggers, schedules, directory watchers, and more. Plus, see how these elements play out in real scenarios.
Whether you’re tweaking your current setup or building from the ground up, this session will arm you with the tools and insights needed to transform your FME usage into a powerhouse of productivity. Join us to discover effective strategies that simplify complex processes, enhancing your productivity and transforming your data management practices with FME. Let’s turn complexity into clarity and make your workspaces work wonders!
Generative AI Deep Dive: Advancing from Proof of Concept to ProductionAggregage
Join Maher Hanafi, VP of Engineering at Betterworks, in this new session where he'll share a practical framework to transform Gen AI prototypes into impactful products! He'll delve into the complexities of data collection and management, model selection and optimization, and ensuring security, scalability, and responsible use.
LF Energy Webinar: Electrical Grid Modelling and Simulation Through PowSyBl -...DanBrown980551
Do you want to learn how to model and simulate an electrical network from scratch in under an hour?
Then welcome to this PowSyBl workshop, hosted by Rte, the French Transmission System Operator (TSO)!
During the webinar, you will discover the PowSyBl ecosystem as well as handle and study an electrical network through an interactive Python notebook.
PowSyBl is an open source project hosted by LF Energy, which offers a comprehensive set of features for electrical grid modelling and simulation. Among other advanced features, PowSyBl provides:
- A fully editable and extendable library for grid component modelling;
- Visualization tools to display your network;
- Grid simulation tools, such as power flows, security analyses (with or without remedial actions) and sensitivity analyses;
The framework is mostly written in Java, with a Python binding so that Python developers can access PowSyBl functionalities as well.
What you will learn during the webinar:
- For beginners: discover PowSyBl's functionalities through a quick general presentation and the notebook, without needing any expert coding skills;
- For advanced developers: master the skills to efficiently apply PowSyBl functionalities to your real-world scenarios.
In his public lecture, Christian Timmerer provides insights into the fascinating history of video streaming, starting from its humble beginnings before YouTube to the groundbreaking technologies that now dominate platforms like Netflix and ORF ON. Timmerer also presents provocative contributions of his own that have significantly influenced the industry. He concludes by looking at future challenges and invites the audience to join in a discussion.
DevOps and Testing slides at DASA ConnectKari Kakkonen
My and Rik Marselis slides at 30.5.2024 DASA Connect conference. We discuss about what is testing, then what is agile testing and finally what is Testing in DevOps. Finally we had lovely workshop with the participants trying to find out different ways to think about quality and testing in different parts of the DevOps infinity loop.
The Metaverse and AI: how can decision-makers harness the Metaverse for their...Jen Stirrup
The Metaverse is popularized in science fiction, and now it is becoming closer to being a part of our daily lives through the use of social media and shopping companies. How can businesses survive in a world where Artificial Intelligence is becoming the present as well as the future of technology, and how does the Metaverse fit into business strategy when futurist ideas are developing into reality at accelerated rates? How do we do this when our data isn't up to scratch? How can we move towards success with our data so we are set up for the Metaverse when it arrives?
How can you help your company evolve, adapt, and succeed using Artificial Intelligence and the Metaverse to stay ahead of the competition? What are the potential issues, complications, and benefits that these technologies could bring to us and our organizations? In this session, Jen Stirrup will explain how to start thinking about these technologies as an organisation.
Epistemic Interaction - tuning interfaces to provide information for AI supportAlan Dix
Paper presented at SYNERGY workshop at AVI 2024, Genoa, Italy. 3rd June 2024
https://alandix.com/academic/papers/synergy2024-epistemic/
As machine learning integrates deeper into human-computer interactions, the concept of epistemic interaction emerges, aiming to refine these interactions to enhance system adaptability. This approach encourages minor, intentional adjustments in user behaviour to enrich the data available for system learning. This paper introduces epistemic interaction within the context of human-system communication, illustrating how deliberate interaction design can improve system understanding and adaptation. Through concrete examples, we demonstrate the potential of epistemic interaction to significantly advance human-computer interaction by leveraging intuitive human communication strategies to inform system design and functionality, offering a novel pathway for enriching user-system engagements.
Smart TV Buyer Insights Survey 2024 by 91mobiles.pdf91mobiles
91mobiles recently conducted a Smart TV Buyer Insights Survey in which we asked over 3,000 respondents about the TV they own, aspects they look at on a new TV, and their TV buying preferences.
UiPath Test Automation using UiPath Test Suite series, part 4DianaGray10
Welcome to UiPath Test Automation using UiPath Test Suite series part 4. In this session, we will cover Test Manager overview along with SAP heatmap.
The UiPath Test Manager overview with SAP heatmap webinar offers a concise yet comprehensive exploration of the role of a Test Manager within SAP environments, coupled with the utilization of heatmaps for effective testing strategies.
Participants will gain insights into the responsibilities, challenges, and best practices associated with test management in SAP projects. Additionally, the webinar delves into the significance of heatmaps as a visual aid for identifying testing priorities, areas of risk, and resource allocation within SAP landscapes. Through this session, attendees can expect to enhance their understanding of test management principles while learning practical approaches to optimize testing processes in SAP environments using heatmap visualization techniques
What will you get from this session?
1. Insights into SAP testing best practices
2. Heatmap utilization for testing
3. Optimization of testing processes
4. Demo
Topics covered:
Execution from the test manager
Orchestrator execution result
Defect reporting
SAP heatmap example with demo
Speaker:
Deepak Rai, Automation Practice Lead, Boundaryless Group and UiPath MVP
Dev Dives: Train smarter, not harder – active learning and UiPath LLMs for do...UiPathCommunity
💥 Speed, accuracy, and scaling – discover the superpowers of GenAI in action with UiPath Document Understanding and Communications Mining™:
See how to accelerate model training and optimize model performance with active learning
Learn about the latest enhancements to out-of-the-box document processing – with little to no training required
Get an exclusive demo of the new family of UiPath LLMs – GenAI models specialized for processing different types of documents and messages
This is a hands-on session specifically designed for automation developers and AI enthusiasts seeking to enhance their knowledge in leveraging the latest intelligent document processing capabilities offered by UiPath.
Speakers:
👨🏫 Andras Palfi, Senior Product Manager, UiPath
👩🏫 Lenka Dulovicova, Product Program Manager, UiPath
Accelerate your Kubernetes clusters with Varnish CachingThijs Feryn
A presentation about the usage and availability of Varnish on Kubernetes. This talk explores the capabilities of Varnish caching and shows how to use the Varnish Helm chart to deploy it to Kubernetes.
This presentation was delivered at K8SUG Singapore. See https://feryn.eu/presentations/accelerate-your-kubernetes-clusters-with-varnish-caching-k8sug-singapore-28-2024 for more details.
Removing Uninteresting Bytes in Software FuzzingAftab Hussain
Imagine a world where software fuzzing, the process of mutating bytes in test seeds to uncover hidden and erroneous program behaviors, becomes faster and more effective. A lot depends on the initial seeds, which can significantly dictate the trajectory of a fuzzing campaign, particularly in terms of how long it takes to uncover interesting behaviour in your code. We introduce DIAR, a technique designed to speedup fuzzing campaigns by pinpointing and eliminating those uninteresting bytes in the seeds. Picture this: instead of wasting valuable resources on meaningless mutations in large, bloated seeds, DIAR removes the unnecessary bytes, streamlining the entire process.
In this work, we equipped AFL, a popular fuzzer, with DIAR and examined two critical Linux libraries -- Libxml's xmllint, a tool for parsing xml documents, and Binutil's readelf, an essential debugging and security analysis command-line tool used to display detailed information about ELF (Executable and Linkable Format). Our preliminary results show that AFL+DIAR does not only discover new paths more quickly but also achieves higher coverage overall. This work thus showcases how starting with lean and optimized seeds can lead to faster, more comprehensive fuzzing campaigns -- and DIAR helps you find such seeds.
- These are slides of the talk given at IEEE International Conference on Software Testing Verification and Validation Workshop, ICSTW 2022.
Encryption in Microsoft 365 - ExpertsLive Netherlands 2024Albert Hoitingh
In this session I delve into the encryption technology used in Microsoft 365 and Microsoft Purview. Including the concepts of Customer Key and Double Key Encryption.
Encryption in Microsoft 365 - ExpertsLive Netherlands 2024
Microsoft business intelligence and analytics
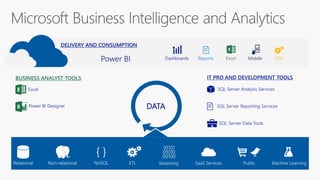
1. Relational Non-relational NoSQL
{ }
Streaming
10101
01010
00100
SaaS Services Public Machine LearningETL
DATA
BUSINESS ANALYST TOOLS
Excel
Power BI Designer
IT PRO AND DEVELOPMENT TOOLS
SQL Server Analysis Services
SQL Server Reporting Services
SQL Server Data Tools
DELIVERY AND CONSUMPTION
Power BI ReportsDashboards Mobile APIsExcel
2. Azure Service Bus
Live Power BI dashboards and
reports
Cloud
On-premises
Power BI data movement
service
SQL Server Analysis Services
Live Query
3. Data Sources Power BI service
SaaS solutions
e.g. Marketo, Salesforce, GitHub
On-premises data
e.g. SQL Server Analysis Services
Organizational content
Corporate data sources or external
data services
Azure services
Azure SQL, Stream Analytics…
Excel files
Workbook data/models
Power BI Designer files
Data from files, databases, Azure,
and other sources
146.03K145.84K145.96K146.06K 40.08K38.84K39.99K40.33K
146.03K145.84K145.96K146.06K
Power BI REST APIsPower BI Desktop
Prepare Explore ShareReport
Data refresh
Visualizations
Live dashboards
Content packs
Reports
Datasets01001
10101
4. *Gartner “Magic Quadrant for Business Intelligence and Analytics Platforms,” by Rita L. Sallam, Cindi Howson, Carlie
J. Idoine, Thomas W. Oestreich, James Laurence Richardson, and Joao Tapadinhas February 16, 2017
This graphic was published by Gartner, Inc. as part of a larger research document and should be evaluated in the
context of the entire document. The Gartner document is available upon request from Microsoft. Gartner does not
endorse any vendor, product or service depicted in its research publications, and does not advise technology users to
select only those vendors with the highest ratings or other designation. Gartner research publications consist of the
opinions of Gartner's research organization and should not be construed as statements of fact. Gartner disclaims all
warranties, expressed or implied, with respect to this research, including any warranties of merchantability or fitness for
a particular purpose.
Microsoft is placed furthest
for Completeness of Vision
within the Leaders Quadrant
{ }
Editor's Notes
Power BI lets you establish live connectivity with on-premises SQL Server Analysis Services tabular models
Simply configure the connector to work with your existing SSAS solution
With this connector, there is no need to move any data to the cloud – your data stays in SSAS on-premises, even while it is viewed in Power BI
The connection is live – meaning that when users view and explore dashboards, Power BI interactively queries the on-premises cube to fetch the data right then
This enables efficient data exploration thanks to optimized query performance
You can create reports with SSAS data on powerbi.com, even while data remains on-premises
Your existing, role-based SSAS permissions still apply – user access to SSAS data via Power BI is controlled the same way
The connection to SSAS is secured via Azure Service Bus SSL encryption
Let’s walk through an overview of how Power BI works.
First, Power BI connects to a variety of data sources. These range across both cloud and on-premises sources, and include:
A variety of popular SaaS solutions, such as Marketo, Salesforce, GitHub, Dyanmics CRM, Zendesk, and several others
On-premises databases – Power BI offers live connectivity to SQL Server Analysis Services, which we’ll cover in more detail later. And using a gateway solution, Power BI can connect to over 20 other database solutions, such as Oracle and IBM databases.
Custom data sources – Power BI can connect to any data source you need it to thanks to its extensibility via REST APIs. This includes both proprietary corporate data sources, as well as external data services. For example, if you are a SaaS solution provider, you can work with Microsoft to connect your solution to Power BI.
Other Azure services – Power BI integrates tightly with SQL Azure and Stream Analytics, and will be integrating closely with more Azure services over time
PowerBI Designer and Excel files – Excel workbooks can be directly connected to Power BI.com, or may be used with Power BI Designer. Power BI Designer is a companion application to the Power BI service – it is a desktop tool that supports data analysis and reporting. Like Excel files, Power BI Designer files may be uploaded to the Power BI service.
2. Power BI Designer is a visual data exploration tool that enables you to analyze data and create stunning reports. With Designer, you are able to:
Connect to a broad range of data sources
Prepare data for analysis using query functionality, similar to Power Query for Excel
Model and Analyze data
Develop reports showcasing relevant data from a variety of sources in a visually compelling format
Publish reports directly to powerbi.com so they can be used and shared
3. The Power BI service, sometimes referred to as powerbi.com, is what allows you to:
Create beautiful visualizations to tell compelling data stories
Build rich, live dashboards that turn BI into business insights
Create reports & datasets from which you can create visualizations and dashboards
Enjoy the benefits of up-to-date data with real-time, automatic and scheduled refreshes
Share dashboards easily with other people in your organization
Ask questions of data in plain English with Natural Language Query
Stay connected to your data all the time with mobile applications
4. Finally, the Power BI REST API library allows you to customize nearly every aspect of Power BI, including connecting to custom data sources, enabling real-time data streaming from your data source to Power BI, and integrating other applications with Power BI
You’re looking at Gartner’s Magic Quadrant for BI and Analytics Platforms, published in February 2017. Microsoft is named as a Leader.
You’ll notice that Microsoft is a Market Leader and the furthest of any vendor to the right of the quadrant – Gartner considered Microsoft the most visionary of all BI vendors.
Oracle is not in the Leader’s quadrant; they are a “Niche Player”. It should be noted that Oracle was not even featured in Gartner’s 2016 Magic Quadrant and whilst their product has improved since then, it still lags the leaders.
[click]