Download as PPS, PPTX

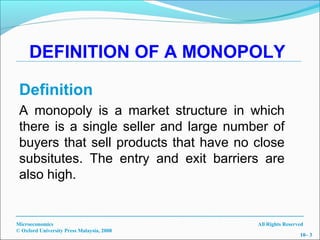


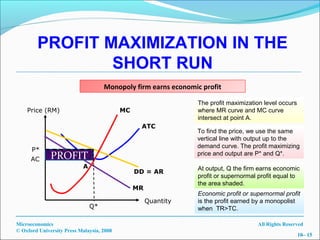
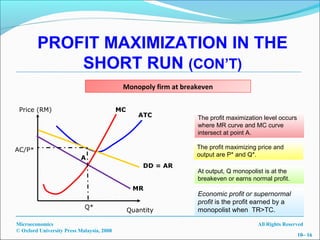
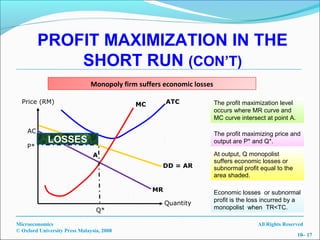
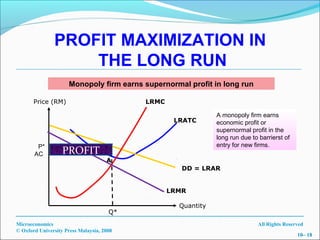


The document discusses monopoly market structures. It defines a monopoly as a market with a single seller and many buyers, where there are high barriers to entry. A monopoly is characterized by being the only price maker in the market with power to control prices. The document also describes different types of monopolies, approaches to determining profit maximization, and concepts such as price discrimination.


![Lesson 9--production[1]](https://cdn.slidesharecdn.com/ss_thumbnails/lesson-9-production1-130409195935-phpapp02-thumbnail.jpg?width=640&height=640&fit=bounds)


