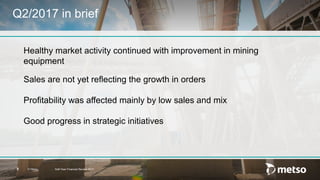
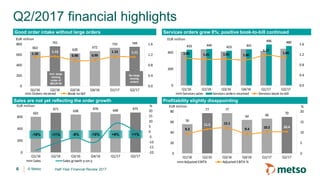
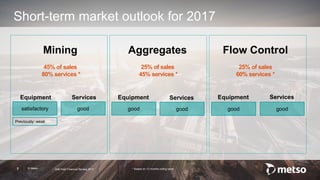
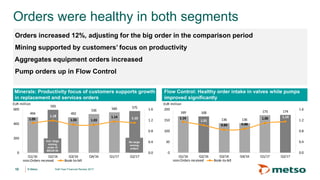
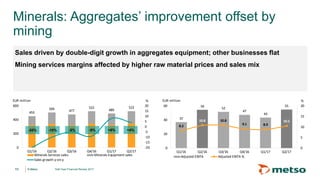
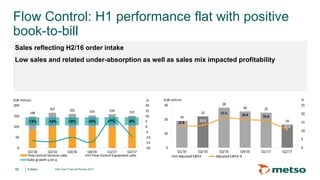
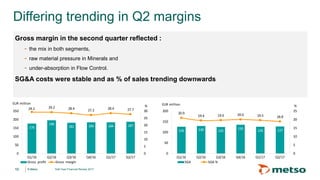
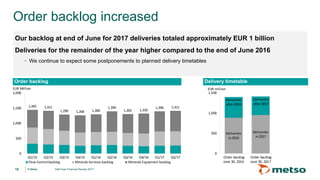
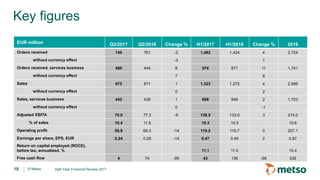
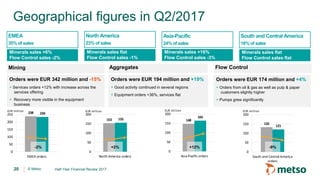
H1
Half-Year Financial
Review 2017
January 1 – June 30, 2017
© Metso2
Forward looking statements
It should be noted that certain statements herein which are not historical facts, including, without limitation, those
regarding expectations for general economic development and the market situation, expectations for customer industry
profitability and investment willingness, expectations for company growth, development and profitability and the
realization of synergy benefits and cost savings, and statements preceded by ”expects”, ”estimates”, ”forecasts” or similar
expressions, are forward looking statements. These statements are based on current decisions and plans and currently
known factors. They involve risks and uncertainties which may cause the actual results to materially differ from the results
currently expected by the company.
Such factors include, but are not limited to:
1) general economic conditions, including fluctuations in exchange rates and interest levels which influence the
operating environment and profitability of customers and thereby the orders received by the company and their
margins
2) the competitive situation, especially significant technological solutions developed by competitors
3) the company’s own operating conditions, such as the success of production, product development and project
management and their continuous development and improvement
4) the success of pending and future acquisitions and restructuring.
Half-Year Financial Review 2017
© Metso© Metso
50
150
250
350
450
550
650
750
0
2
4
6
8
10
12
14
Lost time incident frequency (LTIF) Risk observation frequency
3
Safety is a key driver throughout our value chain
Demand from customers: License to operate
People
Encourages
employee
commitment
and motivation
Productivity
Improves
productivity and
lowers quality
costs
Partnership
Improves
stakeholder
recognition as
a sustainable
partner
Half-Year Financial Review 2017
LTIF
2.5 *
* Rolling 12 months as of June 30, 2017
© Metso© Metso
Quarterly highlights
Matti Kähkönen
President and CEO
4 Half-Year Financial Review 2017
© Metso Half-Year Financial Review 20175
Q2/2017 in brief
Healthy market activity continued with improvement in mining
equipment
Sales are not yet reflecting the growth in orders
Profitability was affected mainly by low sales and mix
Good progress in strategic initiatives
© Metso
433 444 423 441
496 480
1.06 1.01 1.02 1.00
1.17
1.08
0.0
0.4
0.8
1.2
1.6
0
200
400
Q1/16 Q2/16 Q3/16 Q4/16 Q1/17 Q2/17
EUR million
Services sales Services orders received Services book-to-bill
56
77 77
64 66 70
9.3
11.5 12.1
9.4 10.2 10.4
0
5
10
15
20
0
20
40
60
80
Q1/16 Q2/16 Q3/16 Q4/16 Q1/17 Q2/17
EUR million
Adjusted EBITA Adjusted EBITA %
%
601
671
638
676 648 675
-20
-15
-10
-5
0
5
10
15
20
0
200
400
600
Q1/16 Q2/16 Q3/16 Q4/16 Q1/17 Q2/17
EUR million
Sales Sales growth y-on-y
%
663
761
628
672
733 749
1.10
1.13
0.98 0.99
1.13 1.11
0.0
0.4
0.8
1.2
1.6
0
200
400
600
800
Q1/16 Q2/16 Q3/16 Q4/16 Q1/17 Q2/17
EUR million
Orders received Book-to-bill
Q2/2017 financial highlights
Profitability slightly disappointing
Services orders grew 8%; positive book-to-bill continued
6
Good order intake without large orders
Sales are not yet reflecting the order growth
-11%-18% -10%-6% +8% +1%
Half-Year Financial Review 2017
Incl. large
mining
order of
MEUR 90
No large
mining
orders
© Metso Half-Year Financial Review 20177
Short-term market outlook for 2017
Mining
45% of sales
80% services *
Aggregates
25% of sales
45% services *
Flow Control
25% of sales
60% services *
satisfactory good good good good
Equipment Equipment Equipment ServicesServicesServices
Previously: weak
* Based on 12 months rolling sales
good
© Metso Half-Year Financial Review 20178
Current topics in the second quarter
Good progress in growth initiatives
− Investments in assembly capacity of Lokotracks in Finland, and in the manufacturing of crusher wear parts in
South Africa totaling EUR 4.5 million
− Continued expansion of distribution network in Flow Control and Aggregates
Digital strategy proceeding according to plan
− Platform was chosen to create new industry-leading IoT solutions for mining and aggregates customers
New President and CEO and changes in management team
− Nico Delvaux will start as the new President and CEO on August 1
− Victor Tapia started as President of Minerals Capital on June 1
© Metso© Metso
Financial performance
Eeva Sipilä
CFO
9 Half-Year Financial Review 2017
© Metso© Metso
169 168
136 136
173 174
1.14
1.01
0.84 0.88
1.09 1.14
0.0
0.4
0.8
1.2
1.6
0
50
100
150
200
Q1/16 Q2/16 Q3/16 Q4/16 Q1/17 Q2/17
EUR million
Orders received Book-to-bill
494
593
492
536 560 575
1.09
1.18
1.03 1.03
1.14 1.10
0.0
0.4
0.8
1.2
1.6
0
200
400
600
Q1/16 Q2/16 Q3/16 Q4/16 Q1/17 Q2/17
EUR million
Orders received Book-to-bill
Orders were healthy in both segments
Orders increased 12%, adjusting for the big order in the comparison period
Mining supported by customers’ focus on productivity
Aggregates equipment orders increased
Pump orders up in Flow Control
10
Minerals: Productivity focus of customers supports growth
in replacement and services orders
Flow Control: Healthy order intake in valves while pumps
improved significantly
Half-Year Financial Review 2017
Incl. large
mining
order of
MEUR 90
No large
mining
orders
© Metso© Metso
37
54
52
47
43
55
8.2
10.8 10.8
9.1 8.9
10.5
0
5
10
15
20
0
20
40
60
Q1/16 Q2/16 Q3/16 Q4/16 Q1/17 Q2/17
EUR million
Adjusted EBITA Adjusted EBITA %
%
453
504
477
522
489
523
-20
-15
-10
-5
0
5
10
15
20
0
200
400
600
Q1/16 Q2/16 Q3/16 Q4/16 Q1/17 Q2/17
EUR million
Minerals Services sales Minerals Equipment sales
Sales growth y-on-y
%
Minerals: Aggregates’ improvement offset by
mining
Sales driven by double-digit growth in aggregates equipment; other businesses flat
Mining services margins affected by higher raw material prices and sales mix
-10%-20% -9%-5% +8%
11
+4%
Half-Year Financial Review 2017
© Metso© Metso
19
22
28
26 25
1612.8 13.2
17.5 16.6 15.6
10.8
0
5
10
15
20
25
0
10
20
30
Q1/16 Q2/16 Q3/16 Q4/16 Q1/17 Q2/17
EUR million
Adjusted EBITA Adjusted EBITA %
%
148
167 161 155 159 152
-20
-15
-10
-5
0
5
10
15
20
0
50
100
150
200
Q1/16 Q2/16 Q3/16 Q4/16 Q1/17 Q2/17
EUR million
Flow Control Services sales Flow Control Equipment sales
Sales growth y-on-y
%
Flow Control: H1 performance flat with positive
book-to-bill
Sales reflecting H2/16 order intake
Low sales and related under-absorption as well as sales mix impacted profitability
-14%-13% -14%-10% +7%
12
-9%
Half-Year Financial Review 2017
© Metso© Metso
176
196
181 184 184 187
29.2 29.2 28.4 27.2 28.4 27.7
0
5
10
15
20
25
30
0
50
100
150
200
250
Q1/16 Q2/16 Q3/16 Q4/16 Q1/17 Q2/17
EUR million
Gross profit Gross margin
%
126 130 125
135 126 127
20.9
19.4 19.6 20.0 19.5 18.8
0
5
10
15
20
25
0
50
100
150
200
Q1/16 Q2/16 Q3/16 Q4/16 Q1/17 Q2/17
EUR million
SGA SGA %
%
Differing trending in Q2 margins
Gross margin in the second quarter reflected :
- the mix in both segments,
- raw material pressure in Minerals and
- under-absorption in Flow Control.
SG&A costs were stable and as % of sales trending downwards
13 Half-Year Financial Review 2017
© Metso© Metso
480
240
207
153
91
174
70
-25 -63
100
-0.3
0.0
0.3
0.6
0.9
1.2
1.5
-100
100
300
500
Q1/15 Q2/15 Q3/15 Q4/15 Q1/16 Q2/16 Q3/16 Q4/16 Q1/17 Q2/17
EUR million
Net debt Net debt/EBITDA
124 120
129
83
59
103 103
127
58
46
0
100
200
300
400
500
0
50
100
150
Q1/15 Q2/15 Q3/15 Q4/15 Q1/16 Q2/16 Q3/16 Q4/16 Q1/17 Q2/17
EUR million
Cash flow from operations Cash flow from operations, rolling 12 months
Balance sheet continues to be strong
Free cash flow affected mainly by EUR 56 million increase of net working capital
Paid income taxes totaled EUR 37 million
Dividend of EUR 157 million paid in April
Maturity structure of debt was extended
- New EUR 300 million bond issued
- EUR 205 million of the 2019 outstanding EUR 400 million bond purchased back
14 Half-Year Financial Review 2017
© Metso© Metso
1,445 1,411
1,290 1,268 1,300
1,399
1,305 1,320
1,396 1,411
0
500
1,000
1,500
2,000
Q1/15 Q2/15 Q3/15 Q4/15 Q1/16 Q2/16 Q3/16 Q4/16 Q1/17 Q2/17
EUR Million
Flow Control backlog Minerals Services backlog Minerals Equipment backlog
Order backlog increased
Our backlog at end of June for 2017 deliveries totaled approximately EUR 1 billion
Deliveries for the remainder of the year higher compared to the end of June 2016
- We continue to expect some postponements to planned delivery timetables
Delivery timetableOrder backlog
15 Half-Year Financial Review 2017
Deliveries
in2017
Deliveries
after2017
Deliveries
in2016
Deliveries
after2016
0
500
1,000
1,500
Order backlog
June 30, 2016
Order backlog
June 30, 2017
EUR million
company/metso metsogroup metsoworldmetsoworld metsogroup
www.metso.com
© Metso© Metso
Appendix
17 Half-Year Financial Review 2017
© Metso
Key figures
EUR million Q2/2017 Q2/2016 Change % H1/2017 H1/2016 Change % 2016
Orders received 749 761 -2 1,482 1,424 4 2,724
without currency effect -3 1
Orders received, services business 480 444 8 976 877 11 1,741
without currency effect 7 8
Sales 675 671 1 1,323 1,272 4 2,586
without currency effect 0 2
Sales, services business 445 439 1 868 848 2 1,703
without currency effect 0 -1
Adjusted EBITA 70.0 77.3 -9 136.5 133.0 3 274.0
% of sales 10.4 11.5 10.3 10.5 10.6
Operating profit 59.8 69.3 -14 119.2 119.7 0 227.1
Earnings per share, EPS, EUR 0.24 0.28 -14 0.47 0.46 2 0.87
Return on capital employed (ROCE),
before tax, annualized, % 11.1 11.0 10.4
Free cash flow 4 74 -95 43 136 -68 339
18 Half-Year Financial Review 2017
© Metso
Cash flow and financial position
June 30, 2017 Dec 31, 2016
Return on equity (ROE), annualized, % 10.2 9.0
Return on capital employed (ROCE) before taxes, annualized, % 11.1 10.4
Gearing at the end of the period, % 7.5 -1.8
Cash conversion, % 61 261
Equity to assets ratio at the end of the period, % 45.9 48.0
Debt to capital, % 39.0 35.6
Net debt / EBITDA 0.3 -0.1
Interest cover (EBITDA) 9.0 7.4
Cash assets 629 698
19 Half-Year Financial Review 2017
© Metso
132
121
0
50
100
150
200
South and Central America
orders
EUR million
148
165
0
50
100
150
200
Asia-Pasific orders
EUR million
153 155
0
50
100
150
200
North America orders
EUR million238 234
0
50
100
150
200
250
EMEA orders
EUR million
Orders were EUR 194 million and +19%
+ Good activity continued in several regions
+ Equipment orders +36%, services flat
Geographical figures in Q2/2017
Mining
Orders were EUR 342 million and -15%
+ Services orders +12% with increase across the
services offering
+ Recovery more visible in the equipment
business
Flow ControlAggregates
Orders were EUR 174 million and +4%
+ Orders from oil & gas as well as pulp & paper
customers slightly higher
+ Pumps grew significantly
20
Minerals sales +6%
Flow Control sales -2%
North America
23% of sales
EMEA
35% of sales
Minerals sales flat
Flow Control sales -1%
Asia-Pacific
24% of sales
Minerals sales +16%
Flow Control sales -3%
South and Central America
18% of sales
Minerals sales flat
Flow Control sales flat
-2% +12% -9%+2%
Half-Year Financial Review 2017

Metso 2017 H1 Half-year Review presentation

  • 1.
  • 2.
    © Metso2 Forward lookingstatements It should be noted that certain statements herein which are not historical facts, including, without limitation, those regarding expectations for general economic development and the market situation, expectations for customer industry profitability and investment willingness, expectations for company growth, development and profitability and the realization of synergy benefits and cost savings, and statements preceded by ”expects”, ”estimates”, ”forecasts” or similar expressions, are forward looking statements. These statements are based on current decisions and plans and currently known factors. They involve risks and uncertainties which may cause the actual results to materially differ from the results currently expected by the company. Such factors include, but are not limited to: 1) general economic conditions, including fluctuations in exchange rates and interest levels which influence the operating environment and profitability of customers and thereby the orders received by the company and their margins 2) the competitive situation, especially significant technological solutions developed by competitors 3) the company’s own operating conditions, such as the success of production, product development and project management and their continuous development and improvement 4) the success of pending and future acquisitions and restructuring. Half-Year Financial Review 2017
  • 3.
    © Metso© Metso 50 150 250 350 450 550 650 750 0 2 4 6 8 10 12 14 Losttime incident frequency (LTIF) Risk observation frequency 3 Safety is a key driver throughout our value chain Demand from customers: License to operate People Encourages employee commitment and motivation Productivity Improves productivity and lowers quality costs Partnership Improves stakeholder recognition as a sustainable partner Half-Year Financial Review 2017 LTIF 2.5 * * Rolling 12 months as of June 30, 2017
  • 4.
    © Metso© Metso Quarterlyhighlights Matti Kähkönen President and CEO 4 Half-Year Financial Review 2017
  • 5.
    © Metso Half-YearFinancial Review 20175 Q2/2017 in brief Healthy market activity continued with improvement in mining equipment Sales are not yet reflecting the growth in orders Profitability was affected mainly by low sales and mix Good progress in strategic initiatives
  • 6.
    © Metso 433 444423 441 496 480 1.06 1.01 1.02 1.00 1.17 1.08 0.0 0.4 0.8 1.2 1.6 0 200 400 Q1/16 Q2/16 Q3/16 Q4/16 Q1/17 Q2/17 EUR million Services sales Services orders received Services book-to-bill 56 77 77 64 66 70 9.3 11.5 12.1 9.4 10.2 10.4 0 5 10 15 20 0 20 40 60 80 Q1/16 Q2/16 Q3/16 Q4/16 Q1/17 Q2/17 EUR million Adjusted EBITA Adjusted EBITA % % 601 671 638 676 648 675 -20 -15 -10 -5 0 5 10 15 20 0 200 400 600 Q1/16 Q2/16 Q3/16 Q4/16 Q1/17 Q2/17 EUR million Sales Sales growth y-on-y % 663 761 628 672 733 749 1.10 1.13 0.98 0.99 1.13 1.11 0.0 0.4 0.8 1.2 1.6 0 200 400 600 800 Q1/16 Q2/16 Q3/16 Q4/16 Q1/17 Q2/17 EUR million Orders received Book-to-bill Q2/2017 financial highlights Profitability slightly disappointing Services orders grew 8%; positive book-to-bill continued 6 Good order intake without large orders Sales are not yet reflecting the order growth -11%-18% -10%-6% +8% +1% Half-Year Financial Review 2017 Incl. large mining order of MEUR 90 No large mining orders
  • 7.
    © Metso Half-YearFinancial Review 20177 Short-term market outlook for 2017 Mining 45% of sales 80% services * Aggregates 25% of sales 45% services * Flow Control 25% of sales 60% services * satisfactory good good good good Equipment Equipment Equipment ServicesServicesServices Previously: weak * Based on 12 months rolling sales good
  • 8.
    © Metso Half-YearFinancial Review 20178 Current topics in the second quarter Good progress in growth initiatives − Investments in assembly capacity of Lokotracks in Finland, and in the manufacturing of crusher wear parts in South Africa totaling EUR 4.5 million − Continued expansion of distribution network in Flow Control and Aggregates Digital strategy proceeding according to plan − Platform was chosen to create new industry-leading IoT solutions for mining and aggregates customers New President and CEO and changes in management team − Nico Delvaux will start as the new President and CEO on August 1 − Victor Tapia started as President of Minerals Capital on June 1
  • 9.
    © Metso© Metso Financialperformance Eeva Sipilä CFO 9 Half-Year Financial Review 2017
  • 10.
    © Metso© Metso 169168 136 136 173 174 1.14 1.01 0.84 0.88 1.09 1.14 0.0 0.4 0.8 1.2 1.6 0 50 100 150 200 Q1/16 Q2/16 Q3/16 Q4/16 Q1/17 Q2/17 EUR million Orders received Book-to-bill 494 593 492 536 560 575 1.09 1.18 1.03 1.03 1.14 1.10 0.0 0.4 0.8 1.2 1.6 0 200 400 600 Q1/16 Q2/16 Q3/16 Q4/16 Q1/17 Q2/17 EUR million Orders received Book-to-bill Orders were healthy in both segments Orders increased 12%, adjusting for the big order in the comparison period Mining supported by customers’ focus on productivity Aggregates equipment orders increased Pump orders up in Flow Control 10 Minerals: Productivity focus of customers supports growth in replacement and services orders Flow Control: Healthy order intake in valves while pumps improved significantly Half-Year Financial Review 2017 Incl. large mining order of MEUR 90 No large mining orders
  • 11.
    © Metso© Metso 37 54 52 47 43 55 8.2 10.810.8 9.1 8.9 10.5 0 5 10 15 20 0 20 40 60 Q1/16 Q2/16 Q3/16 Q4/16 Q1/17 Q2/17 EUR million Adjusted EBITA Adjusted EBITA % % 453 504 477 522 489 523 -20 -15 -10 -5 0 5 10 15 20 0 200 400 600 Q1/16 Q2/16 Q3/16 Q4/16 Q1/17 Q2/17 EUR million Minerals Services sales Minerals Equipment sales Sales growth y-on-y % Minerals: Aggregates’ improvement offset by mining Sales driven by double-digit growth in aggregates equipment; other businesses flat Mining services margins affected by higher raw material prices and sales mix -10%-20% -9%-5% +8% 11 +4% Half-Year Financial Review 2017
  • 12.
    © Metso© Metso 19 22 28 2625 1612.8 13.2 17.5 16.6 15.6 10.8 0 5 10 15 20 25 0 10 20 30 Q1/16 Q2/16 Q3/16 Q4/16 Q1/17 Q2/17 EUR million Adjusted EBITA Adjusted EBITA % % 148 167 161 155 159 152 -20 -15 -10 -5 0 5 10 15 20 0 50 100 150 200 Q1/16 Q2/16 Q3/16 Q4/16 Q1/17 Q2/17 EUR million Flow Control Services sales Flow Control Equipment sales Sales growth y-on-y % Flow Control: H1 performance flat with positive book-to-bill Sales reflecting H2/16 order intake Low sales and related under-absorption as well as sales mix impacted profitability -14%-13% -14%-10% +7% 12 -9% Half-Year Financial Review 2017
  • 13.
    © Metso© Metso 176 196 181184 184 187 29.2 29.2 28.4 27.2 28.4 27.7 0 5 10 15 20 25 30 0 50 100 150 200 250 Q1/16 Q2/16 Q3/16 Q4/16 Q1/17 Q2/17 EUR million Gross profit Gross margin % 126 130 125 135 126 127 20.9 19.4 19.6 20.0 19.5 18.8 0 5 10 15 20 25 0 50 100 150 200 Q1/16 Q2/16 Q3/16 Q4/16 Q1/17 Q2/17 EUR million SGA SGA % % Differing trending in Q2 margins Gross margin in the second quarter reflected : - the mix in both segments, - raw material pressure in Minerals and - under-absorption in Flow Control. SG&A costs were stable and as % of sales trending downwards 13 Half-Year Financial Review 2017
  • 14.
    © Metso© Metso 480 240 207 153 91 174 70 -25-63 100 -0.3 0.0 0.3 0.6 0.9 1.2 1.5 -100 100 300 500 Q1/15 Q2/15 Q3/15 Q4/15 Q1/16 Q2/16 Q3/16 Q4/16 Q1/17 Q2/17 EUR million Net debt Net debt/EBITDA 124 120 129 83 59 103 103 127 58 46 0 100 200 300 400 500 0 50 100 150 Q1/15 Q2/15 Q3/15 Q4/15 Q1/16 Q2/16 Q3/16 Q4/16 Q1/17 Q2/17 EUR million Cash flow from operations Cash flow from operations, rolling 12 months Balance sheet continues to be strong Free cash flow affected mainly by EUR 56 million increase of net working capital Paid income taxes totaled EUR 37 million Dividend of EUR 157 million paid in April Maturity structure of debt was extended - New EUR 300 million bond issued - EUR 205 million of the 2019 outstanding EUR 400 million bond purchased back 14 Half-Year Financial Review 2017
  • 15.
    © Metso© Metso 1,4451,411 1,290 1,268 1,300 1,399 1,305 1,320 1,396 1,411 0 500 1,000 1,500 2,000 Q1/15 Q2/15 Q3/15 Q4/15 Q1/16 Q2/16 Q3/16 Q4/16 Q1/17 Q2/17 EUR Million Flow Control backlog Minerals Services backlog Minerals Equipment backlog Order backlog increased Our backlog at end of June for 2017 deliveries totaled approximately EUR 1 billion Deliveries for the remainder of the year higher compared to the end of June 2016 - We continue to expect some postponements to planned delivery timetables Delivery timetableOrder backlog 15 Half-Year Financial Review 2017 Deliveries in2017 Deliveries after2017 Deliveries in2016 Deliveries after2016 0 500 1,000 1,500 Order backlog June 30, 2016 Order backlog June 30, 2017 EUR million
  • 16.
  • 17.
    © Metso© Metso Appendix 17Half-Year Financial Review 2017
  • 18.
    © Metso Key figures EURmillion Q2/2017 Q2/2016 Change % H1/2017 H1/2016 Change % 2016 Orders received 749 761 -2 1,482 1,424 4 2,724 without currency effect -3 1 Orders received, services business 480 444 8 976 877 11 1,741 without currency effect 7 8 Sales 675 671 1 1,323 1,272 4 2,586 without currency effect 0 2 Sales, services business 445 439 1 868 848 2 1,703 without currency effect 0 -1 Adjusted EBITA 70.0 77.3 -9 136.5 133.0 3 274.0 % of sales 10.4 11.5 10.3 10.5 10.6 Operating profit 59.8 69.3 -14 119.2 119.7 0 227.1 Earnings per share, EPS, EUR 0.24 0.28 -14 0.47 0.46 2 0.87 Return on capital employed (ROCE), before tax, annualized, % 11.1 11.0 10.4 Free cash flow 4 74 -95 43 136 -68 339 18 Half-Year Financial Review 2017
  • 19.
    © Metso Cash flowand financial position June 30, 2017 Dec 31, 2016 Return on equity (ROE), annualized, % 10.2 9.0 Return on capital employed (ROCE) before taxes, annualized, % 11.1 10.4 Gearing at the end of the period, % 7.5 -1.8 Cash conversion, % 61 261 Equity to assets ratio at the end of the period, % 45.9 48.0 Debt to capital, % 39.0 35.6 Net debt / EBITDA 0.3 -0.1 Interest cover (EBITDA) 9.0 7.4 Cash assets 629 698 19 Half-Year Financial Review 2017
  • 20.
    © Metso 132 121 0 50 100 150 200 South andCentral America orders EUR million 148 165 0 50 100 150 200 Asia-Pasific orders EUR million 153 155 0 50 100 150 200 North America orders EUR million238 234 0 50 100 150 200 250 EMEA orders EUR million Orders were EUR 194 million and +19% + Good activity continued in several regions + Equipment orders +36%, services flat Geographical figures in Q2/2017 Mining Orders were EUR 342 million and -15% + Services orders +12% with increase across the services offering + Recovery more visible in the equipment business Flow ControlAggregates Orders were EUR 174 million and +4% + Orders from oil & gas as well as pulp & paper customers slightly higher + Pumps grew significantly 20 Minerals sales +6% Flow Control sales -2% North America 23% of sales EMEA 35% of sales Minerals sales flat Flow Control sales -1% Asia-Pacific 24% of sales Minerals sales +16% Flow Control sales -3% South and Central America 18% of sales Minerals sales flat Flow Control sales flat -2% +12% -9%+2% Half-Year Financial Review 2017