Download to read offline
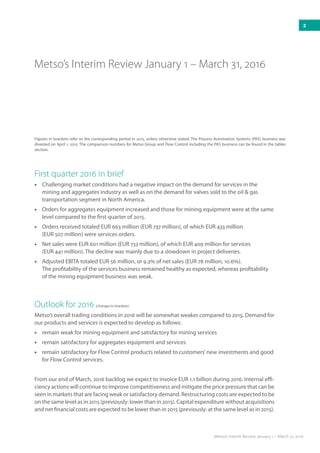
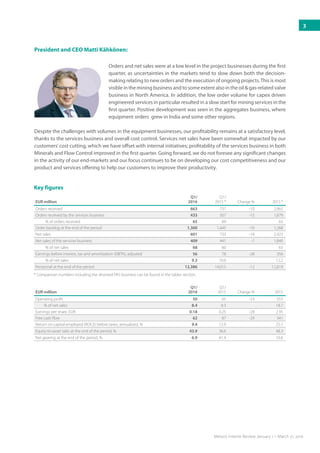
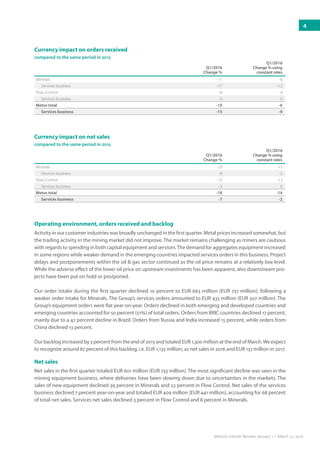
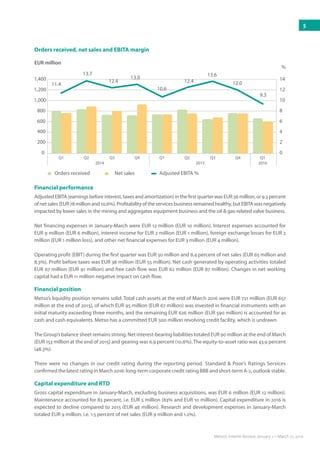
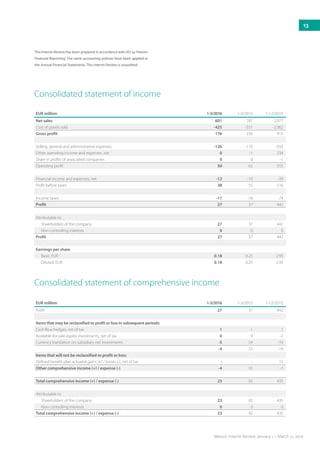

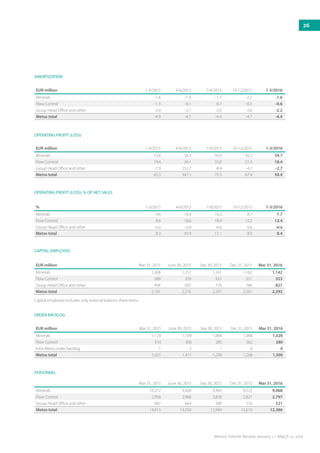


Metso's orders received in the first quarter of 2016 totaled EUR 663 million, a 10% decline from the previous year, due to challenging market conditions in the mining and oil & gas industries that slowed demand. Net sales were EUR 601 million, down 18% year-over-year. Adjusted EBITA for the quarter was EUR 56 million, or 9.3% of net sales. While Metso expects demand to remain weak for mining equipment and satisfactory for related services, it will focus on cost efficiency and productivity to mitigate price pressures in weaker markets through 2016.


