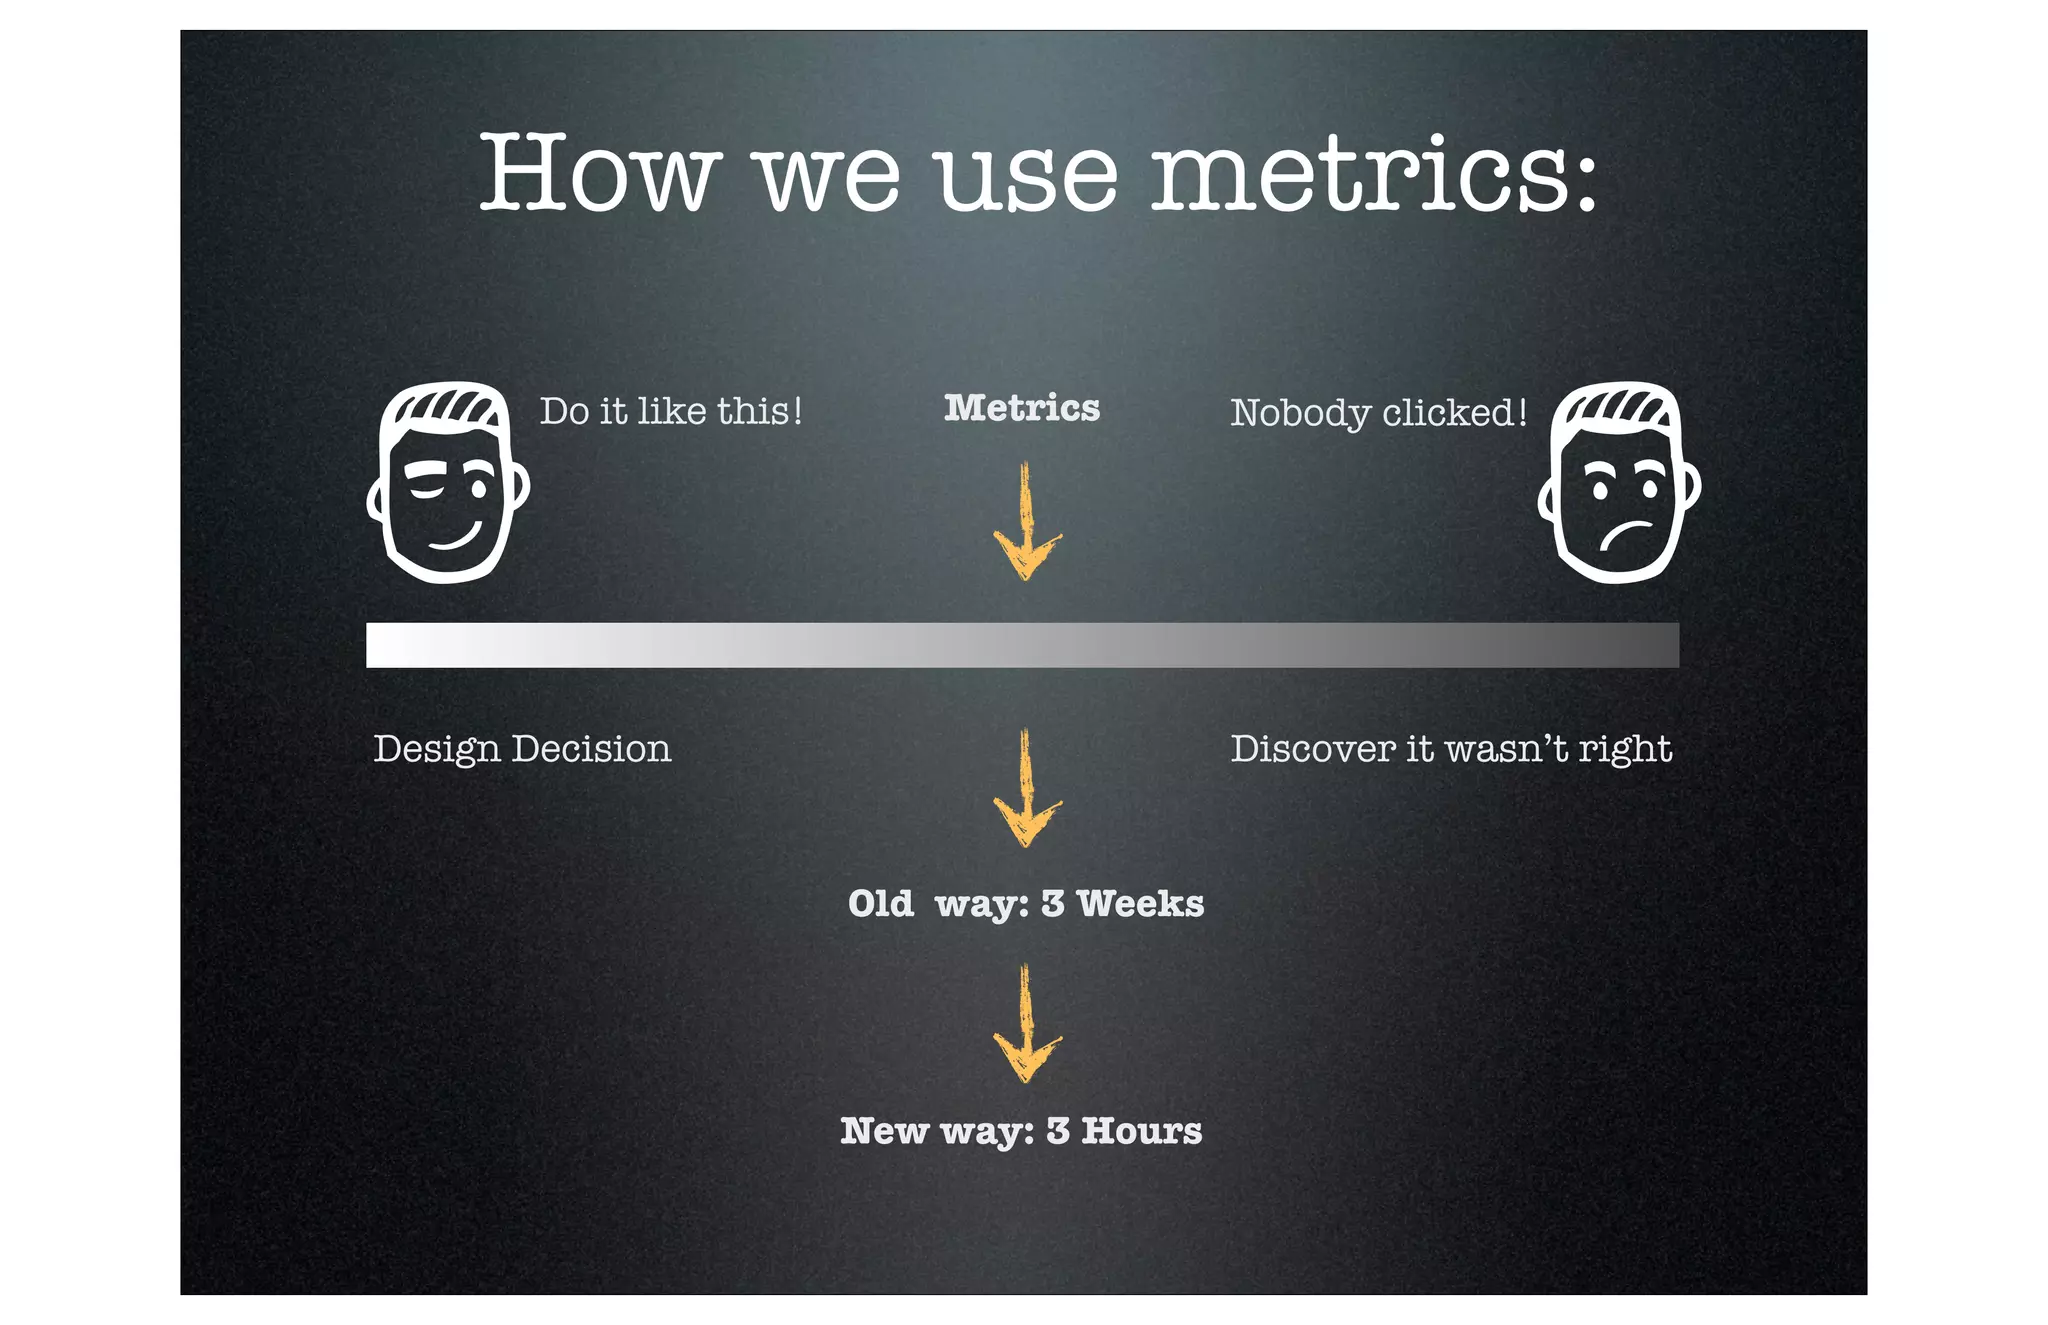
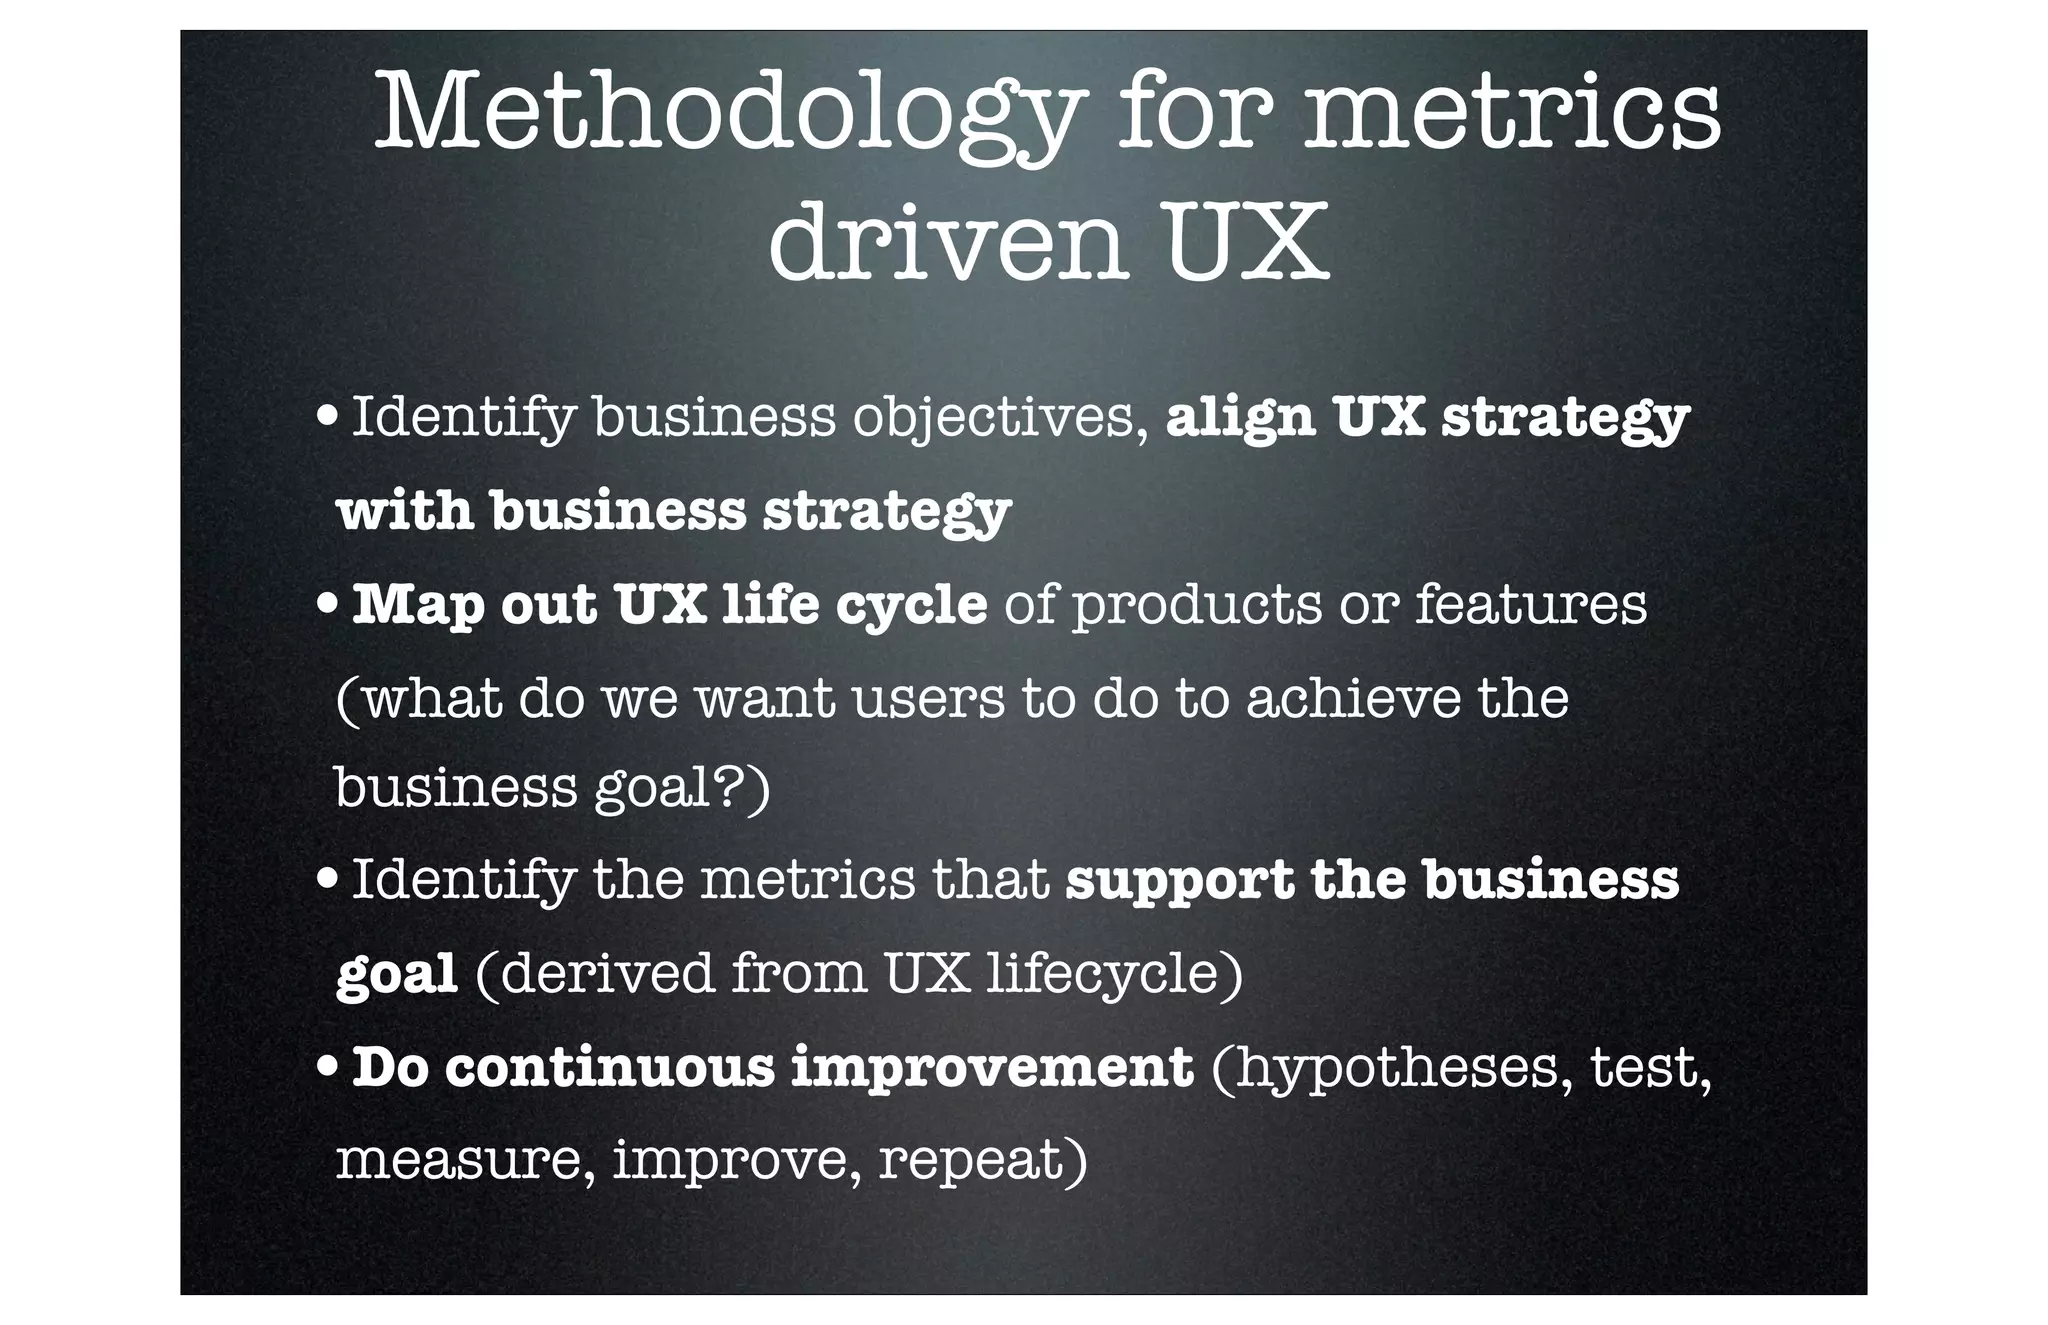
Metrics Driven UX
A balanced approach
Introduction
Well established
Lots of users

New
Not a lot of users
Revenue

Users
+ $100M
Paid Out

+ 100B
New Users
What is UX?
“User experience" (UX) encompasses all aspects of
the end-user's interaction with the company, its
services, and its product” - Jakub
What are metrics?
“A method of measuring something,
and the results obtained from this activity.”
Why metrics matter:

“You can't manage what you don't measure.”
- Edward Deming
Without metrics how do
you decide what to do?

“Prayer becomes the technique of choice with no
clear metrics” - Josh Bokardo
Metrics are the key
driver for Strategic UX
Business Strategy
Metrics

UX Strategy
How metrics help
us stay lean:
The old way

Metrics
The new way
How we use metrics:
Do it like this!

Metrics

Design Decision

Nobody clicked!

Discover it wasn’t right

Old way: 3 Weeks

New way: 3 Hours
What metrics do our
partners track?
A lot of them, starting
with:

•DAUs 
•MAUs
•ARPDAU
•Retention
•1 day
•3 day
•7 day
•Churn
•LTV
What Metrics do we
track?
A lot of them, starting
with:

•Revenue
•Hourly
•Daily
•Weekly
•Annual 
•Volume
•Customer Satisfaction
•Net Promoter Score
■

Revenue
How do small metrics
affect big metrics?
Macro:

•Company valuation
•Company financial performance
(trailing indicator of right strategy)
• Maketplace perception
•Platform performance 

Micro:
■

Revenue

•predictive analytics
•better targeting
•higher eCPMs
•higher quality conversions
•Ad unit performance (many instances)
•Ad performance
Methodology for metrics
driven UX
•Identify business objectives, align UX strategy
with business strategy

•Map out UX life cycle of products or features
(what do we want users to do to achieve the
business goal?)

•Identify the metrics that support the business
goal (derived from UX lifecycle)

•Do continuous improvement (hypotheses, test,
measure, improve, repeat)
■

Revenue
Examples
Subway Surfers

Small improvements to interaction design:
+ 250% higher conversions
My Singing Monsters

Psychology based adjustments to ad unit:
+ 85% higher conversions
Lead Gen Form

Simplify UX:
+ 35% completion & better quality leads
Summary
•Design is never finished
•Small adjustments based on real data yields huge
improvements over time

•Optimize incrementally, innovate in big leaps
•Metrics are used to confirm or deny hypotheses
not to drive them 

•If metrics are not actionable they probably aren't
useful

■

Revenue
How do you use metrics to
drive design decisions?

Others?
Thank You.
Andrew Korf • @andrewkorf
andrew.korf@nativex.com

Credits: Josh Bokardo, Leo Ciu, Eric Reis, Jakub Nielsen,
Edward Deming, Kyle Steed

Metrics Driven UX: A Balanced Approach

  • 1.
    Metrics Driven UX Abalanced approach
  • 2.
    Introduction Well established Lots ofusers New Not a lot of users Revenue Users + $100M Paid Out + 100B New Users
  • 3.
    What is UX? “Userexperience" (UX) encompasses all aspects of the end-user's interaction with the company, its services, and its product” - Jakub
  • 4.
    What are metrics? “Amethod of measuring something, and the results obtained from this activity.”
  • 5.
    Why metrics matter: “Youcan't manage what you don't measure.” - Edward Deming
  • 6.
    Without metrics howdo you decide what to do? “Prayer becomes the technique of choice with no clear metrics” - Josh Bokardo
  • 7.
    Metrics are thekey driver for Strategic UX Business Strategy Metrics UX Strategy
  • 8.
    How metrics help usstay lean: The old way Metrics The new way
  • 9.
    How we usemetrics: Do it like this! Metrics Design Decision Nobody clicked! Discover it wasn’t right Old way: 3 Weeks New way: 3 Hours
  • 10.
    What metrics doour partners track? A lot of them, starting with: •DAUs  •MAUs •ARPDAU •Retention •1 day •3 day •7 day •Churn •LTV
  • 11.
    What Metrics dowe track? A lot of them, starting with: •Revenue •Hourly •Daily •Weekly •Annual  •Volume •Customer Satisfaction •Net Promoter Score ■ Revenue
  • 12.
    How do smallmetrics affect big metrics? Macro: •Company valuation •Company financial performance (trailing indicator of right strategy) • Maketplace perception •Platform performance  Micro: ■ Revenue •predictive analytics •better targeting •higher eCPMs •higher quality conversions •Ad unit performance (many instances) •Ad performance
  • 13.
    Methodology for metrics drivenUX •Identify business objectives, align UX strategy with business strategy •Map out UX life cycle of products or features (what do we want users to do to achieve the business goal?) •Identify the metrics that support the business goal (derived from UX lifecycle) •Do continuous improvement (hypotheses, test, measure, improve, repeat) ■ Revenue
  • 14.
  • 15.
    Subway Surfers Small improvementsto interaction design: + 250% higher conversions
  • 16.
    My Singing Monsters Psychologybased adjustments to ad unit: + 85% higher conversions
  • 17.
    Lead Gen Form SimplifyUX: + 35% completion & better quality leads
  • 18.
    Summary •Design is neverfinished •Small adjustments based on real data yields huge improvements over time •Optimize incrementally, innovate in big leaps •Metrics are used to confirm or deny hypotheses not to drive them  •If metrics are not actionable they probably aren't useful ■ Revenue
  • 19.
    How do youuse metrics to drive design decisions? Others?
  • 20.
    Thank You. Andrew Korf• @andrewkorf andrew.korf@nativex.com Credits: Josh Bokardo, Leo Ciu, Eric Reis, Jakub Nielsen, Edward Deming, Kyle Steed