Download as PDF, PPTX


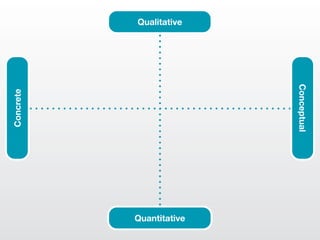
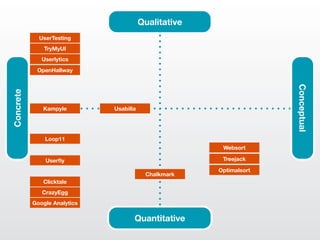
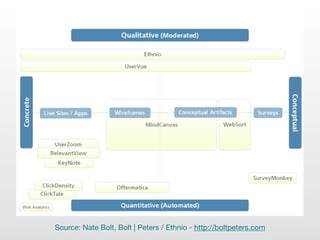
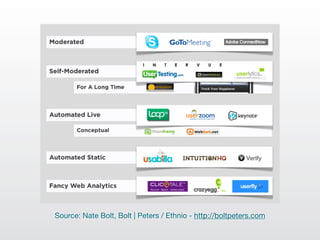
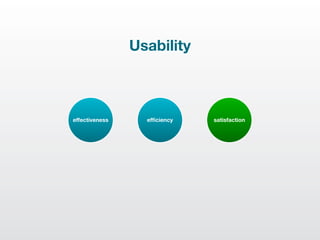
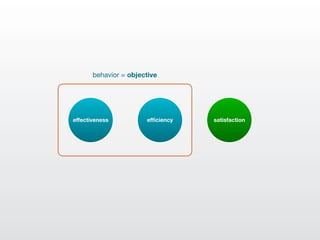
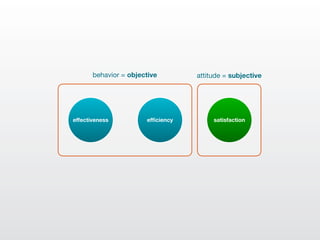


This document discusses the evolution of quantifying user experience over time. It traces the development of tools and methods for observing user behavior from pen and paper tests in the 1980s to modern remote usability testing platforms in 2009. Both qualitative and quantitative methods are examined, ranging from conceptual attitude-based approaches to concrete behavior-based metrics. The document advocates combining both qualitative and quantitative data sources to develop a robust understanding of user experience.