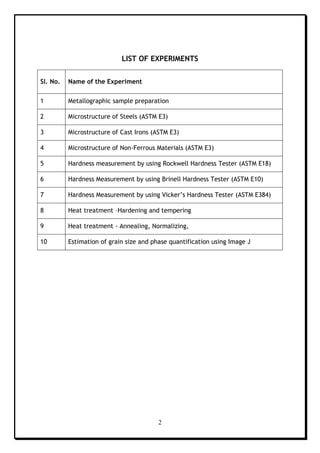
In the material testing laboratory, a Charpy impact test was performed on three different types (hot,cold,and steel alloy)of steels testing each variety at four different temperatures (32°C(RT), 100°C,0°C and -22°C ). From results (shown below), we determined that the a transition is from ductile failures to brittle failures
In the material testing laboratory, Tensile test was done on a mild steel specimen as figure 4 to identify the young’s modulus, ultimate tensile strength, yield strength and percentage elongation. The results were as table 1
A major cost factor in the production of and component or assembly is its assembly. This section looks at some commonly used techniques which a designer can employ to ensure that assembly is cost effective and efficient. This is then linked to the use of jigs and fixtures for this purpose.
This is my Lab Report of Tensile Test when I was conducting engineering material lab in Sampoerna University. Feel free to download for a reference.
I know it is not a good report, but I hope this share might help you to find something you need.
Thank you.
Study on Influence of heat treatment on Tribological properties of mild steeldbpublications
A study was made on the effect of heat treatment upon the mild steel. Total six samples were prepared for each test (hardness test, tensile test, microstructure test and wear test) from those two was tested as received and rest four were subjected to different heat treatment that are annealing and normalizing (heated on a temperature of 850 degree Celsius). The hardness of all sample was measured by Rockwell hardness testing machine. Wear measurement was done on pin-on disc wear machine. Tensometer was used to find out the ultimate stress and strain of the sample. The result of tensile test showed that the strength is decreased by heat treating and the surface hardness is also decreased by heat treatment. Microstructure of the mild steel specimens shows the grain boundary of the particles and the content of % of carbon present. It justifies the experimental results of tensile test and hardness test. Surface Hardness is the measure of resistance that any material applies. As the specimen gets soft on treating the hardness also gets decreased. Tensile strength of any specimen is specified as how much stress the material can withstand before breaking. As the metal gets soft after heat treatment the load required for breaking goes on decreasing. Wear test is carried out to see the variation in wear measurement and coefficient of friction as the mesh size of paper are varied. More soft the surface of material is more wear is seen and vice-versa.
High Performance Nanocomposites for Mechanical Application: Design, Preparati...Alessio Passalacqua
To effectively design polymer nanocomposites for industrial applications, it is necessary to understand the effects of nanoparticles on final proprieties of the polymers. In this project, systematic studies are carried out on the variability of the structural and mechanical properties as function of the different used nanofiller. Furthermore, the overall mission is to find a correlation between the structural and mechanical changes with the tribological proprieties of thermoplastic nanocomposite due to the inclusion of nanoparticle. This will allow to design nanocomposite materials by selecting ad hoc nanofillers in order to increase their efficiency for mechanical engineering and metal replacement applications.
EFFECT OF SHORT GLASS FIBER AND FILLERS ON DRY SLIDING WEAR BEHAVIOUR OF THER...IAEME Publication
The dry sliding wear behaviour of thermoplastic copolyester elastomer (TCE) reinforced with fibers and fillers were slid against a steel counter face of a pin-on-disc tribometer. The filler and fiber reinforcements used are polytetrafluroethylene (PTFE), short glass fiber (SGF), short carbon fiber (SCF), silicon carbide (SiC), and alumina (Al2O3). The parameters like filler content, sliding velocity and sliding distance on the specific wear rate have been investigated. In this study, a plan of experiments based on the techniques of Taguchi was performed to acquire data in a controlled way.
Experimental Analysis using Established Parameters for Cryogenic Treatment on...IJAEMSJORNAL
The experimental analysis on cutting tool material is done with referring the established parameters for Cryogenic Treatment. The pilot experimentation is carried out using the Conventional heat treated tool bits as supplied condition and Cryogenic treated tools. The three grades of high speed steel are identified for the investigation purpose and for pilot experimentation H.S.S. T42 grade is selected. The tool material procured is strictly as per the grade specifications for the investigation of effect of cryogenic treatment on tool life. The established parameters for cryogenic treatment are identified referring to previous published research and machining parameters as per the industry specifications. The pilot experimentation using Untreated and treated tools are subjected to turning operation on CNC turning center for a definite work material and machining parameters such as cutting speed, feed and depth of cut are identified. Single point cutting Tool geometry is maintained as per the tool signature and length of the tool is maintained as per the limitations of the machine. The Surface Roughness of the machined work piece is measured using the Taylor Hob-son Surface Roughness tester and the Tool wear is measured using the Tool Makers microscope. The results are tabulated. An experimental effort to understand the effect of Untreated and Cryogenic treated tool on the tool life is the outcome of this paper. The outcome of this paper forms the basis of experimentation using the Orthogonal array for all the selected grades of the material.
Analysis Of The Structure Of A Material Used In The Manufacture Of Thermal Ch...IJERA Editor
The dynamic stability of machine has its own importance in the quality of the machined product. With the development of new technologies for cutting tools, as the geometries and materials, cutting speeds used today reach values inconceivable for two decades. In the automotive industry steel and cast iron are gradually being replaced by lower density material and even lower costs. In complex shapes tools, heterogeneous material removal in roughing, sudden changes of sections, etc. Stress relieving treatment should be carried out to minimize dimensional variations of form during quenching and tempering. Materials for manufacture of thermal fixing most appropriate for that operating system still needs to be further investigated. Therefore, this study investigated the elastic behavior of the material used in the manufacture of tooling systems for cutting tools. Has been evaluated In fastening system, the temperature variation exerted on the mandrel body region and the thermal expansion where H13 steel can withstand the assembly process by thermal interference. This method can determine the amount of number of cycles until the onset of fatigue that material.
A study on the mechanical properties of s45 c medium type carbon steel specim...eSAT Journals
Abstract The experimental process is a fundamental technique used to determine the nature and behavior of many materials under study. In order to evaluate the fundamental properties of many engineering materials the use of mechanical testing techniques frequently play a crucial role. The development of new materials and the control of material quality are essential in the process of design and in their usage for industrial applications and construction. In this experiment, there were 2 sets (5 samples each) of medium type steel specimens S45C of 0.45% carbon content that were rigorously prepared according to ASTM standards under specific varied parameters. These parameters include the machining cutter speeds on the lathe machine and the mediums selected and temperatures set for the quenching process on the steel specimens in order to affect their overall microstructure. The specimens were then subjected to aggregate mechanical loading using a conventional tensile testing machine. The consequential effect of material structure metamorphosis under the selected quenching techniques was ultimately not part of the study as it involves microscopic analysis of grain boundaries and high-end precision equipment would be necessary to do any significant material analysis. The results of the experiment suggest that the macroscopic (not microscopic) effect of the lathe machining speeds do not significantly affect the tensile material strength of the S45 medium carbon steel specimen. Thus, the mediums and temperatures selected for the quenching process on the specimens had a marginal but significant effect on the elevated levels of tensile mechanical strength and strain of medium type carbon steel. Keywords: mechanical properties, carbon steel, lathe machine, S45C, quenching process, tensile test, stress, strain.
Significance and Need of Computational Analysis and Finite Element Modelling ...ijceronline
Composite materials are the cutting edge materials that possess unrestrained opportunities for advanced material science and development. Thermal studies of composite materials are gaining greater impetus in the present scenario. This will help to comprehend the properties of materials as they change with temperature. The thermal characterization of hybrid composites has been progressively more important in a wide range of applications. The coefficient of thermal expansion, thermal conductivity, specific heat capacity, latent heat and thermal diffusivity are the most important properties of composite materials. Since nearly all composites are used in various temperature ranges, measurement of coefficient of thermal expansion (CTE) and thermal conductivity as a function of temperature is necessary in order to know the behaviour of the material. Thermal characterization and analysis of hybrid composites will depend on the factors that influence on the prominent thermo-physical properties presents a major challenge since they are sensitive to the type of reinforcement and method of manufacture. This research paper emphasizes the significance, need, applications and scope of computational investigation and finite element analysis of composite materials
The International Journal of Engineering & Science is aimed at providing a platform for researchers, engineers, scientists, or educators to publish their original research results, to exchange new ideas, to disseminate information in innovative designs, engineering experiences and technological skills. It is also the Journal's objective to promote engineering and technology education. All papers submitted to the Journal will be blind peer-reviewed. Only original articles will be published.
The papers for publication in The International Journal of Engineering& Science are selected through rigorous peer reviews to ensure originality, timeliness, relevance, and readability.
Hierarchical Digital Twin of a Naval Power SystemKerry Sado
A hierarchical digital twin of a Naval DC power system has been developed and experimentally verified. Similar to other state-of-the-art digital twins, this technology creates a digital replica of the physical system executed in real-time or faster, which can modify hardware controls. However, its advantage stems from distributing computational efforts by utilizing a hierarchical structure composed of lower-level digital twin blocks and a higher-level system digital twin. Each digital twin block is associated with a physical subsystem of the hardware and communicates with a singular system digital twin, which creates a system-level response. By extracting information from each level of the hierarchy, power system controls of the hardware were reconfigured autonomously. This hierarchical digital twin development offers several advantages over other digital twins, particularly in the field of naval power systems. The hierarchical structure allows for greater computational efficiency and scalability while the ability to autonomously reconfigure hardware controls offers increased flexibility and responsiveness. The hierarchical decomposition and models utilized were well aligned with the physical twin, as indicated by the maximum deviations between the developed digital twin hierarchy and the hardware.
Water billing management system project report.pdfKamal Acharya
Our project entitled “Water Billing Management System” aims is to generate Water bill with all the charges and penalty. Manual system that is employed is extremely laborious and quite inadequate. It only makes the process more difficult and hard.
The aim of our project is to develop a system that is meant to partially computerize the work performed in the Water Board like generating monthly Water bill, record of consuming unit of water, store record of the customer and previous unpaid record.
We used HTML/PHP as front end and MYSQL as back end for developing our project. HTML is primarily a visual design environment. We can create a android application by designing the form and that make up the user interface. Adding android application code to the form and the objects such as buttons and text boxes on them and adding any required support code in additional modular.
MySQL is free open source database that facilitates the effective management of the databases by connecting them to the software. It is a stable ,reliable and the powerful solution with the advanced features and advantages which are as follows: Data Security.MySQL is free open source database that facilitates the effective management of the databases by connecting them to the software.
We have compiled the most important slides from each speaker's presentation. This year’s compilation, available for free, captures the key insights and contributions shared during the DfMAy 2024 conference.
KuberTENes Birthday Bash Guadalajara - K8sGPT first impressionsVictor Morales
K8sGPT is a tool that analyzes and diagnoses Kubernetes clusters. This presentation was used to share the requirements and dependencies to deploy K8sGPT in a local environment.
Harnessing WebAssembly for Real-time Stateless Streaming PipelinesChristina Lin
Traditionally, dealing with real-time data pipelines has involved significant overhead, even for straightforward tasks like data transformation or masking. However, in this talk, we’ll venture into the dynamic realm of WebAssembly (WASM) and discover how it can revolutionize the creation of stateless streaming pipelines within a Kafka (Redpanda) broker. These pipelines are adept at managing low-latency, high-data-volume scenarios.
Understanding Inductive Bias in Machine LearningSUTEJAS
This presentation explores the concept of inductive bias in machine learning. It explains how algorithms come with built-in assumptions and preferences that guide the learning process. You'll learn about the different types of inductive bias and how they can impact the performance and generalizability of machine learning models.
The presentation also covers the positive and negative aspects of inductive bias, along with strategies for mitigating potential drawbacks. We'll explore examples of how bias manifests in algorithms like neural networks and decision trees.
By understanding inductive bias, you can gain valuable insights into how machine learning models work and make informed decisions when building and deploying them.
HEAP SORT ILLUSTRATED WITH HEAPIFY, BUILD HEAP FOR DYNAMIC ARRAYS.
Heap sort is a comparison-based sorting technique based on Binary Heap data structure. It is similar to the selection sort where we first find the minimum element and place the minimum element at the beginning. Repeat the same process for the remaining elements.
Design and Analysis of Algorithms-DP,Backtracking,Graphs,B&B
MEE1005 Lab Manual Fall 2018-19
1. 1
MATERIALS ENGINEERING AND TECHNOLOGY LAB
(MEE1005)
B. Tech, Mechanical Engineering
School of Mechanical & Building Sciences
Vellore Institute of Technology, Chennai
Chennai – 600127, Tamilnadu.
VIT – A Place to learn: A Chance to grow
Lab Manual
2. 2
LIST OF EXPERIMENTS
Sl. No. Name of the Experiment
1 Metallographic sample preparation
2 Microstructure of Steels (ASTM E3)
3 Microstructure of Cast Irons (ASTM E3)
4 Microstructure of Non-Ferrous Materials (ASTM E3)
5 Hardness measurement by using Rockwell Hardness Tester (ASTM E18)
6 Hardness Measurement by using Brinell Hardness Tester (ASTM E10)
7 Hardness Measurement by using Vicker’s Hardness Tester (ASTM E384)
8 Heat treatment –Hardening and tempering
9 Heat treatment - Annealing, Normalizing,
10 Estimation of grain size and phase quantification using Image J
3. 3
GENERAL INSTRUCTIONS
1. Every student should obtain a copy of the laboratory manual
2. Dress code: Students must come to the laboratory wearing: (1) trousers, (ii) half-sleeve
tops and (iii) Leather shoes. Half pants, loosely hanging garments and slippers are not
allowed
3. To avoid any injury, the student must take the permission of the laboratory staffs
before handling the machines.
4. Every student is required to handle the equipments with care.
5. Students must ensure that their work areas are clean before and after finishing the
work.
6. At the end of the experiments, the student must take initials from the staff.
7. Laboratory report must be submitted in given format provided by faculty.
8. Each member of a group must submit lab report even if the experiment was performed
in a group.
9. The lab report must contain: (i) Title of the experiment, (ii) Three to four lines stating
the objectives, (iii) Name of all equipments/tools used along with one line description of
its use and (iv) neatly labeled sketch of the observed jobs with few lines of description.
10. Student should get the job/workpiece checked by faculty.
11. Careless handling of machine/equipment/tools will not be tolerated.
12. Safely return the tools issued to you back to concerned lab assistant/in-charge.
Laboratory Safety
For this laboratory, students are required to strictly follow the safety instructions given
below.
1. Wear long pants, closed toe shoes (no sandals or shoes with openings, flip flops, open
shoes, or bare feet), a lab coat.
2. Wear safety glasses with side shields during laboratory sessions.
3. Other personal protection equipments typical for job will be provided (ex: gloves,
welding goggles, dust protection masks etc.)
Specific safety issues related to each lab is included in the lab descriptions and will be
discussed prior to beginning each lab
In this lab, students will be working with sharp tools, hot liquid metals, saws, grinders,
and electrical power.
4. 4
The main rule is that if any action or event appears to be unsafe, stop and seek assistance
from the instructor and/or lab assistant before proceeding.
It is better to question rather than have an accident.
Laboratory Notebook Basics
For this course, it is essential that students document the following as all these
components are important in writing lab reports: (1) what the experiment was, (2) what
equipment was used, (3) what materials were used, (3) how much of each material was
used, (4) brief description of the experiment conducted, (5) observations, (6) data
collected, (7) appropriate plots and calculations, (8) Comments that include conclusions,
concerns, and questions about results, (9) list of laboratory partners, and (10) legibility
and neatness.
ALL data must be recorded in the notebook including units. If the data is recorded
digitally, then you should print them out and include in your notebook and/or provide the
name of the file and its location so the data may be retrieved. Computer generated plots
and raw data, micrographs, photos, or other information can be attached to the notebook
to supplement the written information. Comments on the data and experiments will
help produce good laboratory reports. For example, notations on physical changes in the
materials during processing, information gathered from other sources such as technical
journal articles, mistakes and corrections made, deviations from laboratory manual
descriptions, and anything else that will help in writing a laboratory report. It does take
additional time to keep a good lab notebook but the benefits are well worth it in
time saved later.
Laboratory Notebook Grading:
20% Neatness and Legible,
20% Experimental Description,
20% Observations and Comments,
20% Data Collection,
20% Data Analysis including plots, calculations, and conclusions drawn.
5. 5
Introduction to Processing and Microstructure
Materials Engineering and Science is based on the interrelationship between
Processing, Properties, and Structure of Materials. All items used in daily life
including bed, bath, kitchen, vehicles, office/work/lab, and entertainment
equipment are made out of materials. It is our discipline that provides the know-
how to produce these items in a cost effective manner that meets the
performance requirements. The discipline of Materials Engineering and Science is
often described by the Structure-Processing-Properties diagram shown in Figure 1.
The structure of materials is examined on all scales: atomic, cluster or nanometer,
micro, macro, and device/component. By manipulating structure at the
appropriate scale through processing techniques, the performance of a material
for a particular application is obtained. Materials selection and performance from
synthesis/extraction to recycling/disposal is a result of the synergism between
structure-processing-properties. All courses within the Materials Engineering and
Technology (MEE1005) curriculum address aspects of this interrelationship.
6. 6
Metallographic Sample Preparation
Objectives:
1. Familiarization with the procedure for preparation of a material specimen
for microscopic examination.
2. Familiarization with compound optical microscopes and metallography.
3. Examination of surface characteristics of engineering materials.
Background:
The preparation of a metallurgical specimen generally can be divided into a series
of stages: sectioning, mounting, grinding and polishing, and etching.
Sectioning
Sectioning is the removal of a small representative volume of material from the
parent piece. The microstructure of the material must not be altered in the
process. Cold work and heat are the two most likely conditions that can quickly
bring about structure changes. Quite obviously operations such as sawing that
generates heat or shearing that introduces cold work are not preferable for
sectioning. Cutting using a bonded abrasive wheel with coolant offers the best
solution to minimize or eliminate heat and deformation.
Mounting
Metallurgical specimens are mounted primarily for (1) convenience in handling and
(2) protection and preservation during subsequent grinding and polishing. Two
methods are frequently used: compression mounting and cold mounting.
Compression mounting is done by mounting the specimen in a cylinder of hard
polymer under pressure and elevated temperature in a molding machine. The
method is often preferred when speed and a relatively hard mounting is required.
For metallurgical examination, specimens are usually molded in cylinders 1, 1¼, or
1½ inches in diameter. Compression molding materials are (1) thermosetting or (2)
thermoplastic polymers. Bakelite and diallyl phthalate fall into the first category
while transoptic material into the second. By definition, thermosetting materials
require heat and pressure during the molding cycle, and therefore may be ejected
at high molding temperature. Transoptic materials remain molten at high
7. 7
temperature and become transparent with increasing pressure and decreasing
temperature. Molding pressure, temperature, and time duration are the major
variables involved in compression mounting. By equipment design, temperature
may be held constant leaving pressure and time duration as variables. Cold
mounting is done by placing the specimen at the center of a metal or pyrex ring on
a glass plate and pouring liquid mounting material into the ring to cover the
specimen. Allow the mounting material to cure at room temperature for 60 to 90
minutes before removing the ring. The method offers particular advantages when a
specimen is too delicate to withstand the pressure and heat involved in
compression molding. With cold mounting, large groups of specimens may be easily
prepared in a short time. Common types of cold mounting material include (1)
epoxides (2) polyesters and (3) acrylics. These materials are two-component types
consisting of a resin and a hardener. Since the curing process (polymerization) is
an exothermic reaction the mixing by volume or weight ratios of each type is
critical.
Grinding and Polish
Grinding and polish are accomplished by sequential coarse grinding, medium
grinding, and rough and final polishing. The specimen should be carefully rinsed
before proceeding from one operation to the next. Coarse grinding is done on a
wet-belt grinder with 120 and 240 grit belts. The purpose of coarse grinding is to
obtain a flat surface free from previous cutting tool marks. Medium grinding is
accomplished using successively finer grits of metallographic grinding paper. The
paper is supported on a hard, flat surface such as glass or steel. The specimen is
moved along the length of grinding paper without rotation or a rocking motion.
When grinding is completed on one grit the scratches should all run in the same
direction. Before proceeding to the next finer grit the specimen should be washed
to avoid brining large particles to the finer grit. The specimen is rotated 90
degrees between grits so that scratches from each successively finer grit run at
right angles to those from the previous one. The polishing on a grit is complete
when coarser scratches from previous grit have been totally removed. Rough and
final polishing is accomplished on cloth-covered wheels charged with fine abrasive
alumina particles suspended in water. Nylon cloth and 1.0-mm alumina particle
size are used for the rough polish; a velvet cloth and 0.05-mm particle size for the
8. 8
final polish. A few drops of water are added to the rotating wheel to improve
polishing action and cleanliness. Initially the specimen is held at one position on
the wheel, without rotation, until most of the previous grinding marks are
removed. The specimen can then be rotated slowly, counter to the wheel rotation,
until only scratches from the alumina are visible. The final polish should be
completed at a slow speed on a different polishing wheel.
Etching
The specimen surface is fairly smooth immediately after the final polish. A smooth
surface deflects lights from the illuminator in the metallurgical microscope along
the same direction showing no contrast and cannot reveal surface characteristics.
Surface characteristics such as different phases, inclusions, porosity, cracks,
intergranular corrosion can be revealed by etching. Etching is defined as the
process to reveal structural details by preferential attack of a metal surface with
an acid or other chemical solutions.
The following table lists the most commonly used etchants
Etchant Composition Conc. Conditions Comments
ASTM No. 30
Ammonia
Hydrogen
Peroxide (3%)
DI Water
62.5 ml
125 ml
62.5 ml
Mix Ammonia and
water before
adding peroxide.
Must be used fresh.
Swab 5-45 seconds
For etching copper,
copper alloys and
copper-silver
alloys.
Adler Etchant
Copper
ammonium
chloride
Hydrochloric
acid
Ferric chloride,
hydrated
DI Water
9 grams
150 ml
45 grams
75 ml
Immersion is
recommended for
several seconds
For etching 300
series stainless
steel and Hastelloy
superalloys
Carpenters
Stainless
Steel Etch
FeCl3
CuCl2
Hydrochloric
acid
Nitric acid
Ethanol
8.5 grams
2.4 grams
122 ml
6 ml
122 ml
Immersion etching
at 20 degrees
Celsius
For etching duplex
and 300 series
stainless steels.
Kalling's No. 2
CuCl2
Hydrochloric
5 grams
100 ml
Immersion or
swabbing etch at 20
For etching duplex
and 400 series
9. 9
acid
Ethanol
100 ml degrees Celsius stainless steels and
Ni-Cu alloys and
superalloys.
Kellers Etch
Distilled water
Nitric acid
Hydrochloric
acid
Hydrofluoric acid
190 ml
5 ml
3 ml
2 ml
10-30 second
immersion. Use
only fresh etchant
Excellent for
aluminum and
titanium alloys.
Klemm's
Reagent
Sodium
thiosulfate
solution
Potassium
metabisulfite
250 ml
Saturated
5 grams
Etch for a few
seconds to minutes
For etching alpha-
beta brass, bonze,
tin, cast iron
phosphides, ferrite,
martensite,
retained austenite,
zinc and steel
temper
embrittlement.
Kroll’s
Reagent
Distilled water
Nitric acid
Hydrofluoric acid
92 ml
6 ml
2 ml
Swab specimen up
to 20 seconds
Excellent for
titanium and alloys.
Nital
Ethanol
Nitric acid
100 ml
1-10 ml
Immersion up to a
few minutes.
Most common
etchant for Fe,
carbon and alloys
steels and cast iron
- Immerse sample
up from seconds to
minutes; Mn-Fe,
MnNi, Mn-Cu, Mn-Co
alloys.
Marble's
Reagent
CuSO4
Hydrochloric
acid
Water
10 grams
50 ml
50 ml
Immerse or swab
for
5-60 seconds.
For etching Ni, Ni-
Cu and Ni-Fe alloys
and superalloys.
Add a few drops of
H2SO4 to increase
activity.
Murakami's
K3Fe(CN)6
KOH
Water
10 grams
10 grams
100 ml
Pre-mix KOH and
water before
adding
K3Fe(CN)6
Cr and alloys (use
fresh and
immerse); iron and
steels reveals
carbides; Mo and
alloys uses fresh
and immerse; Ni-Cu
alloys for alpha
phases use at 75
10. 10
Celcius; W and
alloys use fresh and
immerse; WC-Co
and complex
sintered carbides.
Picral
Ethanol
Picric acid
100 ml
2-4 grams
Seconds to minutes
Do not let etchant
crystallize or dry –
explosive
Recommended for
microstructures
containing ferrite,
carbide, pearlite,
martensite and
bainite. Also useful
for magnetic alloys,
cast iron, high alloy
stainless steels and
magnesium.
Vilella’s
Reagent
Picric Acid
Hydrochloric
acid
Ethanol
1 gram
5 ml
100 ml
Seconds to minutes
Good for ferrite-
carbide structures
(tempered
martensite) in iron
and steel
Experimental Procedure:
1. Obtain a steel specimen from the instructor and remove as much surface
scale as possible.
2. The steel specimen has been heat treated to form a desired structure for
this exercise.
3. Mount the specimen in a phenolic cylinder using a compression mounting
press.
4. Watch carefully the demonstration of the use of compression mounting
press.
5. Appropriate molding pressure and time should be used in the process.
6. Prepare the specimen by coarse grinding on a wet-belt grinder, hand
polishing on four successively finer grits of polishing paper, and fine
polishing on two polishing wheels with 1.0-mm and 0.05-mm alumina
powders. Rinse the specimen thoroughly between steps.
7. Etch the steel specimen by immersing it in a nital solution (5% concentrated
nitric acid in alcohol). Start with 5 seconds of immersion. Rinse the
11. 11
specimen with water, dry with paper towel, immerse briefly in alcohol, and
blow dry the specimen with a blow dryer.
8. Examine the specimen under microscope and identify the surface features.
The specimen surface may be overetched or underetched. An overetched
specimen surface shows patches of dark color with no identifiable features.
On the other hand, a shiny, smooth surface with little or no surface features
revealed indicates an underetch. Repeat the final polishing to remove the
damaged surface and etching for less time if the specimen is overetched. In
the case of underetch, repeat the etching step to enhance the contrast.
Microscope Focusing Procedure
1. Initially the lowest power objective lens is used for focusing the specimen.
Turn the lowest-power objective lens into place. If necessary, turn the
coarse stage height control to lower the sample stage to make room so the
objective lens can be turned into place.
2. Turn the stage height focusing control to position the specimen about half a
centimeter under the objective lens.
3. Look through the eyepieces and use the focusing controls (coarse and fine
stage height controls) to bring the specimen into appropriate focus.
4. Scan the specimen surface by moving the stage using the stage position
controls and select the areas that may warrant more complete study at
higher magnification.
5. Turn the higher-power objective into place.
6. Adjust the stage height using the fine control until the specimen comes into
sharp focus.
7. Be sure that the objective lens does not touch the specimen surface at any
time. Otherwise the objective lens may be scratched and permanently
damaged.
8. A drop of oil on specimen surface usually is needed at higher magnification
(greater than X2000) to help with focusing.
Assignments:
1. Watch the demonstration of specimen preparation and microscope operation
procedures carefully.
12. 12
2. Obtain a sample from the instructor and prepare the sample for microscopic
examination following the procedure of mounting, grinding, polishing,
etching, observation under a microscope, and photographing.
3. Keep a hard copy (photograph) of the sample as observed under the
microscope.
4. Include the photograph in the report and identify all the features observed.
13. 13
Microstructure of Hypoeutectoid and Hypereutectoid steels
THEORY
Plain carbon steels are steels having carbon as the predominant alloying element
and the other alloying elements are either Nil or negligible though some amount of
sulphur and phosphorous are present. Normally the amounts are less than 0.05
percent and hence they are not considered. The plain carbon steels are broadly
classified in to low carbon steels with carbon content less than 0.3 percent and
medium carbon steels contain Carbon between 0.3 to 0.7 percent. The high carbon
steels contain carbon from 0.7 to 1.5 percent.
PROCEDURE:
The specimens of pure metals like Mild steel, Low carbon steel and high carbon
steels are mounted in a thermosetting material as explained in the previous
section of metallographic sample preparation.
Polish
The specimen by using (80, 120, 240, 400 and 600) grade emery papers. Subject
the given specimen to mirror like finish by using disc polishing machine and with
suitable abrasive. Clean the specimen with alcohol and wash it under the stream of
flowing water. After washing the specimen is dried. After drying apply the suitable
etching agent for 30 to 60 sec. After etching wash the specimen under the stream
of flowing water. Dry the specimen with the help of air blower. Place the
specimen under the microscope for metallurgical studies. Draw the micro structure
and identify the material for the given specimen.
LOW CARBON STEEL:
As the microstructure shows the structure of the mild steel, it contains 25%
pearlite and 75% ferrite. The dark region defines the pearlite and bright portion is
of ferrite. The properties of low carbon steels are
The material is soft and ductile
It is easily weldable
It is cold workable
14. 14
The tensile strength varies between 390 to 550 N/ mm2
The Brinell hardness number varies from 115 to 140.
The application includes making steel wire, sheets, rivets, screws, pipe chain and
structural parts.
MEDIUM CARBON STEEL:
The microstructure reveals two phases are to be about 50% each. Hence the carbon
content can be accessed to be equal to it. The properties of medium carbon steels
are invariably between low and high carbon steels. The tensile strength varies
between 75 to 800 N/ mm2
The medium carbon steels are used in manufacture of
drop forging dies, die block plates, punches, screws and valve springs etc.
HIGH CARBON STEEL:
Microstructure of high carbon steels consists of continuous network of cementite in
matrix to pearlite. This cementite structure is hard and brittle and hence has poor
machinability. As carbon content increases weldability and cold working decreases.
They have high strength and hardness. Its Tensile strength is up to 1400 N/mm2
hardness varies from 450 to 500 BHN. High carbon steels are used in cutting
machine tools, manufacturing cold dies and wheels for railways.
PRECAUTIONS:
1) Polishing should be slow, sooth and flat.
2) Uniform pressure is applied throughout the polishing.
16. 16
Heat Treatment
Heat Treating is the process of heating and cooling a steel to obtain desired
properties.
Various types of heat treatment processes are used to change the following
properties or conditions of the steel:
- Improve the toughness - Improve the machinability
-Increase the hardness - Refine the grain structure -Increase the ductility - Remove
the residual stresses
- Improve the wear resistance
Quenching
- The process of cooling austenite very rapidly or at a controlled rate to achieve a
desired microstructure.
* The rapid cooling suppresses the formation of austenite to α + Fe3C
- Quenching of austenite produces martensite, which is used for applications that
demand a hard material (e.g. knives, razor blades, surgery tools, cutting tools,
etc).
* When austenite + ferrite is quenched, all of the austenite transforms completely
to martensite while the ferrite remains unchanged.
* When austenite + cementite is quenched, again all of the austenite completely
transforms into martensite while the cementite remains unchanged.
17. 17
1. Hardening
Hardening is the process of austenitizing a steel at a prescribed temperature,
holding at that temperature for a length of time to ensure homogeneity in the
austenite, and then quenching at a rate fast enough to prevent transformation to
any product other than martensite.
The cooling rate that just produces an entirely martensitic structure is the critical
cooling rate (CCR). Therefore, this rate must be exceeded to ensure
transformation of all the austenite to martensite.
* A range of quenchants can be used:
- Order of severity: 5% caustic soda, 5-10% brine, cold water, warm water, mineral
oil, animal oil, vegetable oil
- Note: Quenching into oils may produce bainite rather than martensite
* Steels with less than 0.25 wt.%C cannot be hardened by quenching because the
nose of the TTT
Quench Severity
Quenching effectiveness is substantially increased by agitation. Agitation of the
part and/or the quenchant increases the rate of heat transfer between the
quenchant and the surface of the part. The quench severity (H) is an indication of
18. 18
how effective a specific quenchant is. It correlates directly to the thermal stresses
set up in the heat-treated part. Some typical values of H are:
2. Tempering
- The process of re-heating the as-quenched (martensitic) steel to increase
softness and ductility.
* Steel is heated above A1, quenched rapidly at a rate fast enough to miss the nose
(or knee) of the TTT diagram to form martensite, and re-heated at a temperature
below A1 to achieve the desired tempered hardness. Alloying elements generally
slow down tempering.
* When martensite is tempered above 250 °C, all martensite disappears and is
replaced by ferrite and finely dispersed cementite.
Note: The new structure is not pearlite. It is called tempered martensite. To get
back pearlite, you have to re-austenitize the steel and cool appropriately to obtain
pearlite.
* When a steel is kept at a temperature between 400 °C and 727 °C for a long
period of time (> 24 hours), the carbide balls up forming what is called
spheroidized carbide.
19. 19
Quenching and tempering process for a plain-carbon steel.
Effect of Tempering on Mechanical Properties of Steels
* Improves toughness
* Increases ductility
* Reduces hardness (softens the steel)
20. 20
Hardness Measurement
What is Hardness?
Hardness is the property of a material that enables it to resist plastic deformation,
usually by penetration. However, the term hardness may also refer to resistance to
bending, scratching, abrasion or cutting.
Measurement of Hardness:
Hardness is not an intrinsic material property dictated by precise definitions in
terms of fundamental units of mass, length and time. A hardness property value is
the result of a defined measurement procedure. Hardness of materials has
probably long been assessed by resistance to scratching or cutting. An example
would be material B scratches material C, but not material A. Alternatively,
material A scratches material B slightly and scratches material C heavily. Relative
hardness of minerals can be assessed by reference to the Moh's Scale that ranks the
ability of materials to resist scratching by another material. Similar methods of
relative hardness assessment are still commonly used today. An example is the file
test where a file tempered to a desired hardness is rubbed on the test material
surface. If the file slides without biting or marking the surface, the test material
would be considered harder than the file. If the file bites or marks the surface, the
test material would be considered softer than the file. The above relative hardness
tests are limited in practical use and do not provide accurate numeric data or
scales particularly for modern day metals and materials. The usual method to
achieve a hardness value is to measure the depth or area of an indentation left by
an indenter of a specific shape, with a specific force applied for a specific time.
There are three principal standard test methods for expressing the relationship
between hardness and the size of the impression, these being Brinell, Vickers, and
Rockwell. For practical and calibration reasons, each of these methods is divided
into a range of scales, defined by a combination of applied load and indenter
geometry.
Hardness Test Methods:
Rockwell Hardness Test
Brinell Hardness Test
21. 21
Vickers Hardness Test
Microhardness Test
Rockwell Hardness Test
The Rockwell hardness test method consists of indenting the test material with a
diamond cone or hardened steel ball indenter. The indenter is forced into the test
material under a preliminary minor load F0 (Fig. 1A) usually 10 kgf. When
equilibrium has been reached, an indicating device, which follows the movements
of the indenter and so responds to changes in depth of penetration of the
indenter, is set to a datum position. While the preliminary minor load is still
applied an additional major load is applied with resulting increase in penetration
(Fig. 1B). When equilibrium has again been reach, the additional major load is
removed but the preliminary minor load is still maintained. Removal of the
additional major load allows a partial recovery, so reducing the depth of
penetration (Fig. 1C). The permanent increase in depth of penetration, resulting
from the application and removal of the additional major load is used to calculate
the Rockwell hardness number.
24. 24
Advantages of the Rockwell hardness method include the direct Rockwell hardness
number readout and rapid testing time. Disadvantages include many arbitrary non-
related scales and possible effects from the specimen support anvil (try putting a
cigarette paper under a test block and take note of the effect on the hardness
reading! Vickers and Brinell methods don't suffer from this effect).
The Brinell Hardness Test
The Brinell hardness test method consists of indenting the test material with a 10
mm diameter hardened steel or carbide ball subjected to a load of 3000 kg. For
softer materials the load can be reduced to 1500 kg or 500 kg to avoid excessive
indentation. The full load is normally applied for 10 to 15 seconds in the case of
iron and steel and for at least 30 seconds in the case of other metals. The
diameter of the indentation left in the test material is measured with a low
powered microscope. The Brinell harness number is calculated by dividing the load
applied by the surface area of the indentation.
25. 25
The diameter of the impression is the average of two readings at right angles and
the use of a Brinell hardness number table can simplify the determination of the
Brinell hardness. A well structured Brinell hardness number reveals the test
conditions, and looks like this, "75 HB 10/500/30" which means that a Brinell
Hardness of 75 was obtained using a 10mm diameter hardened steel with a 500
kilogram load applied for a period of 30 seconds. On tests of extremely hard
metals a tungsten carbide ball is substituted for the steel ball. Compared to the
other hardness test methods, the Brinell ball makes the deepest and widest
indentation, so the test averages the hardness over a wider amount of material,
which will more accurately account for multiple grain structures and any
irregularities in the uniformity of the material. This method is the best for
achieving the bulk or macro-hardness of a material, particularly those materials
with heterogeneous structures.
Vickers Hardness Test
The Vickers hardness test method consists of indenting the test material with a
diamond indenter, in the form of a right pyramid with a square base and an angle
of 136 degrees between opposite faces subjected to a load of 1 to 100 kgf. The full
load is normally applied for 10 to 15 seconds. The two diagonals of the indentation
left in the surface of the material after removal of the load are measured using a
microscope and their average calculated. The area of the sloping surface of the
indentation is calculated. The Vickers hardness is the quotient obtained by dividing
the kgf load by the square mm area of indentation.
26. 26
When the mean diagonal of the indentation has been determined the Vickers
hardness may be calculated from the formula, but is more convenient to use
conversion tables. The Vickers hardness should be reported like 800 HV/10, which
27. 27
means a Vickers hardness of 800, was obtained using a 10 kgf force. Several
different loading settings give practically identical hardness numbers on uniform
material, which is much better than the arbitrary changing of scale with the other
hardness testing methods. The advantages of the Vickers hardness test are that
extremely accurate readings can be taken, and just one type of indenter is used
for all types of metals and surface treatments. Although thoroughly adaptable and
very precise for testing the softest and hardest of materials, under varying loads,
the Vickers machine is a floor standing unit that is more expensive than the Brinell
or Rockwell machines.
There is now a trend towards reporting Vickers hardness in SI units (MPa or GPa)
particularly in academic papers. Unfortunately, this can cause confusion. Vickers
hardness (e.g. HV/30) value should normally be expressed as a number only
(without the units kgf/mm2
). Rigorous application of SI is a problem. Most Vickers
hardness testing machines use forces of 1, 2, 5, 10, 30, 50 and 100 kgf and tables
for calculating HV. SI would involve reporting force in newtons (compare 700
HV/30 to HV/294 N = 6.87 GPa) which is practically meaningless and messy to
engineers and technicians. To convert a Vickers hardness number the force applied
needs converting from kgf to newtons and the area needs converting form mm2
to
m2
to give results in pascals using the formula above.
To convert HV to MPa multiply by 9.807
To convert HV to GPa multiply by 0.009807
28. 28
Estimation of grain size and phase quantification using Image J
Note: Students are advised to download and install ImageJ software (open source)
in their PCs/laptops and go through the complete manual of ImageJ software to
learn by themselves. The below given portion is only representative