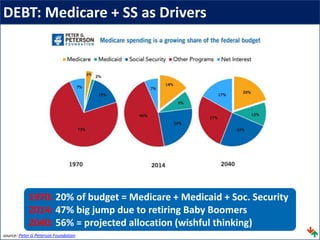
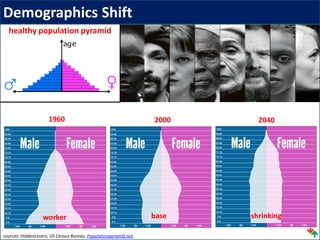
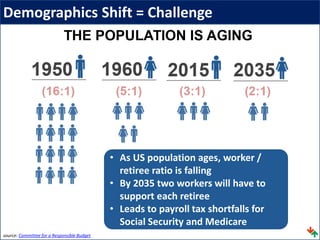
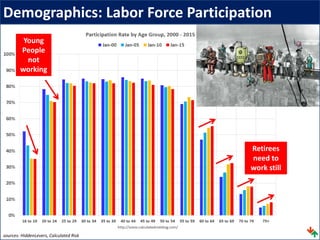
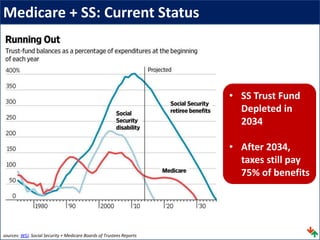
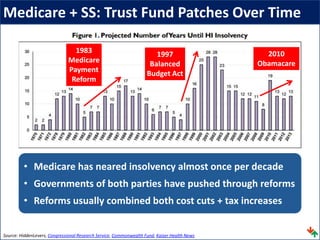
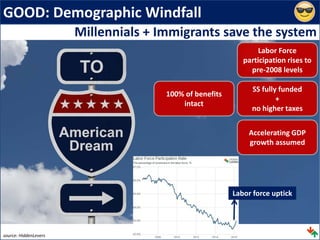
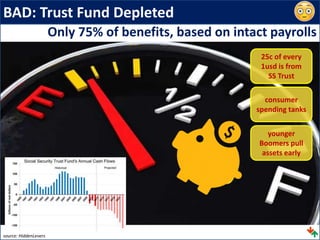
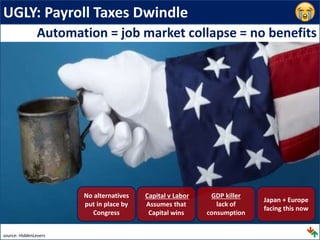
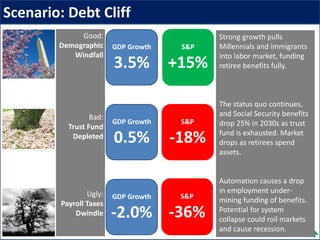
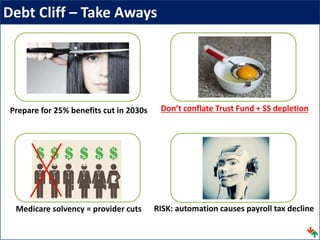
Medicare + SS Anxiety
27 April 2016
War Room
HiddenLevers War Room
Open Q + A
Macro Coaching
Archived webinars
CE Credit
Idea Generation
Presentation deck
AccountabilityScenario Updates
Market Update
US Govt Debt
Medicare + SS
Scenario: Debt Cliff
Medicare + SS Anxiety
UPDATED
HiddenLevers
MARKET UPDATE
Market Update
sources: HiddenLevers, USA Today, Int’l Spectator, Economist
1 Commodity Bounce
2016 GDP Winners
India 7.5%
Vietnam 6.6%
China 6.4%
Pilipines 6.3%
Malaysia 5.5%
Indonesia 5.1%
Pakistan 4.8%
Egypt 4.0%
3
Apartment Boom2
Oil +60%
Gold +4%
Oil -52%
Gold -16%
HiddenLevers
GOVERNMENT DEBT
DEBT: US in Global Context
sources: Thompson Reuters, WSJ
• USA = average OECD debtor
• Japan still an outlier
• PIIGS entitlements weigh
DEBT: Debt to GDP
sources: Peter G. Peterson
DEBT: Medicare + SS as Drivers
1970: 20% of budget = Medicare + Medicaid + Soc. Security
2014: 47% big jump due to retiring Baby Boomers
2040: 56% = projected allocation (wishful thinking)
source: Peter G Peterson Foundation
HiddenLevers
MEDICARE + SOCIAL SECURITY
healthy population pyramid
Demographics Shift
sources: HiddenLevers, US Census Bureau, Populationpyramid.net,
1960 2000 2040
worker base shrinking
Demographics Shift = Challenge
source: Committee for a Responsible Budget
• As US population ages, worker /
retiree ratio is falling
• By 2035 two workers will have to
support each retiree
• Leads to payroll tax shortfalls for
Social Security and Medicare
Demographics: Labor Force Participation
sources: HiddenLevers, Calculated Risk
Young
People
not
working
Retirees
need to
work still
Medicare + SS: Current Status
sources: WSJ. Social Security + Medicare Boards of Trustees Reports
• SS Trust Fund
Depleted in
2034
• After 2034,
taxes still pay
75% of benefits
Medicare + SS: Trust Fund Patches Over Time
Source: HiddenLevers, Congressional Research Service, Commonwealth Fund, Kaiser Health News
2010
Obamacare
1997
Balanced
Budget Act
1983
Medicare
Payment
Reform
• Medicare has neared insolvency almost once per decade
• Governments of both parties have pushed through reforms
• Reforms usually combined both cost cuts + tax increases
HiddenLevers
SCENARIO: DEBT CLIFF
GOOD: Demographic Windfall
source: HiddenLevers
Millennials + Immigrants save the system
SS fully funded
+
no higher taxes
Labor Force
participation rises to
pre-2008 levels
Accelerating GDP
growth assumed
Labor force uptick
100% of benefits
intact
BAD: Trust Fund Depleted
Only 75% of benefits, based on intact payrolls
source: HiddenLevers
consumer
spending tanks
younger
Boomers pull
assets early
25c of every
1usd is from
SS Trust
UGLY: Payroll Taxes Dwindle
No alternatives
put in place by
Congress
source: HiddenLevers
GDP killer
lack of
consumption
Automation = job market collapse = no benefits
Capital v Labor
Assumes that
Capital wins
Japan + Europe
facing this now
Scenario: Debt Cliff
Good:
Demographic
Windfall
Bad:
Trust Fund
Depleted
Ugly:
Payroll Taxes
Dwindle
GDP Growth
-2.0%
S&P
-36%
GDP Growth
0.5%
S&P
-18%
GDP Growth
3.5%
Strong growth pulls
Millennials and immigrants
into labor market, funding
retiree benefits fully.
The status quo continues,
and Social Security benefits
drop 25% in 2030s as trust
fund is exhausted. Market
drops as retirees spend
assets.
Automation causes a drop
in employment under-
mining funding of benefits.
Potential for system
collapse could roil markets
and cause recession.
S&P
+15%
Debt Cliff – Take Aways
Medicare solvency = provider cuts RISK: automation causes payroll tax decline
Don’t conflate Trust Fund + SS depletionPrepare for 25% benefits cut in 2030s

Medicare + SS Anxiety

  • 1.
    Medicare + SSAnxiety 27 April 2016 War Room
  • 2.
    HiddenLevers War Room OpenQ + A Macro Coaching Archived webinars CE Credit Idea Generation Presentation deck AccountabilityScenario Updates
  • 3.
    Market Update US GovtDebt Medicare + SS Scenario: Debt Cliff Medicare + SS Anxiety UPDATED
  • 4.
  • 5.
    Market Update sources: HiddenLevers,USA Today, Int’l Spectator, Economist 1 Commodity Bounce 2016 GDP Winners India 7.5% Vietnam 6.6% China 6.4% Pilipines 6.3% Malaysia 5.5% Indonesia 5.1% Pakistan 4.8% Egypt 4.0% 3 Apartment Boom2 Oil +60% Gold +4% Oil -52% Gold -16%
  • 6.
  • 7.
    DEBT: US inGlobal Context sources: Thompson Reuters, WSJ • USA = average OECD debtor • Japan still an outlier • PIIGS entitlements weigh
  • 8.
    DEBT: Debt toGDP sources: Peter G. Peterson
  • 9.
    DEBT: Medicare +SS as Drivers 1970: 20% of budget = Medicare + Medicaid + Soc. Security 2014: 47% big jump due to retiring Baby Boomers 2040: 56% = projected allocation (wishful thinking) source: Peter G Peterson Foundation
  • 10.
  • 11.
    healthy population pyramid DemographicsShift sources: HiddenLevers, US Census Bureau, Populationpyramid.net, 1960 2000 2040 worker base shrinking
  • 12.
    Demographics Shift =Challenge source: Committee for a Responsible Budget • As US population ages, worker / retiree ratio is falling • By 2035 two workers will have to support each retiree • Leads to payroll tax shortfalls for Social Security and Medicare
  • 13.
    Demographics: Labor ForceParticipation sources: HiddenLevers, Calculated Risk Young People not working Retirees need to work still
  • 14.
    Medicare + SS:Current Status sources: WSJ. Social Security + Medicare Boards of Trustees Reports • SS Trust Fund Depleted in 2034 • After 2034, taxes still pay 75% of benefits
  • 15.
    Medicare + SS:Trust Fund Patches Over Time Source: HiddenLevers, Congressional Research Service, Commonwealth Fund, Kaiser Health News 2010 Obamacare 1997 Balanced Budget Act 1983 Medicare Payment Reform • Medicare has neared insolvency almost once per decade • Governments of both parties have pushed through reforms • Reforms usually combined both cost cuts + tax increases
  • 16.
  • 17.
    GOOD: Demographic Windfall source:HiddenLevers Millennials + Immigrants save the system SS fully funded + no higher taxes Labor Force participation rises to pre-2008 levels Accelerating GDP growth assumed Labor force uptick 100% of benefits intact
  • 18.
    BAD: Trust FundDepleted Only 75% of benefits, based on intact payrolls source: HiddenLevers consumer spending tanks younger Boomers pull assets early 25c of every 1usd is from SS Trust
  • 19.
    UGLY: Payroll TaxesDwindle No alternatives put in place by Congress source: HiddenLevers GDP killer lack of consumption Automation = job market collapse = no benefits Capital v Labor Assumes that Capital wins Japan + Europe facing this now
  • 20.
    Scenario: Debt Cliff Good: Demographic Windfall Bad: TrustFund Depleted Ugly: Payroll Taxes Dwindle GDP Growth -2.0% S&P -36% GDP Growth 0.5% S&P -18% GDP Growth 3.5% Strong growth pulls Millennials and immigrants into labor market, funding retiree benefits fully. The status quo continues, and Social Security benefits drop 25% in 2030s as trust fund is exhausted. Market drops as retirees spend assets. Automation causes a drop in employment under- mining funding of benefits. Potential for system collapse could roil markets and cause recession. S&P +15%
  • 21.
    Debt Cliff –Take Aways Medicare solvency = provider cuts RISK: automation causes payroll tax decline Don’t conflate Trust Fund + SS depletionPrepare for 25% benefits cut in 2030s