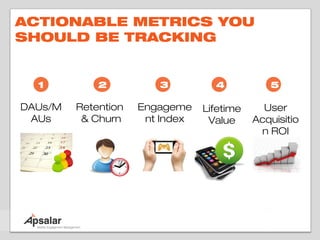
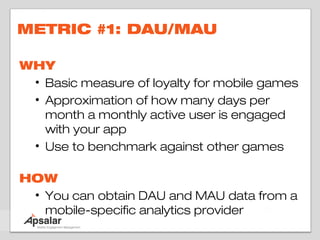
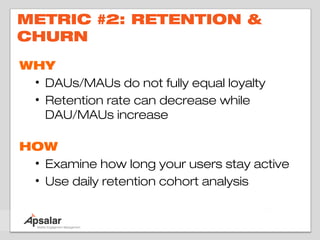
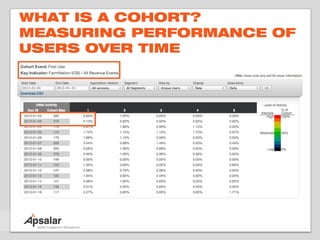
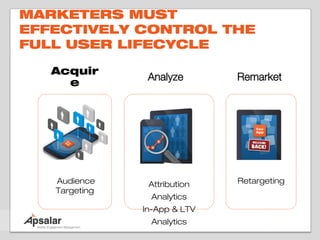
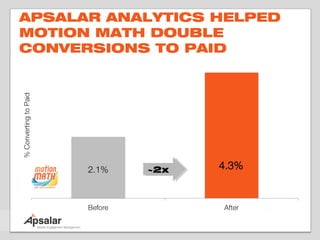
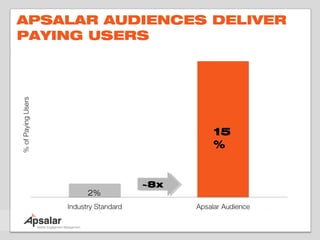
FROM DOWNLOAD TO
       DOMINATION
Engaging Mobile App Users with
   Analytics and Targeting


                   Michael Oiknine
                        CEO, Apsalar
                 michael@apsalar.com
THE MOBILE MINDSHARE WAR
LEADS TO…
 Discovery        Install     Engagement
  Problem                       Problem

                                         Used
                                         Weekly
                                               Used
                                                Daily

                                Rarely
                                Used


  1.3MM+ Apps in iOS & Android App Stores
   1.3MM+ Apps in iOS & Android App Stores
… AN ENGAGEMENT PROBLEM


   Average Sessions Per App Decreases by 20% Per
   Average Sessions Per App Decreases by 20% Per
                        User
                         User
           for Each Additional App Installed
            for Each Additional App Installed
… AND UNSUSTAINABLE
ECONOMICS


   Do Not Monetize
MARKETERS MUST
EFFECTIVELY CONTROL THE
FULL USER LIFECYCLE

   Acquir      Analyze
     e


   Audience     Attribution   Retargeting
   Targeting
                Analytics
               In-App & LTV
                Analytics
ACQUIRE
ALL USERS ARE NOT
CREATED EQUAL


98%+ of users spend nothing or very little in apps
MANY ACQUISITION METHODS
ARE EXPENSIVE -YET DON’T LEAD
TO PAYING USERS


    +56% CPI Increase on iOS since January
       +70% CPI Increase on Android
ACQUIRE THE RIGHT USERS
FOR YOUR APPS


 Get The Right Mobile App       Reach As Many Users As
 Users                          Possible
 •   Build highly targeted      •   Anytime, anywhere
     audiences                  •   Leverage partnerships with 3rd
 •   Acquire paying & engaged       party exchanges, networks,
     users                          RTB platforms
NOT ALL ACQUISITION
SOURCES ARE CREATED EQUAL-
ILLUSTRATION
                   Blind Ad    Incentivized   Audience     Retargeting
                   Network       Installs     Targeting   Existing Users
    Budget           $500         $500          $500          $500

Cost Per Install    $3 to $5    $0.5 to $1       $2            $1

     Users            100         1,000          250           500
% of Paying        Less than                  More than    More than
                               Less than 1%
   Users              2%                        10%          10%

Paying Users           2            10           25            50

 Sample ROI          -90%          -75%         +75%          +100%
AUDIENCE TARGETING DRIVES
PAYING USERS

                Target
               Lookalike
               Audience
ANALYZE
NICE! YOU HAVE USERS AND
THINK THEY’RE ENGAGED… OR
ARE THEY?


    Find out using mobile analytics
QUESTIONS YOU SHOULD BE
ABLE TO ANSWER

1. Who are my high value users?

2. What’s the lifetime value of my users?
3. How are changes in my app affecting revenue,
   engagement & monetization?
4. What’s the retention rate of my users?

5. What’s the ROI across each of my acquisition
   sources (ex. Facebook)?
ACTIONABLE METRICS YOU
SHOULD BE TRACKING


  1          2          3          4           5

DAUs/M   Retention   Engageme    Lifetime     User
 AUs      & Churn     nt Index    Value     Acquisitio
                                             n ROI
METRIC #1: DAU/MAU

WHY
 • Basic measure of loyalty for mobile games
 • Approximation of how many days per
   month a monthly active user is engaged
   with your app
 • Use to benchmark against other games

HOW
 • You can obtain DAU and MAU data from a
   mobile-specific analytics provider
METRIC #2: RETENTION &
CHURN
WHY
 • DAUs/MAUs do not fully equal loyalty
 • Retention rate can decrease while
   DAU/MAUs increase

HOW
 • Examine how long your users stay active
 • Use daily retention cohort analysis
WHAT IS A COHORT?
MEASURING PERFORMANCE OF
USERS OVER TIME
DAILY COHORTS ARE USED TO
MEASURE EFFECT OF IN-APP
CHANGES ON RETENTION
 Retention Rate


                  Retention Rate
                  Retention Rate
                    Evolution
                     Evolution
METRIC #3: ENGAGEMENT

WHY
 • Engaged app users are much more likely
   to spend money within your app


HOW
 • Using an Engagement Index, you can
   define what to tag as an engagement
   event and how much weight/value you
   want to place on each
 • Use daily engagement cohort analysis
DEFINING ENGAGEMENT
EVENTS - SAMPLE

                                  Engagement
            Action
                                  Index Weight
        Buy Virtual Good            100 points
   Add Virtual Item to Shopping
                                     80 points
                Cart
       Viewed virtual item           70 points
      Registered credit card         65 points
     Sharing achievement on
                                     60 points
            Facebook
     Reached a certain level         50 points
ENGAGEMENT INDEX IS A
BETTER FORM OF KPI


Each event can be assigned your own engagement
value, creating an Engagement Index
  – Examples: Search Product = 3 points, Check Price = 5
    points
USE COHORTS TO MEASURE
EFFECT OF IN-APP CHANGES ON
ENGAGEMENT
 Engagement Index


                    Engagement
                     Evolution
METRIC #4: LIFETIME VALUE
(LTV)

WHY
 • Measure the total revenue an active user
   generates within your apps

HOW
  • Automatically assign revenue events
  • Use funnels to optimize conversions
  • Use cohorts to track changes in user
    spend
MEASURE REVENUE, ARPU &
CORRELATE WITH
ENGAGEMENT


Each event can be assigned with revenue to
monitor ARPU
  – Example: Purchase Gold Coins = $0.99
TRACK REVENUE TO BETTER
UNDERSTAND USER SPEND
BEHAVIOR
USE FUNNELS TO MONITOR
CONVERSIONS
 View by segments
 View by segments       View by
                        View by
                        Conversion/Engagement/Revenue
                        Conversion/Engagement/Revenue


             Events across all applications can be selected as steps
             Events across all applications can be selected as steps
             or a goal
             or a goal
USE COHORTS TO MEASURE
EFFECT OF IN-APP CHANGES ON
REVENUE
 ARPU by Cohort


                   ARPU
                   ARPU
                  Evolution
                  Evolution
METRIC #5: USER
ACQUISITION ROI

WHY
 • Learn which acquisition sources provide
   the best return on investment for your
   marketing dollars

HOW
 • Measure effectiveness with referral
   tracking attribution
 • Tie back to LTV using cohort analytics
TRACK THE EFFECTIVENESS OF
YOUR ADVERTISING SPEND
USE COHORT TO OPTIMIZE AD
BUDGET BY LTV GENERATED
 ARPU by Acquisition
     Channel


                       ARPPU/LTV
                       ARPPU/LTV
                        Evolution
                        Evolution
REMARKET
NOW THAT I’M MEASURING
LTV…HOW DO I INCREASE IT?
REMARKET TO USERS TO
INCREASE REVENUE
USE CAMPAIGNS TO MAXIMIZE
CUSTOMER LTV


 Reactivate             Complete              Promote

 •   Bring high value   •   Direct users to   •   Cross-promote
     users back to          complete an           your apps &
     your app               abandoned             products
                            purchase
DEFINING YOUR BEST
AUDIENCES IS KEY TO
REMARKETING SUCCESS -
EXAMPLE

                  Any – Any Fish Tank user in the United
                  States or using Android or that has
                  completed Level 2 or that has spent
                  more than $2.00
                  more than $2.00


All – Fish Tank 2 users in France and
                  users
using an iPhone and have finished the
                                    the
tutorial and have an engagement score
tutorial and
greater than 65
SUMMARY & NEXT STEPS
MARKETERS MUST
EFFECTIVELY CONTROL THE
FULL USER LIFECYCLE

   Acquir      Analyze
     e


   Audience     Attribution   Retargeting
   Targeting
                Analytics
               In-App & LTV
                Analytics
OVERVIEW OF APSALAR
• Provider of Free 360O Analytics
  – Campaign Referral Measurement
  – In-App Analytics Including
     •   Audience Management & Segmentation
     •   Real Time Cohorts
     •   Real Time Funnels
     •   Automated Revenue And LTV Tools
• Audience Targeting & Retargeting Product
  In Beta
• San Francisco-Based
• Founded in 2010, VC-backed
APSALAR ANALYTICS HELPED
MOTION MATH DOUBLE
CONVERSIONS TO PAID


           ~2x
APSALAR AUDIENCES DELIVER
PAYING USERS


                  15
                  %


           ~8x
      2%
APSALAR POWERS THE
WORLD’S TOP APPS
QUESTIONS?

michael@apsalar.com

   http://apsalar.com

Michael Oiknine: Media App Summit

  • 1.
    FROM DOWNLOAD TO DOMINATION Engaging Mobile App Users with Analytics and Targeting Michael Oiknine CEO, Apsalar michael@apsalar.com
  • 2.
    THE MOBILE MINDSHAREWAR LEADS TO… Discovery Install Engagement Problem Problem Used Weekly Used Daily Rarely Used 1.3MM+ Apps in iOS & Android App Stores 1.3MM+ Apps in iOS & Android App Stores
  • 3.
    … AN ENGAGEMENTPROBLEM Average Sessions Per App Decreases by 20% Per Average Sessions Per App Decreases by 20% Per User User for Each Additional App Installed for Each Additional App Installed
  • 4.
  • 5.
    MARKETERS MUST EFFECTIVELY CONTROLTHE FULL USER LIFECYCLE Acquir Analyze e Audience Attribution Retargeting Targeting Analytics In-App & LTV Analytics
  • 6.
  • 7.
    ALL USERS ARENOT CREATED EQUAL 98%+ of users spend nothing or very little in apps
  • 8.
    MANY ACQUISITION METHODS AREEXPENSIVE -YET DON’T LEAD TO PAYING USERS +56% CPI Increase on iOS since January +70% CPI Increase on Android
  • 9.
    ACQUIRE THE RIGHTUSERS FOR YOUR APPS Get The Right Mobile App Reach As Many Users As Users Possible • Build highly targeted • Anytime, anywhere audiences • Leverage partnerships with 3rd • Acquire paying & engaged party exchanges, networks, users RTB platforms
  • 10.
    NOT ALL ACQUISITION SOURCESARE CREATED EQUAL- ILLUSTRATION Blind Ad Incentivized Audience Retargeting Network Installs Targeting Existing Users Budget $500 $500 $500 $500 Cost Per Install $3 to $5 $0.5 to $1 $2 $1 Users 100 1,000 250 500 % of Paying Less than More than More than Less than 1% Users 2% 10% 10% Paying Users 2 10 25 50 Sample ROI -90% -75% +75% +100%
  • 11.
    AUDIENCE TARGETING DRIVES PAYINGUSERS Target Lookalike Audience
  • 12.
  • 13.
    NICE! YOU HAVEUSERS AND THINK THEY’RE ENGAGED… OR ARE THEY? Find out using mobile analytics
  • 14.
    QUESTIONS YOU SHOULDBE ABLE TO ANSWER 1. Who are my high value users? 2. What’s the lifetime value of my users? 3. How are changes in my app affecting revenue, engagement & monetization? 4. What’s the retention rate of my users? 5. What’s the ROI across each of my acquisition sources (ex. Facebook)?
  • 15.
    ACTIONABLE METRICS YOU SHOULDBE TRACKING 1 2 3 4 5 DAUs/M Retention Engageme Lifetime User AUs & Churn nt Index Value Acquisitio n ROI
  • 16.
    METRIC #1: DAU/MAU WHY • Basic measure of loyalty for mobile games • Approximation of how many days per month a monthly active user is engaged with your app • Use to benchmark against other games HOW • You can obtain DAU and MAU data from a mobile-specific analytics provider
  • 17.
    METRIC #2: RETENTION& CHURN WHY • DAUs/MAUs do not fully equal loyalty • Retention rate can decrease while DAU/MAUs increase HOW • Examine how long your users stay active • Use daily retention cohort analysis
  • 18.
    WHAT IS ACOHORT? MEASURING PERFORMANCE OF USERS OVER TIME
  • 19.
    DAILY COHORTS AREUSED TO MEASURE EFFECT OF IN-APP CHANGES ON RETENTION Retention Rate Retention Rate Retention Rate Evolution Evolution
  • 20.
    METRIC #3: ENGAGEMENT WHY • Engaged app users are much more likely to spend money within your app HOW • Using an Engagement Index, you can define what to tag as an engagement event and how much weight/value you want to place on each • Use daily engagement cohort analysis
  • 21.
    DEFINING ENGAGEMENT EVENTS -SAMPLE Engagement Action Index Weight Buy Virtual Good 100 points Add Virtual Item to Shopping 80 points Cart Viewed virtual item 70 points Registered credit card 65 points Sharing achievement on 60 points Facebook Reached a certain level 50 points
  • 22.
    ENGAGEMENT INDEX ISA BETTER FORM OF KPI Each event can be assigned your own engagement value, creating an Engagement Index – Examples: Search Product = 3 points, Check Price = 5 points
  • 23.
    USE COHORTS TOMEASURE EFFECT OF IN-APP CHANGES ON ENGAGEMENT Engagement Index Engagement Evolution
  • 24.
    METRIC #4: LIFETIMEVALUE (LTV) WHY • Measure the total revenue an active user generates within your apps HOW • Automatically assign revenue events • Use funnels to optimize conversions • Use cohorts to track changes in user spend
  • 25.
    MEASURE REVENUE, ARPU& CORRELATE WITH ENGAGEMENT Each event can be assigned with revenue to monitor ARPU – Example: Purchase Gold Coins = $0.99
  • 26.
    TRACK REVENUE TOBETTER UNDERSTAND USER SPEND BEHAVIOR
  • 27.
    USE FUNNELS TOMONITOR CONVERSIONS View by segments View by segments View by View by Conversion/Engagement/Revenue Conversion/Engagement/Revenue Events across all applications can be selected as steps Events across all applications can be selected as steps or a goal or a goal
  • 28.
    USE COHORTS TOMEASURE EFFECT OF IN-APP CHANGES ON REVENUE ARPU by Cohort ARPU ARPU Evolution Evolution
  • 29.
    METRIC #5: USER ACQUISITIONROI WHY • Learn which acquisition sources provide the best return on investment for your marketing dollars HOW • Measure effectiveness with referral tracking attribution • Tie back to LTV using cohort analytics
  • 30.
    TRACK THE EFFECTIVENESSOF YOUR ADVERTISING SPEND
  • 31.
    USE COHORT TOOPTIMIZE AD BUDGET BY LTV GENERATED ARPU by Acquisition Channel ARPPU/LTV ARPPU/LTV Evolution Evolution
  • 32.
  • 33.
    NOW THAT I’MMEASURING LTV…HOW DO I INCREASE IT?
  • 34.
    REMARKET TO USERSTO INCREASE REVENUE
  • 35.
    USE CAMPAIGNS TOMAXIMIZE CUSTOMER LTV Reactivate Complete Promote • Bring high value • Direct users to • Cross-promote users back to complete an your apps & your app abandoned products purchase
  • 36.
    DEFINING YOUR BEST AUDIENCESIS KEY TO REMARKETING SUCCESS - EXAMPLE Any – Any Fish Tank user in the United States or using Android or that has completed Level 2 or that has spent more than $2.00 more than $2.00 All – Fish Tank 2 users in France and users using an iPhone and have finished the the tutorial and have an engagement score tutorial and greater than 65
  • 37.
  • 38.
    MARKETERS MUST EFFECTIVELY CONTROLTHE FULL USER LIFECYCLE Acquir Analyze e Audience Attribution Retargeting Targeting Analytics In-App & LTV Analytics
  • 39.
    OVERVIEW OF APSALAR •Provider of Free 360O Analytics – Campaign Referral Measurement – In-App Analytics Including • Audience Management & Segmentation • Real Time Cohorts • Real Time Funnels • Automated Revenue And LTV Tools • Audience Targeting & Retargeting Product In Beta • San Francisco-Based • Founded in 2010, VC-backed
  • 40.
    APSALAR ANALYTICS HELPED MOTIONMATH DOUBLE CONVERSIONS TO PAID ~2x
  • 41.
  • 42.
  • 43.