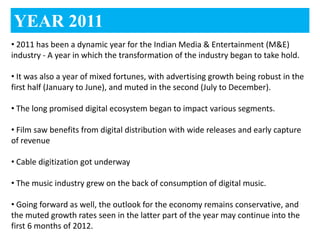
Indian Media & Entertainment Industry 2012
YEAR 2011
• 2011 has been a dynamic year for the Indian Media & Entertainment (M&E)
industry - A year in which the transformation of the industry began to take hold.

• It was also a year of mixed fortunes, with advertising growth being robust in the
first half (January to June), and muted in the second (July to December).

• The long promised digital ecosystem began to impact various segments.

• Film saw benefits from digital distribution with wide releases and early capture
of revenue

• Cable digitization got underway

• The music industry grew on the back of consumption of digital music.

• Going forward as well, the outlook for the economy remains conservative, and
the muted growth rates seen in the latter part of the year may continue into the
first 6 months of 2012.
CONTENTS
• MEDIA & ENTERTAINMENT INDUSTRY IN 2011
  - Television
   - Print
   - Films
   - Radio
   - Music
   - Out of home
•THE EMERGING PICTURE
•NEW MEDIA
•DEAL ACTIVITY
MEDIA SCENERIO- INDIA
• 146 million television
households
• Over 825 channels
• 82,000 newspapers
• 181.91 million readership
• 132 million internet users
• 44.21 million private DTH
subscribers
• 903 million wireless
subscribers
• 245 Private FM channels
INDUSTRY SIZE & PROJECTIONS
• The Indian M&E industry grew from INR 652 billion in 2010 to INR 728
billion in 2011, registering an overall growth of 12 percent.
• Strong consumption trends in Tier 2 and 3 cities
• Continued growth of regional media and fast increasing new media
businesses.
• The industry is estimated to achieve a growth of 13 percent in 2012 to
touch INR 823 billion.
• The sector is projected to grow at a healthy CAGR of 14.9 percent to
reach INR 1,457 billion by 2016.
• Television continues to be the dominant medium
• Animation and VFX, digital advertising and gaming are fast increasing
their share in the overall pie.
• Radio is expected to display a healthy growth rate after the
implementation of Phase 3.
• Print, while witnessing a decline in growth rate, will still continue to be
the second largest medium in the Indian M&E industry.
INDUSTRY SIZE & PROJECTIONS
ADVERTISING TRENDS &
•PROJECTIONS media accounted for INR 300 billion in
 Advertising spends across all
2011, contributing to 41 percent of the overall M&E industry
revenues.

• Advertising revenues witnessed a growth of 13 percent in 2011 as
against 17 percent observed in 2010.

• Print is the largest contributor accounting for INR 139 billion and 46
percent of the advertising pie.

• It is expected to continue being the most dominant medium for
next 5 years, despite the threat from new digital platforms.

• Advertising spends are expected to grow at a CAGR of 14 percent
to reach INR 586 billion in 2016.
ADVERTISING REVENUE-
GLOBAL
ADVERTISING REVENUE- INDIA
CONTRIBUTION-           PERCENTAGE-
ad revenues of          share of ad spend
overall industry size   by media
KEY THEMES and TRENDS
•GOING FORWARD
 Growth drivers for multiplex exhibitors
 Digital technology continues to revolutionize media distribution
• Media on the go: Proliferation of New age user devices
 Media consumption more personal than ever (Smart phones, tablets, PCs,
 gaming devices, etc.)
• Regional markets bucking the recessionary trends and continuing
growth momentum
• Increasingly savvy and ‘new age’ consumers
•Integration and innovation across traditional and new media, changing
media consumption habits and preferences for niche content, more touch
points to engage with audiences.
• M&E still an advertising revenue dependant industry
• Awaited Regulatory shifts
 Digitization for cable, Radio licensing implementation of Phase 3,
 copyright clarification for Radio and the roll out of 4G.
INTRODUCTION
• Television is the largest medium for media delivery in India in terms of
revenue, representing around 45 percent of the total media industry.
• Television penetration in India is still at approximately 60 percent of total
households.
• India continues to be the third largest TV market after USA and China with 146
million television households.
• Cable and Satellite (C&S) penetration of television households is close
  to 80 percent.
• The over-all television industry was estimated to be INR 329 billion in 2011, and
is expected to grow at a CAGR of 17 percent over 2011-16, to reach INR 735 billion
in 2016.
• The share of subscription to the total industry revenue is expected to increase
from 65 percent in 2011 to 69 percent in 2016.
• Significant increase in advertisement inventory, advertisement rates have
generally remained flat or declined in 2011.
• However, with a large number of untapped advertisers who are currently using
only the print platform, there is potential for further growth for TV.
TV INDUSTRY SIZE
SIGNIFICANT potential for growth
GROWTH in no. of GROWTH in TV
paid C&S         viewing time
households
AVERAGE REVNUE PER UNIT
NO. OF SUBSCRIBERS
KEY ADVERTISERS


- Advertisement inventory levels increased by 14 percent in 2011, driven by a
higher number of channels and commercial time per hour of programming.
TOP 10 CATEGORIES ADVERTISING
ON TV              • FMCG continued to be the
                            dominant sector, representing 43
                            percent of ad volumes.
                            • The top 10 sectors accounted for
                            around 60 percent of the overall
                            TV advertising volume share
                            during 2011.
                            • Within services, DTH was the
                            largest category, followed by real-
                            estate.
                            • Newer categories of advertisers
                            such as internet / new media
                            companies use the television
                            medium, with advertisers such as
                            Flipkart, Justdial, Quickr etc.
TOP             VIEWERSHIP
ADVERTISERS     SHARE BY
ON TELEVISION   GENRES
REGIONAL MARKET SIZE
LANGUAGE-WISE CHANNEL SHARE
INTRODUCTION
• INR 209 billion print industry grew by 8.4 percent from INR 193 billion in
2010.
• The growth in advertisement revenues has been at a CAGR of 8.7
percent, whereas circulation revenues have displayed a CAGR of 3.7
percent between 2007 and 2011.
• The advertisement revenues continued to be the main source of revenue
for the print industry, contributing 67 percent to industry’s revenues.
• The big spending sectors such as education, BFSI and retail tightened
budgets.
• The newspaper advertisement volumes increased from 238 million
column centimetre of ad space in 2010 to 280 million column centimetre
in 2011.
• The industry also saw a 22 percent increase in the number of advertisers.
ADEVERTISING VS. CIRCULATION
MIX
DAILY PRINT AD VOLUMES
TOP CATEGORIES ADVERTISED ON
PRINT
NEWSPAPER VS. MAGAZINE
RISE OF NEW CONSUMPTION
CENTERS


Focus is now shifting to the next 40 cities…
RISE OF NEW CONSUMPTION
CENTERS
AIR OF TOP 10   AIR BY
DAILIES         LANGUAGE
LANGUAGE-WISE REVENUE &
READERSHIP SPLIT


• Together, the Hindi and Vernacular markets are expected to grow at a
CAGR of 10.9 percent over the period 2011-16, outpacing the English
language market’s growth of 6.3 percent.

• The pan India reach of regional newspapers is 173.80 million compared
to only 22.21 million in case of English newspapers.
TOP STATES BY PER CAPITA
INCOME
TOP 5 PUBLICATIONS BY
READERSHIP-MAHARASHTRA


Global trends
•Audience shift from print to online
•Content aggregators corner a larger slice of the advertising pie
•Online channels of distribution continue to explode
•Younger generation demands on-the-move accessibility
PRINT PENETERATION- URBAN VS.
RURAL SPLIT
FUTURE OUTLOOK
INDUSTRY PERFORMANCE &
PROJECTIONS
• The Indian film industry was estimated to be INR 93 Billion in 2011 indicating a
growth of 11.5 percent vis-à-vis 2010.
• 26 percent growth in Cable and satellite rights.
• Ancillary revenues such as licensing and merchandising, in-cinema advertising and
pay per view also displayed strong growth in 2011.
REVENUE SPLIT
2011            2016P
SCREEN               AVERAGE
DENSITY- per         REVENUE MIX
million population   of multiplex
CINEMA ADVERTISING
• The cinema advertising market has grown at a robust 18 percent in
2011 to reach INR 140 Crs.

• Digital cinema providers such as UFO Moviez and Real Image have
cornered the bulk (~ 70percent) of this advertising revenue while film
exhibitors take the rest of the pie.

• Advertising revenue is expected to contribute to 30 percent of total
digital cinema revenue this year as compared to 24 percent in the last
financial year.

• Cinema advertising is projected to account for a sizeable share (~ 40
percent) of revenue for digital cinema providers in next few years.
DIGITAL MEDIA
• New media continued its growth trajectory in 2011, with estimated
growth in advertising revenues in excess of 40 percent over last year.
Coming in at approximately INR 15.4 billion in revenue in 2011.

• Digital ad spend reached approximately 5 percent of total media and
entertainment industry advertising revenue.

• This share is expected to continue to grow over the coming years,
driven by significantly higher growth rates in online advertising spend
compared to traditional media.

• Continued growth in internet penetration and mobile device access
is expected to drive consumption, and hence revenue growth.
INTERNET VS.   ACTIVE
TV             INTERNET
PENETRATION    ENABLED
               SMART PHONES
PENETERATION     TIME SPENT
OF ACTIVITIES-   ON SMART
internet users   PHONE
DIGITAL ADVERTISING MARKET
INTERNET   INTERNET
SHARE OF   SHARE OF
WORLD AD   INDIA AD
SPEND      SPEND
PORTALS & SOCIAL MEDIA
ONLINE CLASSIFIEDS
ONLINE CLASSIFIED SEGMENTS
INTRODUCTION
•The industry grew at 15 percent in CY 2011 to reach INR 11.5 billion
compared to INR 10 billion in CY 2010.

• The ad rates in metros increased by ~7-10 percent and the utilization was
also slightly better.

• Smaller cities the stations witnessed similar growth of 15 percent-18
percent in ad revenues driven largely by increased utilization as ad rates
remained steady.

• Utilization levels are now in the 70-85 percent range in the top eight
metros, and in the 50-65 percent range in key non metros, leaving room for
volume growth.

• Players like Radio Mirchi and HT Media reporting growth rates above 35
percent on a quarter on quarter basis.
REVENUE GROWTH
TOP CATEGORIES ADVERTISED ON
RADIO
PROJECTED REVENUE GROWTH


• Increased listenership of radio on mobiles
• Content differentiation
• Targeting newer segments and geographies
• Activations / events business
INDUSTRY OVERVIEW
• The Indian music industry achieved revenues of INR 9 billion in
2011, registering a growth of 5 percent over 2010.
• The industry witnessed a 19 percent Y-o-Y decline in sales of
physical music, which was compensated by a significant jump of 24
percent Y-o-Y in digital music consumed.
• New trends- Different digital platforms such as pay per download,
unlimited music streaming and subscription based music services.
• Film music (both Bollywood and regional film music) continues to
approximately 70 percent to the industry’s revenues.
• The younger generation is now being exposed to newer genres,
leading to a growing demand for non-film music.
• This trend was reflected in greater investments by the music
industry to identify and promote independent artists, and also in
increased traction in live performances.
INDUSTRY PERFORMANCE
PHYSICAL VS. DIGITAL SALES


• The digital music industry stood at INR 5.2 billion in 2011 making up 58 percent of
the revenues of the music industry. The industry grew at 24 percent Y-o-Y compared
to 2010 and is expected to touch INR 14.3 billion by 2016.
• Mobile contributes roughly 90 percent to the total sales
KEY TRENDS & DEVELOPMENT
• App-economy enhances music consumption
• Emerging Business Models
• Power of Social Media
• Rise of independent music (Live From the Console, Folktronic
and Zomba)
• Viral Marketing
• Labels embrace band management
• Reviving the era of LPs
• Regional music – the next frontier of growth
• Music publishing to take off in India
LIVE MUSIC
• The number of live events in the country has increased by nearly
15-20 times between 2004 and 2011.
• India had approximately 300-400 live events IN 2004, the number
increased to 6000-7000 in 2011 with ticket prices also increasing
substantially.
• The daily audience count of the three-day long NH7 Weekender
music festival in Pune soared to nearly 10,000 in 2011 from 3,500 in
2010.
•Many international artists made their India debut, including pop
artist Lady Gaga, rapper and singer, Pit bull etc.
• Industry discussions reveal that ticket prices have been growing
steadily, with the average ticket price for a live concert now being in
the range of INR 2000-2,500.
• The concert tickets of Indian artists such as Shankar and A.R.
Rahman were sold for INR 1000-2000 per ticket.
MAJOR MUSIC EVENTS held in 2011
HURDLES FOR GROWTH OF LIVE
MUSIC
• Lack of infrastructure and venues: (the cities in Europe and America have at least
50 standing venues where a performer just needs to plug in and play, there is
not a single such venue in India).

• Licenses: The organizers require a host of permissions for hosting a live event.
Getting these clearances and licenses is a cumbersome task for the organisers.

• Entertainment tax: High rate of entertainment tax on the live shows is another
factor stunting the growth of live concerts.

• Security Concerns: Most international artists are reluctant to perform in India
owing to security concerns (Bryan Adams and Metallica in Gurgaon had to be
cancelled at the last moment due to lack of security arrangements).

• Dependence on sponsors: Most events in India are sponsorship driven rather than
ticket sales driven. As per industry estimates, 60 percent of the revenue is
generated from sponsorship and only 25 percent from the ticket sales. Hence
many events suffer from the fickleness of the sponsors.
FUTURE THEMES


• Music on cloud
• Technology transforming music
• Music discovery to become easier
• Video Consumption to rise
FUTURE OUTLOOK
OUTLOOK FOR THE YEAR


•Industry spent approximately INR 17.75 billion in 2011 on Out-of-
Home (OOH) advertising which amounts to approximately 5 percent
of total advertisement spends.

• The OOH sector was hit relatively harder than other sectors of the
Advertising industry and the sector registered a Y-o-Y growth of 7.6
Percent.
CONTRIBUTION OF VARIOUS
SECTORS


• The Industry saw a reduction in spends by telecom players, who
were the leaders in the last five years.
• This was offset by increased spend by auto companies, Entry of web
based E-commerce companies, thrust in the entertainment space
driven by release of large budget movies, TV channels and DTH, and
increased real estate spends.
REVENUE SPLITS BY FORMATS
FUTURE OUTLOOK
OVERVIEW
• The year saw mergers and acquisitions
and private equity funding clocking over
1000 deals and contributing over USD 50
billion.

• Deal activity in the M&E sector
witnessed a significant uptrend in 2011
with 42 transactions valued at USD 940
million as compared to 27 transactions
valued at USD 693 million in 2010 and
27 transactions valued at USD 722
million in 2009.

• Television was the largest
contributor, accounting for USD 320
million of the total deal value.
KEY DEALS
Media & Entertainment Industry 2012

Media & Entertainment Industry 2012

  • 1.
    Indian Media &Entertainment Industry 2012
  • 2.
    YEAR 2011 • 2011has been a dynamic year for the Indian Media & Entertainment (M&E) industry - A year in which the transformation of the industry began to take hold. • It was also a year of mixed fortunes, with advertising growth being robust in the first half (January to June), and muted in the second (July to December). • The long promised digital ecosystem began to impact various segments. • Film saw benefits from digital distribution with wide releases and early capture of revenue • Cable digitization got underway • The music industry grew on the back of consumption of digital music. • Going forward as well, the outlook for the economy remains conservative, and the muted growth rates seen in the latter part of the year may continue into the first 6 months of 2012.
  • 3.
    CONTENTS • MEDIA &ENTERTAINMENT INDUSTRY IN 2011 - Television - Print - Films - Radio - Music - Out of home •THE EMERGING PICTURE •NEW MEDIA •DEAL ACTIVITY
  • 5.
    MEDIA SCENERIO- INDIA •146 million television households • Over 825 channels • 82,000 newspapers • 181.91 million readership • 132 million internet users • 44.21 million private DTH subscribers • 903 million wireless subscribers • 245 Private FM channels
  • 6.
    INDUSTRY SIZE &PROJECTIONS • The Indian M&E industry grew from INR 652 billion in 2010 to INR 728 billion in 2011, registering an overall growth of 12 percent. • Strong consumption trends in Tier 2 and 3 cities • Continued growth of regional media and fast increasing new media businesses. • The industry is estimated to achieve a growth of 13 percent in 2012 to touch INR 823 billion. • The sector is projected to grow at a healthy CAGR of 14.9 percent to reach INR 1,457 billion by 2016. • Television continues to be the dominant medium • Animation and VFX, digital advertising and gaming are fast increasing their share in the overall pie. • Radio is expected to display a healthy growth rate after the implementation of Phase 3. • Print, while witnessing a decline in growth rate, will still continue to be the second largest medium in the Indian M&E industry.
  • 7.
    INDUSTRY SIZE &PROJECTIONS
  • 8.
    ADVERTISING TRENDS & •PROJECTIONSmedia accounted for INR 300 billion in Advertising spends across all 2011, contributing to 41 percent of the overall M&E industry revenues. • Advertising revenues witnessed a growth of 13 percent in 2011 as against 17 percent observed in 2010. • Print is the largest contributor accounting for INR 139 billion and 46 percent of the advertising pie. • It is expected to continue being the most dominant medium for next 5 years, despite the threat from new digital platforms. • Advertising spends are expected to grow at a CAGR of 14 percent to reach INR 586 billion in 2016.
  • 9.
  • 10.
  • 11.
    CONTRIBUTION- PERCENTAGE- ad revenues of share of ad spend overall industry size by media
  • 12.
    KEY THEMES andTRENDS •GOING FORWARD Growth drivers for multiplex exhibitors Digital technology continues to revolutionize media distribution • Media on the go: Proliferation of New age user devices Media consumption more personal than ever (Smart phones, tablets, PCs, gaming devices, etc.) • Regional markets bucking the recessionary trends and continuing growth momentum • Increasingly savvy and ‘new age’ consumers •Integration and innovation across traditional and new media, changing media consumption habits and preferences for niche content, more touch points to engage with audiences. • M&E still an advertising revenue dependant industry • Awaited Regulatory shifts Digitization for cable, Radio licensing implementation of Phase 3, copyright clarification for Radio and the roll out of 4G.
  • 14.
    INTRODUCTION • Television isthe largest medium for media delivery in India in terms of revenue, representing around 45 percent of the total media industry. • Television penetration in India is still at approximately 60 percent of total households. • India continues to be the third largest TV market after USA and China with 146 million television households. • Cable and Satellite (C&S) penetration of television households is close to 80 percent. • The over-all television industry was estimated to be INR 329 billion in 2011, and is expected to grow at a CAGR of 17 percent over 2011-16, to reach INR 735 billion in 2016. • The share of subscription to the total industry revenue is expected to increase from 65 percent in 2011 to 69 percent in 2016. • Significant increase in advertisement inventory, advertisement rates have generally remained flat or declined in 2011. • However, with a large number of untapped advertisers who are currently using only the print platform, there is potential for further growth for TV.
  • 15.
  • 16.
  • 17.
    GROWTH in no.of GROWTH in TV paid C&S viewing time households
  • 18.
  • 19.
  • 20.
    KEY ADVERTISERS - Advertisementinventory levels increased by 14 percent in 2011, driven by a higher number of channels and commercial time per hour of programming.
  • 21.
    TOP 10 CATEGORIESADVERTISING ON TV • FMCG continued to be the dominant sector, representing 43 percent of ad volumes. • The top 10 sectors accounted for around 60 percent of the overall TV advertising volume share during 2011. • Within services, DTH was the largest category, followed by real- estate. • Newer categories of advertisers such as internet / new media companies use the television medium, with advertisers such as Flipkart, Justdial, Quickr etc.
  • 22.
    TOP VIEWERSHIP ADVERTISERS SHARE BY ON TELEVISION GENRES
  • 23.
  • 24.
  • 26.
    INTRODUCTION • INR 209billion print industry grew by 8.4 percent from INR 193 billion in 2010. • The growth in advertisement revenues has been at a CAGR of 8.7 percent, whereas circulation revenues have displayed a CAGR of 3.7 percent between 2007 and 2011. • The advertisement revenues continued to be the main source of revenue for the print industry, contributing 67 percent to industry’s revenues. • The big spending sectors such as education, BFSI and retail tightened budgets. • The newspaper advertisement volumes increased from 238 million column centimetre of ad space in 2010 to 280 million column centimetre in 2011. • The industry also saw a 22 percent increase in the number of advertisers.
  • 27.
  • 28.
  • 29.
  • 30.
  • 31.
    RISE OF NEWCONSUMPTION CENTERS Focus is now shifting to the next 40 cities…
  • 32.
    RISE OF NEWCONSUMPTION CENTERS
  • 33.
    AIR OF TOP10 AIR BY DAILIES LANGUAGE
  • 34.
    LANGUAGE-WISE REVENUE & READERSHIPSPLIT • Together, the Hindi and Vernacular markets are expected to grow at a CAGR of 10.9 percent over the period 2011-16, outpacing the English language market’s growth of 6.3 percent. • The pan India reach of regional newspapers is 173.80 million compared to only 22.21 million in case of English newspapers.
  • 35.
    TOP STATES BYPER CAPITA INCOME
  • 36.
    TOP 5 PUBLICATIONSBY READERSHIP-MAHARASHTRA Global trends •Audience shift from print to online •Content aggregators corner a larger slice of the advertising pie •Online channels of distribution continue to explode •Younger generation demands on-the-move accessibility
  • 37.
  • 38.
  • 40.
    INDUSTRY PERFORMANCE & PROJECTIONS •The Indian film industry was estimated to be INR 93 Billion in 2011 indicating a growth of 11.5 percent vis-à-vis 2010. • 26 percent growth in Cable and satellite rights. • Ancillary revenues such as licensing and merchandising, in-cinema advertising and pay per view also displayed strong growth in 2011.
  • 41.
  • 42.
    SCREEN AVERAGE DENSITY- per REVENUE MIX million population of multiplex
  • 43.
    CINEMA ADVERTISING • Thecinema advertising market has grown at a robust 18 percent in 2011 to reach INR 140 Crs. • Digital cinema providers such as UFO Moviez and Real Image have cornered the bulk (~ 70percent) of this advertising revenue while film exhibitors take the rest of the pie. • Advertising revenue is expected to contribute to 30 percent of total digital cinema revenue this year as compared to 24 percent in the last financial year. • Cinema advertising is projected to account for a sizeable share (~ 40 percent) of revenue for digital cinema providers in next few years.
  • 45.
    DIGITAL MEDIA • Newmedia continued its growth trajectory in 2011, with estimated growth in advertising revenues in excess of 40 percent over last year. Coming in at approximately INR 15.4 billion in revenue in 2011. • Digital ad spend reached approximately 5 percent of total media and entertainment industry advertising revenue. • This share is expected to continue to grow over the coming years, driven by significantly higher growth rates in online advertising spend compared to traditional media. • Continued growth in internet penetration and mobile device access is expected to drive consumption, and hence revenue growth.
  • 46.
    INTERNET VS. ACTIVE TV INTERNET PENETRATION ENABLED SMART PHONES
  • 47.
    PENETERATION TIME SPENT OF ACTIVITIES- ON SMART internet users PHONE
  • 48.
  • 49.
    INTERNET INTERNET SHARE OF SHARE OF WORLD AD INDIA AD SPEND SPEND
  • 50.
  • 51.
  • 52.
  • 54.
    INTRODUCTION •The industry grewat 15 percent in CY 2011 to reach INR 11.5 billion compared to INR 10 billion in CY 2010. • The ad rates in metros increased by ~7-10 percent and the utilization was also slightly better. • Smaller cities the stations witnessed similar growth of 15 percent-18 percent in ad revenues driven largely by increased utilization as ad rates remained steady. • Utilization levels are now in the 70-85 percent range in the top eight metros, and in the 50-65 percent range in key non metros, leaving room for volume growth. • Players like Radio Mirchi and HT Media reporting growth rates above 35 percent on a quarter on quarter basis.
  • 55.
  • 56.
  • 57.
    PROJECTED REVENUE GROWTH •Increased listenership of radio on mobiles • Content differentiation • Targeting newer segments and geographies • Activations / events business
  • 59.
    INDUSTRY OVERVIEW • TheIndian music industry achieved revenues of INR 9 billion in 2011, registering a growth of 5 percent over 2010. • The industry witnessed a 19 percent Y-o-Y decline in sales of physical music, which was compensated by a significant jump of 24 percent Y-o-Y in digital music consumed. • New trends- Different digital platforms such as pay per download, unlimited music streaming and subscription based music services. • Film music (both Bollywood and regional film music) continues to approximately 70 percent to the industry’s revenues. • The younger generation is now being exposed to newer genres, leading to a growing demand for non-film music. • This trend was reflected in greater investments by the music industry to identify and promote independent artists, and also in increased traction in live performances.
  • 60.
  • 61.
    PHYSICAL VS. DIGITALSALES • The digital music industry stood at INR 5.2 billion in 2011 making up 58 percent of the revenues of the music industry. The industry grew at 24 percent Y-o-Y compared to 2010 and is expected to touch INR 14.3 billion by 2016. • Mobile contributes roughly 90 percent to the total sales
  • 62.
    KEY TRENDS &DEVELOPMENT • App-economy enhances music consumption • Emerging Business Models • Power of Social Media • Rise of independent music (Live From the Console, Folktronic and Zomba) • Viral Marketing • Labels embrace band management • Reviving the era of LPs • Regional music – the next frontier of growth • Music publishing to take off in India
  • 63.
    LIVE MUSIC • Thenumber of live events in the country has increased by nearly 15-20 times between 2004 and 2011. • India had approximately 300-400 live events IN 2004, the number increased to 6000-7000 in 2011 with ticket prices also increasing substantially. • The daily audience count of the three-day long NH7 Weekender music festival in Pune soared to nearly 10,000 in 2011 from 3,500 in 2010. •Many international artists made their India debut, including pop artist Lady Gaga, rapper and singer, Pit bull etc. • Industry discussions reveal that ticket prices have been growing steadily, with the average ticket price for a live concert now being in the range of INR 2000-2,500. • The concert tickets of Indian artists such as Shankar and A.R. Rahman were sold for INR 1000-2000 per ticket.
  • 64.
    MAJOR MUSIC EVENTSheld in 2011
  • 65.
    HURDLES FOR GROWTHOF LIVE MUSIC • Lack of infrastructure and venues: (the cities in Europe and America have at least 50 standing venues where a performer just needs to plug in and play, there is not a single such venue in India). • Licenses: The organizers require a host of permissions for hosting a live event. Getting these clearances and licenses is a cumbersome task for the organisers. • Entertainment tax: High rate of entertainment tax on the live shows is another factor stunting the growth of live concerts. • Security Concerns: Most international artists are reluctant to perform in India owing to security concerns (Bryan Adams and Metallica in Gurgaon had to be cancelled at the last moment due to lack of security arrangements). • Dependence on sponsors: Most events in India are sponsorship driven rather than ticket sales driven. As per industry estimates, 60 percent of the revenue is generated from sponsorship and only 25 percent from the ticket sales. Hence many events suffer from the fickleness of the sponsors.
  • 66.
    FUTURE THEMES • Musicon cloud • Technology transforming music • Music discovery to become easier • Video Consumption to rise
  • 67.
  • 69.
    OUTLOOK FOR THEYEAR •Industry spent approximately INR 17.75 billion in 2011 on Out-of- Home (OOH) advertising which amounts to approximately 5 percent of total advertisement spends. • The OOH sector was hit relatively harder than other sectors of the Advertising industry and the sector registered a Y-o-Y growth of 7.6 Percent.
  • 70.
    CONTRIBUTION OF VARIOUS SECTORS •The Industry saw a reduction in spends by telecom players, who were the leaders in the last five years. • This was offset by increased spend by auto companies, Entry of web based E-commerce companies, thrust in the entertainment space driven by release of large budget movies, TV channels and DTH, and increased real estate spends.
  • 71.
  • 72.
  • 74.
    OVERVIEW • The yearsaw mergers and acquisitions and private equity funding clocking over 1000 deals and contributing over USD 50 billion. • Deal activity in the M&E sector witnessed a significant uptrend in 2011 with 42 transactions valued at USD 940 million as compared to 27 transactions valued at USD 693 million in 2010 and 27 transactions valued at USD 722 million in 2009. • Television was the largest contributor, accounting for USD 320 million of the total deal value.
  • 75.